The impact of employment barriers on the employment characteristics of persons with disabilities

Author: Natsun Leila N.
Journal: Economic and Social Changes: Facts, Trends, Forecast @volnc-esc-en
Section: Social and economic development
Article in issue: 5 т.15, 2022.
Free access
Disability is a complex phenomenon that generates a number of negative socio-economic consequences including working-age population decrease. At the same time, disability is not always accompanied by a complete loss of the ability to work. Usually, persons with disabilities of the second and third groups retain the opportunity to work in the presence of suitable conditions, but in practice the realization of their labor potential is limited by a number of circumstances. The purpose of this work is to substantiate the negative impact of barriers to employment of disabled people on the characteristics of their employment. Based on the statistical data analysis, we have shown a modern socio-demographic portrait of working disabled people, and analyzed the characteristics of their employment and economic activity. We have found that for a long period the highest economic activity was shown by persons with the third disability group. The paper proves that their higher representation in the composition of employed persons with disabilities is due, on the one hand, to less pronounced health disorders and relatively low need to create specialized jobs, and on the other hand, has economic prerequisites. We have shown that the realization of the labor potential of disabled people is not always accompanied by a significant increase in their material well-being. Employment for some disabled people may be a forced step, which confirms the prevalence among them of employment not in their specialty, as well as on the basis of an oral agreement, without official employment. The final part of the article outlines recommendations that can contribute to the fuller realization of the labor potential of disabled people and improve their financial situation.
Disability, work activity of disabled people, assistance in employment of disabled people, specialized workplaces, quotas of jobs for disabled people, gender and age structure of the contingent of employed disabled people
Short address: https://sciup.org/147239117
IDR: 147239117 | UDC: 314.44 | DOI: 10.15838/esc.2022.5.83.11
Text of the scientific article The impact of employment barriers on the employment characteristics of persons with disabilities
The World Health Organization estimates that 15% of the world’s population has some form of disability. Overall, there are more than 1 billion people with disabilities in the world1. Experts predict an increase in the scale of this acute problem due to demographic aging. In developed countries, chronic non-communicable diseases that accompany aging become the leading causes of disability and significantly reduce the quality of life2. The works of Russian and foreign authors have repeatedly demonstrated the relationship between the subjective assessments of health expressed by respondents and their socio-demographic characteristics (Maksimova, Lushkina, 2014; Pautova, Pautov, 2015; Fylkesnes, Forde, 1992; Idler, 1993). The Russian Federation is characterized by a significant decrease in selfassessments and objective health indicators of the population in the transition to older age groups (Denisova et al., 2018; Kaneva, 2016). It is this contingent of the population that constitutes the main risk group for the onset of disability.
In Russian conditions, the importance of the issues of preserving public health is closely related not only to the need to maintain its reproduction, but also to solving the problem of providing the economy with labor resources. Given the irreversibility of the demographic aging process and the inertia of behavioral practices of the population in the field of health care, we can assume that the issue of disability will not lose relevance in the next 10 years3. In this regard, it is important to analyze the labor potential possessed by persons with disabilities, as well as the sociodemographic portrait of working disabled people.
In developed countries, the involvement of disabled people in work is in the focus of social policy. In practice, several different approaches are used to promote their employment, corresponding to the chosen concept of social policy. The “supported employment” schemes demonstrate the greatest effectiveness, which involve the search for suitable jobs for applicants with disabilities in the free labor market while simultaneously implementing a number of measures that increase their competitiveness (Natsun, 2017). In addition to these support mechanisms, new employment opportunities for disabled people are associated with the development of flexible employment forms. However, such practices by themselves do not demonstrate the expected positive effect of employment growth among disabled people and should to be improved. For instance, the Italian experience shows that the state programs “flexicurity” (“flexible guarantees of security in the labor market”) are an attempt to take into account both the employers’ interest in a flexible workforce, and the workers’ need for security – confidence that they will not face long-term unemployment. But these programs, being focused mainly on employment assistance, do not provide guarantees of employees’ protection from subsequent dismissal (Agovino, Rapposelli, 2016a; Agovino, Rapposelli, 2016b). In practice, we recorded the negative impact of active policy of promoting the employment of people with disabilities on their employment indicators. The main reason for this paradox is that employers consider the employment of a person with disabilities economically unprofitable: the costs they carry out are not recouped by the tax benefits provided by the state (Agovino, Parodi, 2014).
The image of people with disabilities in society is formed on the basis of a number of stereotypes that prevent changes in the unfavorable situation in the field of protection of their rights and interests (Tarasenko, 2004) including in the labor market
(Olkhina et al., 2019). When finding employment, people with disabilities face many barriers including those associated with a negative attitude on the part of employers and psychological unwillingness to protect their interests (Smoleva, 2018). The lack of opportunities for people with disabilities to freely realize their own labor potential makes them dependent on social benefits consolidating vulnerable position in society. However, the fact of employment in itself does not mean the elimination of problems of social discrimination and social exclusion of people with disabilities. If these problems disappeared immediately after a disabled person got a job, then such phenomena as the deformity of the niche that disabled people occupy in the labor market and the very structure of their employment by type of economic activity4, the discrepancy between the education, qualifications of working disabled people and the requirements of the jobs they occupy would not be registered. These phenomena indirectly indicate the existence of significant obstacles to improving the financial situation of people with disabilities through the promotion of their employment5. The problems of overcoming discrimination against people with disabilities in the sphere of realizing their labor potential are not limited to the stage of finding a suitable job, but extend as a whole to the entire system of their social support.
Materials and methods of research
The information base of the research consists of the results of statistical including sample, observations on socio-demographic problems conducted by Rosstat, as well as data posted on the information portal of the Federal State Information System “Federal Register of Persons with Disabilities”.
The scientific problem of our research is to identify factors that reduce the effectiveness of employment as a tool for improving the material well-being of people with disabilities who are ready and willing to work. The research hypothesis is that with the observed employment characteristics of people with disabilities, employment does not make a significant contribution to improving their material well-being. The purpose of the work is to substantiate the negative impact of employment barriers on the employment characteristics of people with disabilities. Within the research framework, we have solved the following tasks: analysis of the sociodemographic portrait of employed people with disabilities, the employment effectiveness of people with disabilities, their employment characteristics, the contribution of labor income to the total monetary income of people with disabilities, as well as the formulation of recommendations to promote employment of people with disabilities.
To identify the current situation on the basis of statistics, we have made an assessment of the degree of inclusion of people with disabilities in work, and analyzed the employment features of people with disabilities in Russia, socio-demographic determinants of the employment and its impact on the material and social status of people with disabilities. Taking into account the research results and the secondary analysis of literary sources, we have justified the necessity of applying an individual approach to the employment of persons with disabilities.
Research results
People with disabilities as a socio-demographic group: population dynamics, gender and age structure of the contingent
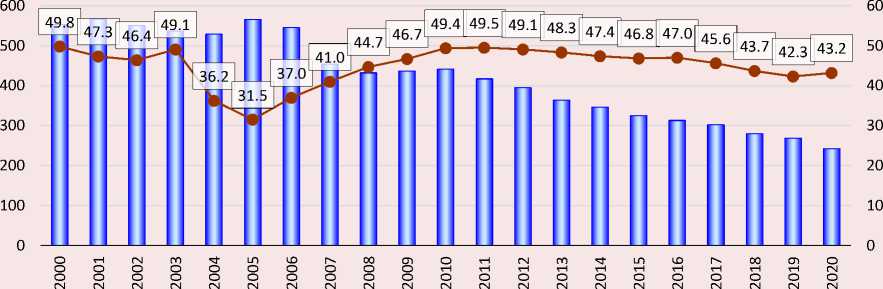
The total number of people with disabilities in the period from 2000 to 2021 exceeded 10 million people. The maximum value of the indicator was registered as of January 1, 2011 – 13.2 million people, the minimum – in 2000 – 10.5 million people. The value of this indicator grew in the period from 2000 to 2011; then there was a continuous downward trend. The dynamics of the indicator of primary disability is somewhat at odds with the dynamics of general disability. First of all, this indicator is characterized by more pronounced fluctuations in values: a distinct peak occurs in 2006. According to the research of Russian authors, in addition to changes in disability criteria, the main legislative changes that influenced primary disability were the expansion of the concept of “disability” itself (in 1996), the introduction (in 2005) and the subsequent abolition (in 2010) of linking the right to a disability pension to the degree of limited ability to work, “benefits monetization” (in 2005), abolition of the right to indefinite disability for persons of retirement age (in 2006) (Vasin, 2017; Demyanova, 2015; Kulagina, 2016). In contrast to the general indicator of the number of people with disabilities, after 2006, the number of people recognized as disabled for the first time has been continuously decreasing. Every year, the primary access of the population to disability ensured the replenishment of the total contingent of people with disabilities by 0.5–1.8 million people, which was from 5 to 14% of the total number of people with disabilities. The largest proportion of those recognized as disabled for the first time among their total contingent was recorded in 2006, and since 2016 it has not exceeded 5% (Fig. 1), which is determined by two points. First, a relatively high level of general disability remains against the background of a reduction in primary disability. Second, it is the specifics of the procedure of statistical accounting of disability. Cases of primary disability are registered on the basis of data on the population’s appeal to disability medical exam institutions for primary or repeated disability, which leads to an under-accounting of its cases – the formation of latent disability6. Since this problem can greatly affect the prediction of the dynamics of population health indicators, methodological approaches to identifying the level of “latent” disability using data from representative sociological studies are discussed7 (Natsun, 2021).
The structure of the contingent of people with disabilities is shifted toward older age groups. In 2020, among people with disabilities aged 15–72, the proportion of people aged 60–72 was 65.1 %8. We should note that it was the elderly population who reacted the most to changes in the state policy in the field of establishing disability criteria and the amount of social benefits. For instance, during the period of a sharp rise in primary disability in 2005– 2006, the greatest contribution to the formation of the upward dynamics was made by applications for disability from persons of retirement age, which is confirmed by data on primary disability among the working-age population: there was no sharp peak in this category during the same period. Moreover, after the abolition of the right to establish indefinite disability for persons of retirement age since 2006, the share of people with disabilities of working age in the contingent of people with disabilities began growing again (Fig. 2).
Figure 1. Dynamics of general, recurrent and primary disability of Russia’s adult population s 6000000
10] 10] 11 ] 11 ] 10] 13 ] 14 ]
100 11631000
11 8 7 7 7 6 6 6 6 5 5 5 5 5 5
10 0
-
□ Number of persons recognized as persons with disabilities repeatedly and with an indefinite disability
-
■ Number of persons aged 18 years and older recognized as persons with disabilities for the first time
-
■ Total number of persons with disabilities
С) Share of persons recognized as persons with disabilities for the first time in the total number of persons with disabilities
Source: Situation of persons with disabilities. Federal State Statistics Service. Available at: (accessed: April 20, 2022).
Figure 2. Dynamics of primary disability of working age adults in 2000–2020
■ — ■ Number of persons recognized as persons with disabilities for the first time in working age, thousand people
—e— Number of persons recognized as persons with disabilities for the first time in working age, % of the total number of persons with disabilities
Figure 3. Distribution of persons with disabilities aged 18 years and older by disability groups, thousand people
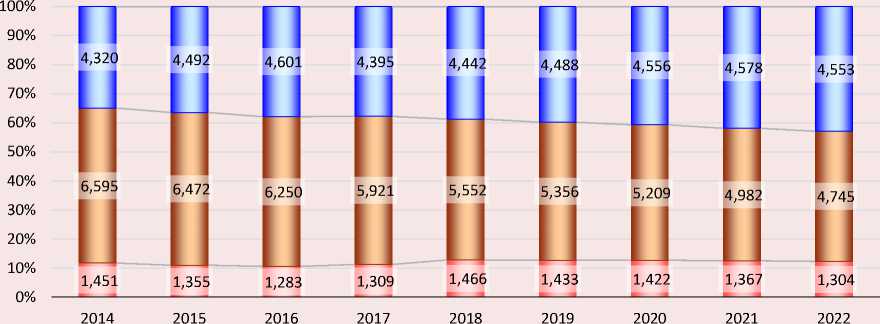
п 1st group □ 2nd group □ 3rd group
Source: Total number of persons with disabilities by disability groups in Russia’s entities. Federal State Statistics Service. Available at: (accessed: April 20, 2022).
As of January 1, 2022, more than 10 million adults with disabilities lived in Russia. In the period 2000–2022, population with disabilities was numerically dominated by persons with the second disability group, whose share gradually decreased (from 51 to 42%) against the background of an increase in the proportion of persons with the third disability group (from 33 to 40%) and the relatively stable proportion of persons with the first disability group (11.0% in 2017 and 11.5% in 2022; Fig. 3 ).
Socio-demographic portrait of employed persons with disabilities
In Russia, as of January 1, 2022, the number of employed persons with disabilities of working age amounted to 1.1 million people, among them women accounted for 44%, men – 56%9. The employment rate among women with disabilities aged 15–72 years was lower than among men during the entire period 2014–202010.
In the structure of employed persons with disabilities, the largest share fell on older age groups: 50–54 years is 15.1%, 55–59 years – 21.8%, 60–69 years – 16.9%. This pattern was typical for the group of employees under consideration throughout the entire period 2014–2020, for which there are available statistical data (Fig. 4) .
Among the working persons with disabilities, the largest share is made up of persons with the third disability group. This is due to a number of circumstances, primarily objectively a better state of health (in comparison with persons of the first and second disability groups) because the third disability group is established in the case of the least severe disorders and the least pronounced limitations of functioning. On the part of employers, hiring
Figure 4. Structure of employed persons aged 15 years and older with disabilities by age group, %
|
2020 |
7.0 8.5 8.7 11.3 15.1 21.8^^^н 20.9 ^^м |
||
|
2019 |
7.2 8.6 10.2 11.0 15.7 18.7^^н 21.5 |
||
|
2018 |
6.6 8.7 9.0 11.6 17.1 19.6^^н 20.8 |
||
|
2017 |
6.3 8.2 9.8 11.2 18.4 19.5^^н 19.0 |
||
|
2016 |
5.8 8.6 9.5 11.0 18.5 20.6 ^^н 18.3 |
||
|
2015 |
6.5 7.4 8.5 12.3 20.2 20.0 ^^н 17.2 |
||
|
2014 |
6.4 7.8 9.7 12.7 21.6 19.3 13.4 |
||
|
0 |
10 20 30 40 50 60 70 80 90 |
100 |
|
|
% |
|||
|
■ 15-19 ■ 20-24 ■ 25-29 ■ 30-34 ■ 35-39 ■ 40-44 ■ 45-49 ■ 50-54 ■ 55-59 ■ 60-72 |
|||
Note: until 2016 (inclusive), persons with disabilities aged 15 to 72 years were taken into account, since 2017 – at the age of 15 years and older.
Source: Structure of persons with disabilities by the participation status in the workforce and age groups. Federal State Statistics Service. Available at: (accessed: April 22, 2022).
persons with the third disability group is the least burdensome, since it is usually not required to create specially equipped workplaces for them. Also, persons with the third disability group have a greater economic interest in having a labor source of income, since the average size of disability pensions for them is lower than for persons with the first and second disability groups.
Employment is also influenced by the leading disability type. According to Rosstat sample observation, in 2021, among persons with disabilities aged 18 to 52 (57)11, a relatively high employment rate was observed in persons of the second and third disability groups whose disability was associated with walking (46.4% — among persons with the third disability group, 12% – among persons with the second disability group)
or vision (44.4% – among persons with the third disability group, 15% – of the second group)12.
Employment barriers and employment features of persons with disabilities in Russia
Persons with the third disability group, which allows them to work, make up a significant share in the structure of the contingent of adults with disabilities. However, the involvement of persons with disabilities in work remains low. For example, the employment rate among persons with disabilities in 2014–2020 remained low (from 8 to 12.5% in different years of observation), while the unemployment rate was 1.5–2 times higher than
Figure 5. Rate of economic activity, employment and unemployment of persons with disabilities
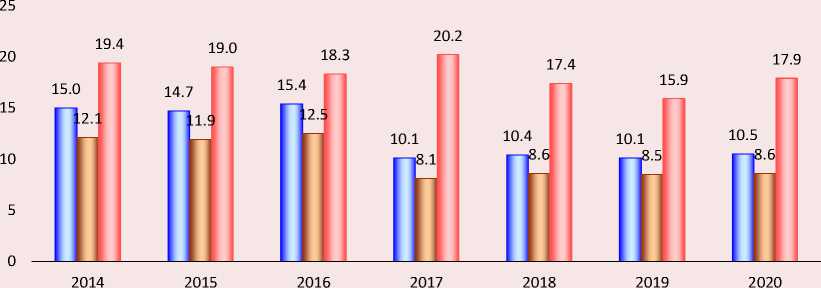
□ Level of economic activity □ Employment rate □ Unemployment rate
Note: until 2016, persons aged 15–72 years were taken into account, since 2017 – persons aged 15 years and older.
Source: Participation rate in the labor force, employment and unemployment rate of persons with disabilities. Federal State Statistics Service. Available at: (accessed: April 21, 2022).
the employment rate. In 2020, the employment rate was 8.6% (Fig. 5) . These circumstances indicate that persons with disabilities underutilize their own labor potential due to limiting circumstances. Identifying these obstacles and overcoming them is a necessary condition for achieving a higher income rate for persons with disabilities and solving the issue of social integration.
According to the Federal Register of Persons with Disabilities, regionally, the highest employment rates of people with disabilities of working age were registered in Saint Petersburg (35%), the Belgorod Oblast (34%), and the Kursk Oblast (33%). The lowest employment rate of persons with disabilities of working age was noted in the republics of Tyva, Khakassia, Buryatia, the Jewish Autonomous Oblast, Astrakhan and Ivanovo oblasts13.
Saint Petersburg’s leadership in addressing issues of promoting the employment of persons with disabilities is to a certain extent ensured by the implementation of original developments in this area including its own approach to the use of job quotas for persons with disabilities. Among the unique solutions are the legally established possibilities for employers to conclude agreements on the organization of workplaces for the employment of people with disabilities to quota jobs in another organization, on the referral of specialists with disabilities to temporary positions in other organizations, on the employment of specialists with disabilities by private agencies, on the creation of joint jobs with other employers based on the established quota14. In Saint Petersburg, employers are provided with subsidies to create jobs for persons with disabilities, the amounts of which are among the highest in the country15.
In general, quotas and the creation of special jobs remain key mechanisms to support employment among persons with disabilities. At the same time, in 2020, only 6.2% of persons with disabilities who found a job after applying to the employment service were employed thanks to the quota mechanism. At the same time, the employment rates of persons with disabilities through services have been declining for a long period – from 2008 to 202016. The number of employed decreased by 29%17 including for quota places for the same period – by 56%18. The share of persons with disabilities who have found a job from among those who applied to the employment service also decreased – by 4 percentage points by 2020 compared to 2008. These processes were observed against the background of a decrease in the number of persons with disabilities who applied for employment assistance to the employment service by 37% in 2008–2020. The reasons for the current trends may be a drop in the confidence of persons with disabilities in state employment promotion systems, a decrease in interest in employment, a reduction in the effectiveness of the work of the employment service bodies in terms of promoting the employment of persons with disabilities including for quota jobs.
An objective prerequisite for reducing these indicators could also be an increase in the number of persons with disabilities in need of special working conditions. However, in the period 2013– 2017, for which relevant data are available, the number of such persons with disabilities19 did not increase, but, on the contrary, decreased by 48%. The ratio of the number of persons with disabilities in need of special and ordinary working conditions has also changed insignificantly over the specified period: in 2013, 42% of the examined persons with disabilities needed special working conditions; in 2017 their share was 41% (Tab. 1).
According to the 2017 data, the majority of persons with the third disability group aged 18 years and older (99.7%) were recommended employment under normal conditions. Such a high level of the indicator remained throughout the entire period of 2013–2017. Among persons with disabilities of the same age of the first and second groups, on the contrary, during the entire observation period, the majority were those who were recommended employment in specially created conditions (see Tab. 1).
The fact that barriers continue operating in the Russian labor market in relation to people with disabilities is evidenced by the large average duration of the period of their job search in comparison with the general population. The average value in 2021 was 8 months, and among the general population – 6.3 months. The most common reason for the refusal of persons with disabilities from offered vacancies in 2020–2021 was low wages (30% of refusals). Applicants with disabilities were somewhat more likely, compared with the general population, to refuse the offered workplace due to working conditions (26 and 25%, respectively) and the remoteness of the workplace from home (25 and 24%, respectively). At the same time, persons with disabilities were less likely, relative to the general population, to refuse a vacant position if they were
Table 1. Number of persons with disabilities who are recommended employment in normal and special working conditions according to the survey results
Indicators 2013 2014 2015 2016 2017 Increase, 2017 to 2013, % All persons with disabilities who have passed the examination, people 1,342151 1,102388 835,947 730,049 712,518 -47 Among them, employment is recommended: In normal terms, people 775,093 629,562 587,144 431,757 418,699 -46.0 in % of the total number 57.8 57.1 70.2 59.1 58.8 - Among them are: Persons with the 1st disability group 51 43 55 68 91 78.4 Persons with the 2nd disability group 10,459 6,537 7,183 6,648 6,429 -38.5 Persons with the 3rd disability group 764,583 622,982 579,906 425,041 412,179 -46.1 In special terms, people 567,058 472,826 248,803 298,292 293,819 -48.2 in % of the total number 42.2 42.9 29.8 40.9 41.2 - Among them are: Persons with the 1st disability group 6,720 7,322 3,680 4,161 5,042 -25.0 Persons with the 2nd disability group 557,148 463,879 243,393 292,865 287,720 -48.4 Persons with the 3rd disability group 3,190 1,625 1,730 1,266 1,057 -66.9 Source: Number of persons with disabilities aged 18 years and older who need employment in specially created working conditions and at home, according to recommendations for the rehabilitation of citizens recognized as persons with disabilities except victims of industrial accidents and occupational diseases. Federal State Statistics Service. Available at: (accessed: April 21, 2022); Number of persons with disabilities aged 18 years and older who need employment in normal production conditions with the provision of appropriate working conditions, according to recommendations for the rehabilitation of citizens recognized as persons with disabilities except victims of industrial accidents and occupational diseases. Federal State Statistics Service. Available at: (accessed: April 21, 2022). not satisfied with the nature of the work (22 and 31%, respectively) or it did not correspond to their specialty (12 and 17%, respectively).
The availability of higher professional education increases the chances of persons with disabilities to find a suitable job. As of 2020, the proportion of those with higher education was noticeably higher among the employed persons with disabilities (22%) than among jobless (16%) and unemployed (12%)20. At the same time, employment of persons with disabilities outside of their specialty remains a common problem; 46% of people with disabilities who have a specialty confirmed by a diploma of education in 2020 did not work in their specialty, and in rural areas the proportion is even higher – 47%. For comparison: among the working population with vocational training, 33% did not work in their specialty21.
It is necessary to focus separately on how the employment relationship between the employer and employees with disabilities is formed. Throughout the entire period for which statistics are available, the predominant type of registration of labor relations was an indefinite employment contract (84% in 2020). However, the share of those who did not enter into any formal agreements with the employer, limited only to an oral agreement, remained stable (9% in 2020; Tab. 2 ). This practice
Table 2. Structure of employed persons with disabilities aged 15 years and older, employed, by type of employment contract, % of the number of the employed
Contract type 2014 2015 2016 2017 2018 2019 2020 Based on permanent employment contract 83.6 84.6 84.6 85.6 85.4 84.4 84.1 Based on fixed-term employment contract 4.1 4.5 5.4 2.7 3.6 4.2 4.4 Based on employment contact for work at home (home-based worker) 0.1 0.2 0.1 0.0 0.2 0.2 0.2 Based on civil law contact 1.3 1.3 1.3 1.1 1.2 1.9 2.3 Based on oral agreement with no paperwork 10.7 9.2 8.6 10.5 9.6 9.3 9.0 Note: until 2016 (inclusive), disabled people aged 15 to 72 years were taken into account, since 2017 – at the age of 15 years and older. Source: Structure of employed persons aged 15 years and older, employed and with disabilities, by type of employment contract. Available at: (accessed: April 22, 2022). creates risks primarily for employees, since in the absence of official registration of labor relations; they lose part of the privileges in terms of the regime and labor intensity. The same applies to the creation of comfortable jobs.
On the one hand, the informal employment of persons with disabilities is a response to the need for employers to comply with strict rules when hiring persons with disabilities, and on the other hand, allows them to act more flexibly responding to the current economic situation and changes in their own financial situation. At the same time, various employment forms can also perform such a positive function, providing for greater flexibility regarding the terms of labor relations and choosing the localization of the workplace: home work, remote work, work under civil law contracts and fixed-term employment contracts. However, these methods of registration of labor relations are weaker than an oral agreement (see Tab. 2).
Employment contribution to improving the material well-being of persons with disabilities
In general, for the absolute majority of persons with disabilities (10.31 million people or 87% of the total number) in 2020, material well-being was mainly determined by the amount of state disability pensions, which grew in the period 2014–2022. However, the ratio of the disability pension and the pensioner’s minimum wage was low, which indicates that persons with disabilities in Russia are guaranteed only a minimum standard of consumption that can provide only survival conditions, but is not a tool for the development and realization of human potential (Fig. 6).
It is worth noting that the amount of pension payments is tied to the disability group, for persons with the third disability group, it is the lowest. When comparing the size of disability pensions with the minimum wage level of pensioners, it becomes obvious that it is for persons with the third disability group (especially for the persons with disabilities since childhood) that the issues of increasing the income rate are most relevant (Tab. 3) .
According to the sociological survey conducted in 2018 among persons with disabilities living in the Vologda Oblast22, the contribution of wages of working persons with disabilities to the total household income ranged from 9 to 67%. Moreover, the average wage of working persons with disabilities was 10,875 rubles, and its contribution to household income was 24%. In general, wages made a significant contribution to the incomes of households of persons with disabilities when their value exceeded 20,000 rubles. However, this or a higher wage level was observed only in 10% of working persons with disabilities (Tab. 4) .
Figure 6. Ratio of the average size of disability pensions to minimum wage
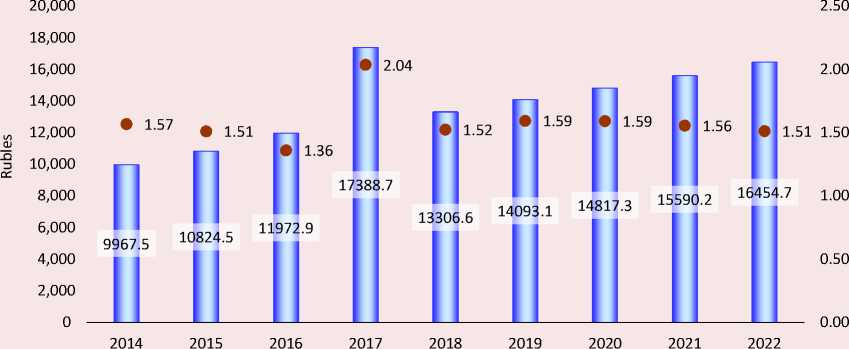
Source: Average size of the assigned pensions of persons with disabilities registered in the Pension Fund of the Russian Federation. Available at: (accessed: April 26, 2022); Amount of the minimum wage for the purpose of establishing social supplement to pension in the Russian Federation. Available at: (accessed: April 26, 2022).
Table 3. Ratio of disability pensions and minimum wage
Indicator 2014 2015 2016 2017 2018 2019 2020 2021 2022 Amount of minimum wage in order to establish a social supplement to a pension in the Russian Federation, rubles 6,354 7,161 8,803 8,540 8,726 8,846 9,311 10,022 10,882 Amount of pension payments, rubles: Persons with the 1st disability group 12787.4 13907.4 15315.4 20893.8 17310.6 17977.5 18909 19940.3 21054 Relation to minimum wage value 2.01 1.94 1.74 2.45 1.98 2.03 2.03 1.99 1.93 Persons with the 2nd disability group 10379.4 11266.6 12479.3 17861.6 13717 14619.5 15411.3 16223.5 17132.4 Relation to minimum wage value 1.63 1.57 1.42 2.09 1.57 1.65 1.66 1.62 1.57 Persons with the 3rd disability group 8447.3 9203.3 10308.1 15643.3 11519.7 12336.2 13056.1 13801.5 14722.6 Relation to minimum wage value 1.33 1.29 1.17 1.83 1.32 1.39 1.40 1.38 1.35 Children with disabilities 9579.3 11205.8 12339 17837.4 13030.8 13402.1 13675.9 14500.3 14998.4 Relation to minimum wage value 1.51 1.56 1.40 2.09 1.49 1.52 1.47 1.45 1.38 Persons with disabilities since childhood: 1st group 9776.4 11405.7 12546.6 18107.3 13341.3 13739.3 14079.8 14953.1 15505.1 Relation to minimum wage value 1.54 1.59 1.43 2.12 1.53 1.55 1.51 1.49 1.42 2nd group 8145.8 9542.6 10479.3 15853.7 11028 11356.6 11618.7 12334.6 12787.2 Relation to minimum wage value 1.28 1.33 1.19 1.86 1.26 1.28 1.25 1.23 1.18 3rd group 4505.4 5089.6 5871.8 11126.4 6423.7 6618.4 6860.3 7203.7 7458 Relation to minimum wage value 0.71 0.71 0.67 1.30 0.74 0.75 0.74 0.72 0.69 Source: Average amount of pensions granted to persons with disabilities registered with the Pension Fund of the Russian Federation. Available at: (accessed: April 26, 2022); Amount of minimum wage for the purpose of establishing social supplement to pensions in the Russian Federation. Available at: (accessed: April 26, 2022).
Table 4. Contribution of wages of working persons with disabilities to their total household incomes
|
Contribution of wages of persons with disabilities to the total household income |
Statistics |
Total household income, rules |
Share of labor income of a person with disabilities in the total household income, % |
Average monthly wage, rubles |
|
From 0 to 10% (5% of the number of households) |
Average value |
48,300 |
8.8 |
4,250 |
|
Median |
48,300 |
8.8 |
4,250 |
|
|
Minimum |
39,000 |
8.7 |
3,500 |
|
|
Maximum |
57,600 |
8.9 |
5,000 |
|
|
From 10 to 20% (44% of the number of households) |
Average value |
60,900 |
15.7 |
9461.11 |
|
Median |
62,000 |
15.5 |
10,000 |
|
|
Minimum |
30,000 |
12.9 |
5,000 |
|
|
Maximum |
88,000 |
18.8 |
15,000 |
|
|
From 20 to 30% (24% of the number of households) |
Average value |
38,400 |
24.3 |
9,370 |
|
Median |
34,000 |
24.9 |
8,100 |
|
|
Minimum |
18,000 |
20.8 |
4,500 |
|
|
Maximum |
75,000 |
26.8 |
17,000 |
|
|
From 30 to 40% (12% of the number of households) |
Average value |
28,880 |
32.4 |
9,300 |
|
Median |
30,000 |
31.3 |
10,000 |
|
|
Minimum |
23,000 |
30.3 |
8,000 |
|
|
Maximum |
33,000 |
36.9 |
10,000 |
|
|
From 40 to 50% (7% of the number of households) |
Average value |
46,400 |
43.7 |
20,000 |
|
Median |
45,000 |
44.4 |
20,000 |
|
|
Minimum |
22,200 |
41.7 |
10,000 |
|
|
Maximum |
72,000 |
45.1 |
30,000 |
|
|
From 60 to 70% (5% of the number of households) |
Average value |
42,000 |
66.6 |
28,000 |
|
Median |
42,000 |
66.6 |
28,000 |
|
|
Minimum |
38,000 |
65.8 |
25,000 |
|
|
Maximum |
46,000 |
67.4 |
31,000 |
|
|
All respondents |
Average value |
48,610 |
24.3 |
10,875 |
|
Median |
47,000 |
19.8 |
10,000 |
|
|
Minimum |
18,000 |
8.7 |
3,500 |
|
|
Maximum |
88,000 |
67.4 |
31,000 |
Source: Sociological survey of persons with disabilities aged 18 and older living in the Vologda Oblast (2018). Number of working respondents – 41 people, 40 people responded to questions about income.
These data indicate that the contribution of the monetary income of persons with disabilities from work to the total income is usually small. At the same time, for some persons with disabilities, even a small additional income may be of interest if their household’s disposable income is generally low.
Thus, the performed analysis allows making a number of generalizations. The first thing is that unrealized labor potential has been accumulated among persons with the third disability group against the background of their unfavorable financial situation compared to persons with the first and second disability groups. Second, the employment barriers in the labor market are mainly overcome by those applicants with disabilities who have a low level of claims regarding the amount of wages and agree to work outside their specialty, and sometimes without formalizing labor relations. Third, combination of these factors leads to the fact that the labor potential of persons with disabilities is realized, but does not provide a significant increase in material well-being.
Discussion
Persons with the third disability group have the greatest potential for involvement in labor activity. At the same time, it is among them that the maximum unemployment rate is recorded, which indicates that there are problems with finding a suitable job. Considering that labor activity on average makes an insignificant contribution to the total disposable income of households of persons with disabilities, the question arises as to how much such employment is “forced”, that is, due to the unsatisfactory standard of living of persons with disabilities.
In Russia, there is a significant regional differentiation in the employment rate of persons with disabilities. Moreover, the employment of persons with disabilities is related to the amount of disability pension, social protection rate and labor market situation. For example, O.V. Kuchmaeva points out: first, “an insignificant amount of disability pension stimulates the employment of people with disabilities”, and second, “in regions where the poverty level is lower, even with a high wage level, employment of persons with disabilities is minimal, which is due to both a higher level of social guarantees and competition between people with and without disabilities for jobs places” (Kuchmaeva, 2020). The researcher also proves that, potentially, with the creation of favorable conditions for the employment of people with disabilities, labor market could receive an additional 165.8 thousand people as labor resources, and if the employment rate of people with disabilities in all regions of the country reaches 20%, the number of additional employees involved would amount to 611.5 thousand people (Kuchmaeva, 2020).
The researchers note that persons with disabilities are characterized by a concentration of employment in low-skilled professions (Demianova, 2018). According to observations conducted by specialists of the Resource Training and Methodological Center in the Northwestern Federal District, graduates with disabilities report a lack of professional qualifications as an obstacle to employment (Denisova et al., 2018).
The data indicate that an important incentive to find work among persons of the third disability group in conditions of a low level of pension provision can really be the desire to increase the disposable income rate. However, in the conditions of the Russian labor market, people with disabilities are at a disadvantage. At the stage of finding a suitable job, they face a number of problems, including those caused by the existence of negative stereotypes about hiring workers with disabilities (Shkurko, Kozyakov, 2018), insufficient information, lack of suitable vacancies and individual support during employment (Starobina et al., 2015). Quota places also do not solve pressing problems, providing only a small contribution to the promotion of employment of people with disabilities. As a result, a contingent of working people with disabilities is formed, the most typical representatives of which are older people, men, people of the third disability group, and persons with higher or secondary vocational education.
The specific employment structure of people with disabilities is also reflected in the general level of their satisfaction with their work and its various aspects. Among workers with disabilities, the proportion of those who are unsatisfied with the amount of wages (12%), the reliability of work (5%) and the duties performed (4%) is higher, in contrast to the general population (the corresponding values were 9, 3 and 2%). Slightly higher, in comparison with the general population, is the proportion of people with disabilities who do not experience professional (8 and 5%) and moral satisfaction (6 and 3%, respectively) from their work23. At the same time, satisfaction with various characteristics of the workplace is a significant criterion for the quality of a person’s working life (Belekhova, 2019).
Its low rates among persons with disabilities indicate that the jobs in which they are employed do not fully contribute to the disclosure and realization of their labor potential and to improving the quality of life in general.
The prospects for changing the current situation in terms of increasing the possibilities of realizing the labor potential of people with disabilities are associated with the development of information resources, on the one hand, expanding the ideas of people with disabilities about vocational education opportunities, employment options in the specialty in their native region, and on the other hand, aimed at increasing employers’ awareness of the benefits of hiring people with disabilities, overcoming negative stereotypes, about people with disabilities in society. Russian researchers have already made specific proposals on the architecture and substantive content of such information systems (Denisova et al., 2018).
Positive changes in the sphere of work of state employment promotion centers are associated with the expansion of the use of individualized algorithms for working with applicants with disabilities. For instance, in the Vologda Oblast, the employment services are implementing targeted technology to provide people with disabilities with services to assist in finding a suitable job. Information about each person with disabilities in need of such services comes from the institution of medical and social expertise. Then this information is used to establish the professional preferences of people with disabilities and create an individual electronic “employment passport” and “individual employment plan”24. To accompany a person with disabilities during the job search, they are provided with a personal employment manager25.
An individual approach to the provision of employment services is a common practice in developed countries. But it has some disadvantages. For instance, the authors of a systematic review of studies published in 2002–2008 on the effectiveness of measures to promote the employment of people with disabilities in the UK noted that the use of personal consultants and individual case management helped people with disabilities and long-term illnesses to return to work, however, time constraints and performance targets of employment consultants led to the fact that they initially, applicants who were more ready to work were selected for the programs, as well as difficulties with building trust on the part of customers, which is necessary for the effective management of individual cases (Clayton et al., 2011). Of course, when developing Russian regional programs, it is necessary to take into account the existing world experience in promoting the employment of people with disabilities in order to avoid the most obvious mistakes and use the most effective practices.
One of the examples of successful practice in overcoming barriers to employment of people with disabilities is the annual All-Russian competitions of professional skills among people with disabilities since 2015. The Abilympics movement currently covers all regions, volunteers, instructors and experts are involved in it. The Abilympics national championships are held within the framework of the national project “Education”. The participants and winners of the competition in their nomination have opportunities to find a job in the specialty in a friendly environment of the leading enterprises of the industry26.
Promotion of employment is only one of the areas of support that people with disabilities need when realizing the right to work. Finding a suitable vacancy and getting a job become the first step in professional activity. Directly at the workplace, people with disabilities can also encounter various difficulties related both to the nature of the work performed, and to the features of corporate culture, relationships in the team, the quality and completeness of employers’ compliance with labor legislation. The foreign study, devoted to the comparative assessment of the quality of jobs and satisfaction with them, shows that the proportion of those who have a high quality of work (an integral value calculated based on an assessment of four variables: professional position, hourly wage, employment stability, training received and subjective job satisfaction) is noticeably higher among workers without disability than among people with disabilities (Agovino, Parodi, 2014). These facts actualize studies aimed at assessing the quality of working life of persons with disabilities including in relation to the problems of precarious employment and social inequality.
Conclusion
People with disabilities are poorly included in the workforce. In their contingent, there is a growing proportion of people with the third disability group with the highest economic activity. At the same time the indicators of their employment rate are decreasing, the unemployment rate remains high, as well as the employment practice without a formal contract with the employer. Taken together, these phenomena lead to the accumulation of unrealized labor potential among persons with the third disability group, against the background of their unfavorable financial situation as compared to persons with the first and second disability groups. The barriers to employment in the labor market are mostly overcome by applicants with disabilities, who agree to work for low wages, often not in their specialty and without formal employment relations. The combination of these factors leads to the fact that employment does not provide people with disabilities with a significant increase in their material well-being.
The key areas of measures to promote the realization of the labor potential of persons with disabilities are the development of remote employment practices for low-mobile categories of persons with disabilities, the replication of successful practices and projects of supported employment of persons with disabilities, the improvement of support for job seekers with disabilities at all stages of the service to find a suitable job and employment. It is also necessary to take an individual approach to addressing the employment of persons with disabilities. Regional integrated information systems containing information about vacancies available to job seekers with disabilities, as well as about the job seekers themselves, can serve as a tool for improving public services in this area. Further support of existing and development of new projects aimed at increasing the competitiveness of people with disabilities in the labor market and overcoming negative stereotypes of employers about their hiring is necessary.
The scientific novelty of the conducted research consists in substantiating the thesis that in the current conditions the employment of persons with disabilities does not contribute to a significant improvement of their financial situation, since its characteristics are formed under the influence of barriers to the realization of the labor potential of persons with disabilities, in conditions of their low disposable income level. The need for an individualized approach in providing employment assistance services to persons with disabilities is substantiated. The research results may be of interest to specialists engaged in the study of the quality of life of persons with disabilities.
References The impact of employment barriers on the employment characteristics of persons with disabilities
- Agovino M., Parodi, G. (2014). Identifying the quality of work by fuzzy sets theory: A comparison between disabled and non-disabled workers. Social Indicators Research, 119, 1627–1648. DOI: 10.1007/s11205-013-0568-4
- Agovino M., Rapposelli A. (2016a). Disability and work: A two-stage empirical analysis of Italian evidence at provincial level in providing employment for disabled workers. Social Indicators Research: An International and Interdisciplinary Journal for Quality-of-Life Measurement, 125(2), 635–648. DOI: 10.1007/s11205-014-0851-z
- Agovino M., Rapposelli A. (2016b). Does flexicurity promote the employment of disabled people? A panel analysis for Italian regional data. Quality & Quantity, 50, 2085–2105. DOI: 10.1007/s11135-015-0252-7
- Belekhova G.V. (2019). Quality of work life: Public opinion (case study of the Vologda Oblast). Diskurs=Discourse, 10(36), 29–44 (in Russian).
- Clayton S., Bambra C., Gosling R. et al. (2011). Assembling the evidence jigsaw: Insights from a systematic review of UK studies of individual-focused return to work initiatives for disabled and long-term ill people. BMC Public Health, 11, 170. DOI: 10.1186/1471-2458-11-170
- Dem’yanova A.V. (2015). Sotsial’naya politika v sfere zashchity prav invalidov v Rossii: preprint WP3/2015/09 [Social Policy in the Field of Protection of the Rights of Disabled People in Russia: Preprint WP3/2015/09]. Moscow: Izd. dom Vysshei shkoly ekonomiki.
- Demianova A. (2018). Employment of disabled people in Russia in the context of the digital economy. In: Basic Research Program Working Papers. Series: Science, Technology and Innovation WP BRP 91/STI/2018. Moscow: HSE ISSEK. Available at: https://wp.hse.ru/data/2018/11/28/1141498514/91STI2018.pdf
- Denisova O.A., Lekhanova O.L., Samofal R.A. et al. (2018). On the problem of employment of young disabled people in the Vologda Oblast. Vestnik Leningradskogo gosudarstvennogo universiteta im. A.S. Pushkina, 2, 208–216 (in Russian).
- Fylkesnes K., Førde O.H. (1992). Determinants and dimensions involved in self-evaluation of health. Social Science & Medicine, 35(3), 271–279. DOI: 10.1016/0277-9536(92)90023-J
- Idler E.L. (1993). Age differences in self-assessments of health: Age changes, cohort differences, or survivorship? Journal of Gerontology, 48(6), 289–300. DOI: 10.1093/geronj/48.6.S289
- Kaneva M.A. (2016). Socio-economic, behavioral and psychological determinants of the Russian population’s self-reported health assessment. Natsional’nye interesy: prioritety i bezopasnost’=National Interests: Priorities and Security, 6, 158–171 (in Russian).
- Kuchmaeva O.V. (2020). Employment of disable people in Russian regions: Status, differentiation, factors. Statistika i ekonomika=Statistics and Economics, 17(5), 27–37. DOI: 10.21686/2500-3925-2020-5-27-37 (in Russian).
- Kulagina E.V. (2016). Profile of disability: Demographic and regional aspects. Regional’naya ekonomika: teoriya i praktika=Regional Economics: Theory and Practice, 11(434), 103–119 (in Russian).
- Maksimova T.M., Lushkina N.P. (2014). Patterns of formation of self-assessments of health in various population groups. Byulleten’ Natsional’nogo nauchno-issledovatel’skogo instituta obshchestvennogo zdorov’ya imeni N.A. Semashko=Bulletin of Semashko National Research Institute of Public Health, 1, 172–178 (in Russian).
- Natsun L.N. (2017). Supported employment for people with disabilities: A review of international experience. Vestnik UrFU. Seriya: Ekonomika i upravlenie, 16(4), 663–680. DOI: 10.15826/vestnik.2017.16.4.032 (in Russian).
- Natsun L.N. (2021). Restricted activity and negative self-assessment of health as risk indicators for latent disability analysis performed on population groups different as per sex and age. Analiz riska zdorov’yu=Health Risk Analysis, 2, 145–155. DOI: 10.21668/health.risk/2021.2.14 (in Russian).
- Olkhina E.A., Medvedeva E.Yu., Dmitrieva E.E. et al. (2019). Employers on employment of persons with health impact assessment and disabilities: Opinions and facts. Perspektivy nauki i obrazovaniya=Perspectives of Science and Education, 4(40), 377–392. DOI: 10.32744/pse.2019.4.29 (in Russian).
- Pautova N.I., Pautov I.S. (2015). Gender characteristics of health self-assessment and perception as a socio-cultural value (based on the data of the 21st round of RLMS-HSE). Zhenshchina v rossiiskom obshchestve=Women in Russian Society, 2(75), 60–75 (in Russian).
- Shkurko N.M., Koz’yakov R.V. (2018). Ideas of L.S. Vygotskiy and psychological problems of employment for disable people. TsITISE=CITISE, 4(17), 17 (in Russian).
- Smoleva E.O. (2018). Barriers to labor market inclusion viewed by socially vulnerable populations (evidence from Northwestern Federal District). Monitoring obshchestvennogo mneniya: Ekonomicheskie i sotsial’nye peremeny=Monitoring of Public Opinion: Economic and Social Changes Journal, 4, 351–368. DOI: 10.14515/monitoring.2018.4.18 (in Russian).
- Starobina E.M., Kuz’mina I.E., Gordievskaya E.O., Klimon N.L. (2015). The reasons for the low employment of disabled people in the labor market in the assessments of disabled people and specialists. Vestnik Vserossiiskogo obshchestva spetsialistov po mediko-sotsial’noi ekspertize, reabilitatsii i reabilitatsionnoi industrii, 2, 40–47 (in Russian).
- Tarasenko E.A. (2004). Disability policy: Cross-cultural analysis and optimal conception search for Russia. Zhurnal issledovanii sotsial’noi politiki=The Journal of Social Studies, 2(1), 7–28 (in Russian).
- Vasin S.A. (2017). Prospects of changes in the total size and age composition of adults with disability in Russia. Problemy prognozirovaniya=Studies on Russian Economic Development, 5(164), 129–139 (in Russian).
