The Impact of Feature Selection on Meta-Heuristic Algorithms to Data Mining Methods

Author: Maysam Toghraee, Hamid Parvin, Farhad Rad
Journal: International Journal of Modern Education and Computer Science (IJMECS) @ijmecs
Article in issue: 10 vol.8, 2016.
Free access
Feature selection is one of the issues that have been raised in the discussion of machine learning and statistical identification model. We have provided definitions for feature selection and definitions needed to understand this issue, we check. Then, different methods for this problem were based on the type of product, as well as how to evaluate candidate subsets of features, we classify the following categories. As in previous studies may not have understood that different methods of assessment data into consideration, We propose a new approach for assessing similarity of data to understand the relationship between diversity and stability of the data is selected. After review and meta-heuristic algorithms to implement the algorithm found that the cluster has better performance compared with other algorithms for feature selection sustained.
Feature selection, data mining, algorithm cluster, heuristic methods, meta-heuristic
Short address: https://sciup.org/15014910
IDR: 15014910
Text of the scientific article The Impact of Feature Selection on Meta-Heuristic Algorithms to Data Mining Methods
Published Online October 2016 in MECS DOI: 10.5815/ijmecs.2016.10.05
-
I. I ntrouduction
Manual processing of data is impracticable because of Fast growing technologies. Even worse, machine learning techniques and knowledge extraction seem to be unable against this big data base. Vast dimensions management is one of the common challenges for extracting knowledge and machine learning. Feature selection methods is one of the most challenging and the most important activities in developing machine learning and patterns recognition. Feature selection is one of the issues which has been discussed in machine learning and also pattern statistical recognition. This issue is important in many usages (e.g. classification), since there are a lot of features in these usages. Many of them are useless or are not informative. Eliminating these features does not change the informative content but it Effects on calculating feature of the mentioned usage Also it helps to save much useless information with useful data. Not elimination of the waste features makes some dimensional problems. Dimensional problem says that when the dimensions increase, it is possible that the 2 data (or sample)get far from each other. It means that the higher the dimensions(features), probably the most distance between them randomly.
As the result, those samples are affected by the dimension and the distance between those samples are estimated much more. It makes the distance between both samples less representing the real distances. So, the quality of classifying or clustering are unpleasantly unreal and drop. It can be stated in another way. It can be said that some clusters or branches in feature’s atmosphere are more coherent with some special features; Three general ways have been submit to overcome the above dimension problem: (a)using subspaces determined for clusters or branches by user, (b) using feature selection methods or decreasing dimensions like analyzing main factors and finally (c) using subspace clustering or subspace classifying methods. We discuss about the feature selection methods (b) in this report. A lot of solutions and algorithm have been represented for feature selection issue. A lot of solutions and algorithms have been represented for feature selection issue, some of which are 30 or 40 years old. The problem about algorithms when represented was their calculating feature. However, fast computers and big saving sources have made this problem unimportant, beside, big data sets for new issues has made it important to find a fast algorithm for this issue. Feature selection has 2 types :
-
a) supervised feature: Labels are used during feature selection algorithm(Zhao &Liu 2007).
-
b) unsupervised feature :Labels are not used during feature selection algorithm(G.D 2008).
Research domain is just limited to the supervised feature selection while labels are used during feature selection algorithm. Purpose of feature selection is decreasing the dimensions of a set to a smaller subset as the best subset of features; A target function is used as being better factor which can be different targets according to the primary hypothesis. This being better can be measured, for example accuracy in classifying. We are seeking for the below targets using local searching methods and imitating the nature searching algorithm; a) discuss about the feature selection efficiency methods.
-
b) explain the assessing algorithm of this research c) looking for tests and results from these methods using real data sets.
-
II. E fficiency F unction M ethods
Different types of efficiency function for various subsets includes (1) wrapper methods, (2) embedded methods, (3) filter methods
Wrapper methods: To asses each of the candidate feature subsets, a classifying model is done on those features(instruct and produce). We consider the accuracy of the trained classifier on a distinct experimental set as the efficiency amount of that candidate subset. It is clear that however these methods are suitable for efficiency, they are slow and are complicated in calculation. Since these methods teach a classifying model for each assessment of efficiency function, these methods are appropriate for the environments with subset generator similar to the optimization algorithm of nature imitation. Utilized methods of classified model during learning the educational data set, feature selection is done implicitly. An example of this kind of feature selection methods is decision tree classifying model. As these methods are explicitly part of feature selection methods, we do not use these methods .
Filter methods, Set of different subsets of features are placed according to a factor. Then we can choose their best. The problem is that these methods try to find the best subset of features out of candidate subset 2 . Producing all of them is hard and inapplicable but since calculating the efficiency function in these methods is mostly fast(the accuracy of classified model is not on selected features), they are appropriate for environments with subset generators similar to optimization algorithms of nature imitation.
A. Efficiency function
To calculate the efficiency function, we should first calculate the relationship of each feature with other features and label.
After calculation of each feature with other features and label, selecting features is done regarding to relationship amount of each feature with other features and labels. To do this, methods depended on evolutional algorithms have been represented for selecting subsets of features, in this chapter we discuss about the efficiency function of this algorithms. We are seeking for 2 targets in feature selecting . First, an evolutional algorithm is looking for subset of features which has the most relationship with label and second the selecting features have the least relationship with other selecting features. Both are demonstrated in evolutional algorithms of efficiency function explicitly .
Now, we use the following relation which shows the variation of selecting features and label similarity of selecting features to calculate the efficiency of this chromosome .
/^ch = ∑ lesser(maxk=l(|cor(Xi,Xк)| i=l
× and(chi,ch к )) , th2)×α + greater(|cor(Xi, T)|, th!) (1)
Where f is the amount of features and α is the big positive number, th1 and th2 are two thresholds which should be adjusted by the user, ch j shows Ith of chromosome , | | shows the absolute value, cor(X j ,X k ) shows the relationship of I th and k th features , and (ch j ,ch k ) show the logical operator (output is 1 when both inputs are 1,otherwise function output is 0) , (a,b) is greater than1 if a≥b ,otherwise function output is 0 and function(a,b) is less than 1, if a≤b . otherwise function output is 0 .
-
III. E valuation A lgorithms
-
A. Genetics Algorithm
The main idea of evolutional algorithms were presented in 1960 by Ritchenberg. Genetic algorithms are derived from this type of algorithm. In fact the computer search methods based on optimization algorithms based on the genetic structure of chromosome's by john Holland(1970) was introduced at the university of Michigan(A.mehdi;1386). The most extensive definitions of genetic algorithm are from Goldberg's book: "Genetic algorithms is machine learning model, its behavior is an example of the evolutionary processes in nature". Genetic algorithm is one the strongest methods derived from the nature which seeks for the problem randomly. This search is seeking for creating better answers in each generation compared to the answers of previous generations which represents one of the best forms of number optimization on the issues of science and engineering (masoudian & et al;2007). We explain the genetics algorithm steps of the set’s features. This subset of main features is known based on (C . Meyers &et al; 1996): First we answer the question by defining a chromosome structure(coding). Introducing the fitness function, we explain the quality of the given answers in each chromosome numerically. Then we generate some chromosomes randomly(or semi-random. And the chromosomes are known as the initial population. We have some answers for the problem in this step which have lower quality. The quality of each chromosome of the population is specified according to fitness function we specified. Now we select two chromosomes for reproduction using an appropriate method (A method in which the probability of chromosome selection with better fitness amount is more than a chromosome with less fitness amount). Then using these two chromosome, we create a new chromosome(mating). We change some genes of some chromosomes having a specified probability. Selecting,
recombination and mutation steps make a new population of chromosomes(new generation). If the chromosomes tend to the demanded answer ,reproduction process stops. Otherwise creating a generation out of the previous generation continues until we reach to a desired answer or ending the algorithm, condition .
-
B. Particles swarm optimization algorithm
In 1995, Kennedy and Eberhart offered particle swarm optimization algorithm for the first time as a non-deterministic search methods for functional optimization (Kenndy &et al,1995). This algorithm has got inspired from the collective movement of the birds that were seeking for food. A group of birds are looking for food in a space randomly. There is only one piece of food in the discussed space. None of the birds know the location of food. One of the best strategies can be following a bird who is closer to the food. This strategy is the basis of the algorithm ( M. carvalho& et al, 2006). Each solution, which is called a particle, is the same as a bird in the algorithm of a mass movement of birds. Each particle has a fitness value which is determined by a fitness function. Particle swarm works based on this principle. In each moment each particle sets its location according to the best location in which it has been located in the searching atmosphere and in the best location which is in its neighborhood. the time passing. X® determines the ith position of the particle in the tth time.
Also, each particle needs a speed for moving in the space. V® is the speed of ith particle in t th time. Adding speed to the position of each particle, a new position can be considered for the particle. The function of updating the position of particle is as below :
X(t+ 1) = X® + V(t+ ^wfrere X^~ u(Xmin,Xmax) (2)
The suitability of a particle in the search space is evaluated by the fitness function.
-
C. Colony Bees Artificial Algorithm
Ants algorithms based on intellectual foundation can be simply stated in one sentence: Ants select the best way between different ways of reaching food among the barriers in nature. The short way is always chosen. Ants secrete a substance called pheromone after finding food which is seen white after the rain. They find their way finding the pheromone way. Bees are in three groups in colony bees algorithm bees:
Worker bees, the audience and the pioneers(scout). A honey bee stays in dance region to make a decision for choosing a food source is called searching honey bee and and a honey bee, which is looking for the specified is called worker bee. A bee which searches randomly is called pioneer honey bee(scout). In the bees algorithm, worker bees are half of the population and the other half are searching bees. For every food source there is only one worker bees, in other words, the number of worker bees around the hive equals the number of food sources.
The worker bees who are tired of working in the food supply are leading wasps browser. The main steps of the algorithm is given below:
-
• Initialization
-
• Repeat
-
a) The location of worker bees in food supplies in memory
-
b) The location of searching bees in food sources in memory
-
c) Sending the pioneer wasps bees to search for new food sources.
-
• (Until the desired situation gets achieved).
A searching bee chooses the food source regarding the possibility related to that source, Pi , which is calculated by the following phrase:
n _ —^*^i—
1 m=ifitn
Where f iti is the fitness value of the solution i by worker bees. That is in proportion to the amount of nectar in food source in position i. SN is the number of food sources that equals the number of worker bees (EB) or searching bees (OB). In this method, the worker bees interchanges their information with the searching bees . In order to produce a selected food situation already, bee algorithm uses the above phrase :
V i,j - x i,j + 0 i,j (x i,j + x kj ) (4)
Where K E [S„] and j E [D] are selected randomly. Although K is determined randomly, but must be different from i. 0i ,;- is a random number between [-1,1].This variable controls generating the neighbor food source around the Xi,j and shows the comparing changes of the food source positions by the honey bee visually. More the difference between Xi,j and Xk,j decreases ,deviation from Xi,j situation decreases. If the parameters generated by these operations are more than their preset amounts, this parameter Parameters can be selected as an acceptable value( D.Karaboga;2007).
X - x Ln + rand[0,1] (XJmax - X^) (5)
After generating and fitting the new population new selection is done out of the new population. These are continued as long as the number of iterations of the algorithm ends.
-
D. Big Bang Algorithm
First algorithm was introduced by Eksin and Erol (I.Eksin&K.Erol,2006). This algorithm uses the phenomenon of the big bang and then the contraction of the universe in the center of gravity. This algorithm has higher speed of convergence compared to other algorithms. Particles are scattered in searching space randomly like other evolutional algorithms which is called big bang phase (c.v. camp,2007). each particle has
a position which determines what is the particle coordinates in the search space. Position of the particle changes by its movement in phase, all the particles accumulate around the center of gravity. This phase acts like a converging operator which is calculated through the following equation :
Y (kj)
У N ' у (k) _ j1 fj
X i yN 1
^)=1fj i — 1,2,3,4.....c (6)
Where X (K) , is the i' th particle of the center of gravity in kth repetition. X ( k,j is the Ith component of j'th particle produced in k’th repetition. f j is the target function for point j and N is the number of points or particles and C the number of controlling variables respectively, after determining the particles center of gravity, the new position of particles can be calculated using the following equation :
Y(k+l,j) Y(k) । ^y
X i — X i + (X imax
- X imin ) X a X Г X (^j")
r is the random number, Xlmax and Xlml ^ respectively are lower and upper constraints to limit in the above equation . cr1 is also a parameter for limiting the search space.
-
E. Hill climbing Algorithm
In Hill climbing algorithm, at first an answer to the question is generated randomly. Then in a loop until the stop condition is not established for the algorithms, a number of neighbors are generated for the current mode of production and the best one is chosen among them and replaces the current mode. ( of course, another definition for the hill climbing has been stated). In general, the optimality of the answer to the algorithm is local. To run Hill climbing algorithm we need two functions: performance function and neighbor function.
The performance function determines optimality of the answer. 8 minister of guards on board pairs queens returns. Neighbor function also produces current mode neighbors. In problem 8 queens are for generating neighbor modes, each of them are chosen and move once upward or downward . This means that in the worst mode of each case, there will be 16 neighboring modes that in each repetition of the loop as the best answer will be replaced neighbors. ends when there is not a better mode compared to the current mode.
-
F. Clustering algorithm
A general trend for clustering process includes the following steps:
-
1. Displaying the patterns that usually involves selecting or extracting the feature.
-
2. Defining an assessment criteria of the similarity according to the data domain.
-
3. Clustering or Grouping process.
-
4. Summarization of data if needed.
-
5. Validation of system.
Displaying the patterns refers to the number of classes, available samples and the number, type and scale of features in a clustering algorithm. Some of these data are not controlled by the user. Selecting feature, Identifying process of a subset is one of the most effective features for using in clustering and feature extracting is, the process of changing some available features and generating new features.
Both of these techniques are used in order to achieve a suitable set of features and enhancing the performance of clustering. Adjacent of samples usually is measured by a function of distance between the pair of input patterns. Various criterion are used to measure distances in various fields. A simple measuring criteria such as Euclidean distance is usually used to represent the dissimilarity between the two models. Identifying conceptual similarities between the patterns , evaluation criteria could no longer be used. Grouping step has various methods. The results of the clustering can be in from of hard segmentation ( dividing data within separate groups) or phase segmentation (each sample is located in various groups with different membership grades). Hierarchical clustering algorithm represent nested chains of different divisions on the basis of dividing and combining clusters by similarity function. Non-hierarchical clustering algorithm gives a division of the samples. There are other techniques, such as possibility clustering and graph theory clustering. Summarization of is usually referred to as per-pattern model. For example, the center of gravity for each cluster could be a brief description of the sample within that cluster.
-
IV. E valuation M ethods
In this section, the results of applying the proposed method on different data sets and used parameters has been reported. In this section, analysis and interpretation of the results and efficiency of the proposed algorithm also briefly discussed. In this research validation includes experimental validation. In experimental validation, the efficiency of proposed algorithm is discussed in comparison with other algorithm in several real data sets. UCI standard data sets are the used datasets(it is on the machine learning website) is that almost all the result of recent studies in the field of data mining in the world are reported using this data set. These actual data are often standard. Experimental results of the proposed method and other methods with the world's valid criterion such as error size the feature set size and chosen will be reported.
Table1. Datasets used in the first experiment in this thesis. Starred dataset"*" are real data sets
|
Dataset Name |
# of data items |
# of featur es |
# of classe s |
Data distribution per clusters |
|
Breast Cancer * |
404 |
9 |
2 |
444-239 |
|
Bupa* |
345 |
6 |
2 |
145-200 |
|
Glass* |
214 |
9 |
6 |
70-76-17-13-9-29 |
|
Galaxy* |
323 |
4 |
7 |
51-28-46-38-80-45-35 |
|
SAHeart * |
462 |
9 |
2 |
160-302 |
|
Ionosphe re* |
351 |
34 |
2 |
126-225 |
|
Iris* |
150 |
4 |
3 |
50-50-50 |
|
Wine* |
178 |
13 |
3 |
59-71-48 |
|
Yeast* |
1484 |
8 |
10 |
463-5-35-44-51-163-244-429-20-30 |
It should be mentioned that all results represented in this thesis are achieved, because the test results are so strong and extendable, with an average of 10 separate performance. In the first experiments have been performance on several real data sets. The actual data sets have been derived from machine learning website (Newman,1998). These data sets is presented in the table above. until the test results be at the maximum amount of strength and be extendable. Test results of the standard features of these data sets have been reported. in other words, each of the properties of this dataset with zero mean and variance one, N(0,1) are standard. Thresholds t ℎ j_ and t ℎ2 changing from 0,1 to 0,9 and training set size from 10 percent to 90 percent, different levels of accuracy are achieved. Notice that each performance is done10 times repeatedly. In all cases the maximum population size should be adjusted on 50 and the maximum generation size on 50 .
V. R esults from A lgorithms
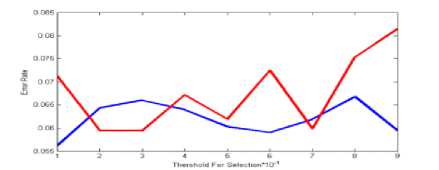
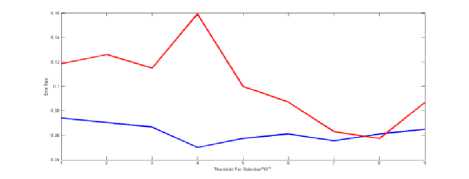
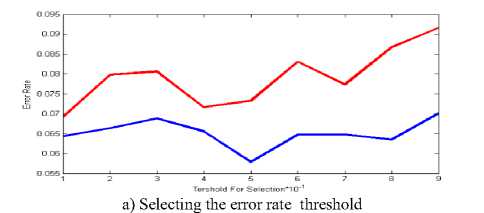
a) Selecting the threshold error rate
Threshold for Rejection *10"1 b) Rejecting the threshold error rate
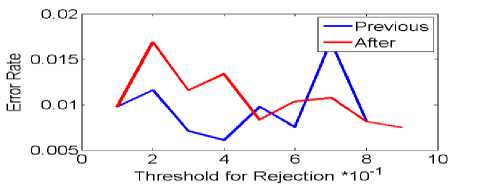
In genetic algorithm on dataset nbreast , in selection mode, pervious error and after error were in unstable condition . so as in threshold 0.9 of me are away. But in mode (b) this errors in threshold 0.4 and 0.7 to me are hit, but will be not low error rate.
a) Selecting the threshold of error rate
b) Rejecting error rate threshold
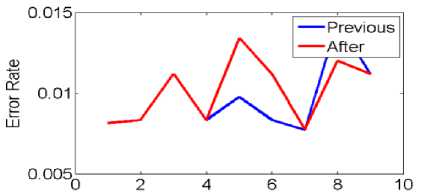
Fig.2. Selecting and rejecting threshold error rate on the data set Nbreast in Hill climbing
As in the fig shown in mode(a) on the hill climbing algorithm pervious error and after error will be me ware, and will be not me hit , but in mode (b) , of threshold 0.6 to 0.9 situation pervious error and after error is better than the other thresholds. But the situation is such that the error rate isn’t low.
Fig.1. Selecting and rejecting threshold error rate on the data set Nbreast in Genetic algorithm
a) Selecting the error rate threshold
b) Rejecting error rate threshold
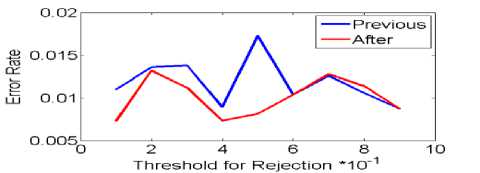
Fig.3. Select and reject threshold error rate on the data set Nbreast in Artificial bee
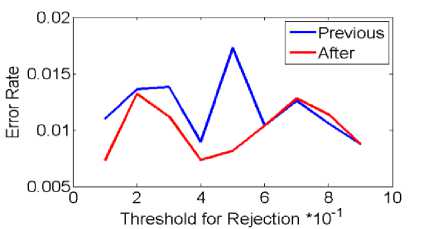
b) Rejecting error rate threshold
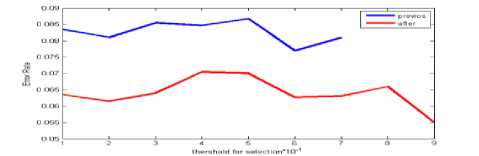
Fig.5. Selecting and rejecting error rate threshold on data set Nbreast in particle swarm optimization algorithm
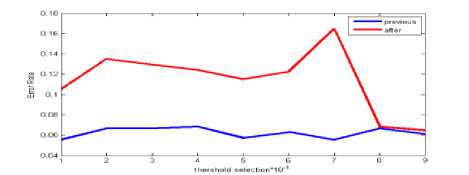
In bees algorithm in mode (a), situation is not any better. Just in threshold 0.8 pervious and after errors rate are low, but after they were ware. In mode (b) situation in threshold 0.6 to 0.8 pervious error and after error are hit, because situation isn’t better.
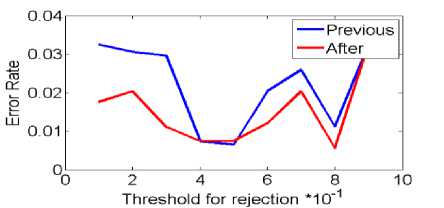
b) Rejecting error rate threshold
Fig.4. Selecting and rejecting error rate threshold on the data set Nbreast in Big Bang algorithm .
The big bang algorithm on dataset nbreast in mode (a), previous error and after error from are together ware. Situation isn’t any threshold better. But in mode (b) in threshold 0.1 and 0.8 error rate than to made (a) have collision but error rate isn’t low.
a) Selecting the error rate threshold
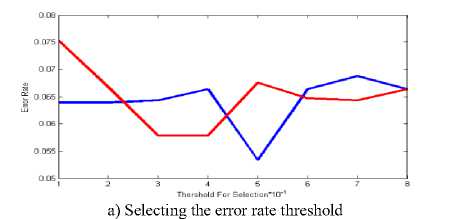
In particle swarm optimization algorithm on the data set nbreast, in state select, threshold 0.8 to 0.9 situation is favorable. But reject mode, this situation just in threshold 0.8 than to other thresholds is favorable.
b) Rejecting error rate threshold
Fig.6. Selecting and rejecting error rate threshold on the data set Nbreast in cluster algorithm
In cluster algorithm on data set Nbreast, in mode (a) pervious error and after error situation in threshold0.9 were collision, but in this situation on the data set nbreast in this cluster algorithm then other algorithms are better. Because in this mode errors are nearly. In mode (b), threshold after errors almost 0.5 lowest are error rate and threshold pervious error 0.4 lowest are situation error rate. From these experiments obtained, we conclude that the situation clustering algorithm is better.
-
VI. R esult A nalysis and F uture S cope
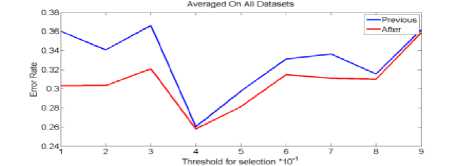
In this study, the efficiency of the proposed algorithm advantages, challenges and innovations have been discussed briefly. A set of feature selecting method based on the collective intelligence methods has been presented. It was shown experimentally that these methods can have no decrease in classifying quality, selecting almost 80% of features. Beside, these experiments showed that clustering method is the best way in finding appropriate features for classifying.
R efrences
-
[1] Camp C.V. “ Design of space trusses using Big Bang – Big Crunch optimization ”, Journal of Structural Engineering, vol.133, Issue 7, (2007 ). pp.999-1008.
-
[2] Dy J. Unsupervised feature selection. Computational Methods of Feature Selection , (2008). pages 19-39.
-
[3] Erol Osman k and Eksin I. “New optimization method : Big Bang-Big Crunch ”, Elsevier, Advances in Engineering Software .(2006).37 pp: 106–111.
-
[4] Guyon I and Elise A. An introduction to variable and feature selection . Journal of Machine Learning Research, ( 2003).3:1157-1182.
-
[5] Jain k ,. Dubes R. C. Algorithms for Clustering Data, Prentice Hall , Englewood Cliffs. (2010).
-
[6] Karaboga D, Ozturk C. A novel clustering approach:
Artificial Bee Colony (ABC) algorithm . (2011).
-
[7] Kennedy J and Eberhart R, C. “Particle Swarm
Optimization” , Proceedings of IEEE International Conference on Neural Networks, Piscataway, NJ, .(2008). pp: 1942- 948.
-
[8] Lampinen J and Laksone J and Oja E. Pattern recognition . In editor, Image Processing and Pattern Recognition, volume 5 of Neural Network Systems Techniques and Applications, (1998). pages 1- 59. Academic Press.
-
[9] Ladha L and Scholar R, Depa T, L Feature Selection Methods and Algorithms , International Journal on Computer Science and Engineering (IJCSE), Vol. 3, No. 5, .(2011). pp. 1787–1797.
-
[10] Marki F and Vogel M and Fischer M. "Process Plan optimization using a Genetic Algorithm ", PATAT, (2006), pp. 528–531. ISBN 80-210-3726-1.
-
[11] Marki F and Vogel M and Fischer M. "Process Plan optimization using a Genetic Algorithm ", PATAT, (2006). pp. 528–531. ISBN 80-210-3726-1.
-
[12] Masoudian S and ESTEKI A,." Design schedule automatically using genetic algorithm ", thesis, university of Isfahan. .(2007).
-
[13] Matlab version 7.4.0.287(R2012a), 29 january 2012,
U.S.Patents Carol Meyers and James B. Orlin, (2011), "Very Large-Scale Neighborhood Search Techniques in Timetabling Problems ", PATAT 2011, pp. 36–52. ISBN 80-210-3726-1.
-
[14] Mehdi A." Introduction to genetic algorithm and application" , Tehran: Bell Press naghos. (2009).
-
[15] Murata S and Kurova H. Self-Organization of Biological Systems. (2013).
-
[16] Neumann J, C and Schnar G. S. Combined SVM-based feature selection and classification , Machine Learning, (2005 ). Vol. 61, No. 3, pp. 129 – 150
-
[17] Perzina R. "Solving the University Timetabling Problem with Optimized Enrolment of Students by aParallel
Self-adaptive Genetic Algorithm ",(2006 ). PATAT 2006, pp. 264–280. ISBN 80-210-3726-1.
-
[18] Pham D. T and Ghanbarzadeh A and Koc E nad Otri S and Rahim S., Zaidi M. The Bees Algorithm –A Novel Tool for Complex Optimization Problems . (2006).
-
[19] Susana M and Vieira J and Sousa M.C. Fuzzy criteria for feature selection , Fuzzy Sets and Systems, (2012).Vol. 189, No. 1, pp. 1–18.
-
[20] Zhao Z and Liu H. Semi-supervised feature selection via spectral analysis. In Proceedings of SIAM International Conference on Data Mining (SDM). (2007).
References The Impact of Feature Selection on Meta-Heuristic Algorithms to Data Mining Methods
- Camp C.V. "Design of space trusses using Big Bang – Big Crunch optimization", Journal of Structural Engineering, vol.133, Issue 7, (2007 ). pp.999-1008.
- Dy J. Unsupervised feature selection. Computational Methods of Feature Selection, (2008). pages 19-39.
- Erol Osman k and Eksin I. "New optimization method : Big Bang-Big Crunch", Elsevier, Advances in Engineering Software .(2006).37 pp: 106–111.
- Guyon I and Elise A. An introduction to variable and feature selection. Journal of Machine Learning Research, ( 2003).3:1157-1182.
- Jain k ,. Dubes R. C. Algorithms for Clustering Data, Prentice Hall, Englewood Cliffs. (2010).
- Karaboga D, Ozturk C. A novel clustering approach: Artificial Bee Colony (ABC) algorithm. (2011).
- Kennedy J and Eberhart R, C. "Particle Swarm Optimization", Proceedings of IEEE International Conference on Neural Networks, Piscataway, NJ, .(2008). pp: 1942- 948.
- Lampinen J and Laksone J and Oja E. Pattern recognition. In editor, Image Processing and Pattern Recognition, volume 5 of Neural Network Systems Techniques and Applications, (1998). pages 1- 59. Academic Press.
- Ladha L and Scholar R, Depa T, LFeature Selection Methods and Algorithms, International Journal on Computer Science and Engineering (IJCSE), Vol. 3, No. 5, .(2011). pp. 1787–1797.
- Marki F and Vogel M and Fischer M. "Process Plan optimization using a Genetic Algorithm", PATAT, (2006), pp. 528–531. ISBN 80-210-3726-1.
- Marki F and Vogel M and Fischer M. "Process Plan optimization using a Genetic Algorithm", PATAT, (2006). pp. 528–531. ISBN 80-210-3726-1.
- Masoudian S and ESTEKI A,." Design schedule automatically using genetic algorithm ", thesis, university of Isfahan. .(2007).
- Matlab version 7.4.0.287(R2012a), 29 january 2012, U.S.Patents Carol Meyers and James B. Orlin, (2011), "Very Large-Scale Neighborhood Search Techniques in Timetabling Problems", PATAT 2011, pp. 36–52. ISBN 80-210-3726-1.
- Mehdi A." Introduction to genetic algorithm and application", Tehran: Bell Press naghos. (2009).
- Murata S and Kurova H. Self-Organization of Biological Systems. (2013).
- Neumann J, C and Schnar G. S. Combined SVM-based feature selection and classification, Machine Learning, (2005). Vol. 61, No. 3, pp. 129 – 150
- Perzina R. "Solving the University Timetabling Problem with Optimized Enrolment of Students by aParallel Self-adaptive Genetic Algorithm",(2006). PATAT 2006, pp. 264–280. ISBN 80-210-3726-1.
- Pham D. T and Ghanbarzadeh A and Koc E nad Otri S and Rahim S., Zaidi M. The Bees Algorithm –A Novel Tool for Complex Optimization Problems. (2006).
- Susana M and Vieira J and Sousa M.C. Fuzzy criteria for feature selection, Fuzzy Sets and Systems, (2012).Vol. 189, No. 1, pp. 1–18.
- Zhao Z and Liu H. Semi-supervised feature selection via spectral analysis. In Proceedings of SIAM International Conference on Data Mining (SDM). (2007).
