The impact of the agglomeration factor on the development of municipal entities in the Novosibirsk region

Author: Druzhinin P.V., Moroshkina M.V., Sedova K.E.
Journal: Economic and Social Changes: Facts, Trends, Forecast @volnc-esc-en
Section: Regional economy
Article in issue: 1 т.18, 2025.
Free access
The paper considers municipal entities of the Novosibirsk Region in terms of the concentration of population and other resources in the metropolitan area. The aim of the research is to study the influence of population concentration in the Novosibirsk agglomeration on the development of the region's municipalities and the dynamics of the region's economy as a whole. The information base includes data from Rosstat and its Novosibirsk territorial division. The research period covers the time interval from 2005 to 2022. We propose an approach that allocates three territorial sectors of the economy, one of which is the Novosibirsk agglomeration, the other two include successfully developing and depressed municipalities, depending on the dynamics of their indicators. The resulting sectors are adjusted based on the location of municipal entities. Peripheral municipalities, being under the influence of the Novosibirsk agglomeration, are characterized by significant population migration, but economic indicators are growing faster in successfully developing municipalities compared to the Novosibirsk agglomeration. Using the Cobb - Douglas production functions constructed for three sectors we assess the impact of an increase or decrease in migration to the Novosibirsk agglomeration from other sectors. The results obtained make it possible to put forward some guidelines that will allow individual peripheral territories to develop successfully, primarily by creating favorable living conditions for the population. The study is part of a research project to assess the impact of the formation and development of agglomerations on the economy of the region as a whole. The results obtained can be used in regional strategic and program documents
Agglomerations, periphery, municipal entities, production functions, population migration, territorial development
Short address: https://sciup.org/147251336
IDR: 147251336 | UDC: 332.1 | DOI: 10.15838/esc.2025.1.97.7
Text of the scientific article The impact of the agglomeration factor on the development of municipal entities in the Novosibirsk region
The research was supported by Russian Science Foundation grant 23-28-00446, project/23-28-00446, and topic 122032200200-2 of the state task for the Institute of Economics of the Karelian Research Centre of the Russian Academy of Sciences.
A significant amount of research is devoted to the spatial development of regions in conditions of concentration of resources in their centers, and various models have been built to study the ongoing processes (Harris, 1954; Ellison, Glaser, 1997; Krugman, Venabies, 1997; Holmes, Stevens, 2002; Romer, 1992). Many works have shown that there are considerable economic benefits from the concentration of economic activity and the formation of agglomerations (Kolomak, 2018; Kolomak, Sherubneva, 2023; Pavlov, Khmeleva, 2023; Olifir, 2024). It is noted that agglomerations are characterized by a more progressive economic structure and higher indicators of economic development, such as the level of production development, factor productivity, average monthly wages, and others (Zubarevich, 2006; Kolomak, 2013; Ago et al., 2018). Knowledge-intensive industries are concentrated in the agglomeration, with more diverse clusters located in its core and highly specialized ones on its periphery (Chica, 2016; Inkinen, Kaakinen, 2016).
Agglomerations have an impact on the development of surrounding territories, and the largest of them influence not only their own region, but also neighboring territories (Lukin, Uskova, 2018). At the same time, studies have demonstrated that economic benefits and advantages tend to fade as one moves away from the agglomeration center (Fauzer et al., 2021; Rosenthal, Strange, 2004). It was noted that the influence of the agglomeration population on factor productivity in various types of economic and production activities decreases with distance; ebbing of influence usually begins at about a 60 km distance (Lavrinenko et al., 2019; Olifir, 2022; Isaev et al., 2022). There is also a correlation between population density in the agglomeration and economic growth (Chen et al., 2023).
When analyzing the development of European capitals, it was shown that it is necessary to improve second-tier cities and resist investment concentration within capitals, otherwise these resources gradually become less effective (Parkinson et al., 2015). In Russia, given the depopulation, the growth potential of “second cities” is limited; population concentration increases spatial compression, and remote municipalities lose population faster (Mkrtchyan, Karachurina, 2014; Moroshkina, 2023). As a result, agglomeration growth and resource concentration in the capital of the region and its surroundings can lead to periphery degradation (Uskova, 2015). In this regard, the research of the impact of resource concentration in the regional center on the growth of the entire region’s economy is relevant.
The Spatial Development Strategy of the Russian Federation for the period up to 20251 has identified the processes of agglomeration development as one of the main sources of economic growth. It established the largest and large Russian agglomerations. However, in the Spatial Development Strategy of the Russian
Federation for the period up to 2030 with a forecast up to 20362, more attention is paid to interregional and intraregional differentiation and the issue of territories that are losing population due to its migration into agglomerations.
The development of the territories surrounding the agglomeration depends on the distance from the agglomeration center and its population (Bufetova, 2011; Bufetova, 2020). The municipalities closest to the regional capital are usually growing, while the more remote ones are depopulating, and this process accelerates with the distance. It should be noted that under certain conditions, municipal entities that are quite far from the agglomeration can also develop successfully. When analyzing the growth of municipalities in the Northwestern Federal District, it was shown that, in addition to those surrounding the regional center, municipalities with transport infrastructure, institutions of secondary and higher vocational education, and often located on the borders of the region, interact with neighboring entities (Druzhinin, 2023). Individual municipalities cooperate with other regions and their enterprises are integrated into large federal structures, which allows them to receive the resources necessary for their growth and implement innovative projects in various types of activities (Kozhevnikov, 2023; Kozhevnikov, Voroshilov, 2024).
Novosibirsk is located in the east of the region. The Novosibirsk Region development analysis showed that although there are slowly developing municipalities to the west of the agglomeration, individual municipalities that are located even further west are developing noticeably faster than Novosibirsk (Kolomak, 2024).
The scientific challenge is that, at one point, agglomeration development and population concentration put brakes on the regional economy growth due to the periphery degradation, and the impact of agglomeration development on the whole region’s economy is poorly understood. Peripheral territories can develop successfully, but more often they can turn out to be left behind places, rapidly losing their population (MacKinnon et al., 2021; Pugh, Dubois, 2021). This largely depends on the availability of infrastructure, but other factors also matter (Glass et al., 2019; Kolomak, 2024).
So, it can be assumed that under certain conditions, developing territories may appear at some distance from the agglomeration, and the support of the authorities is crucial for their more successful development. The growth of agglomerations can lead to desertification of a significant part of the region’s territory, and local authorities should encourage the development of municipalities with the necessary potential. Their improvement can increase the quality of life and their gradual growth can create conditions for the progress of the surrounding municipalities.
Accordingly, the aim of the research is to study the influence of population concentration in the Novosibirsk agglomeration on the development of other municipalities in the region, identify successfully developing municipalities and assess the impact of changes in migration from them to the agglomeration.
To achieve this aim, it is necessary to solve a number of tasks that will allow us to obtain new results:
-
1) development of a methodological approach for analyzing the consequences of resource concentration in an agglomeration;
-
2) analysis of the dynamics of development indicators of the municipal entities of the Novosibirsk agglomeration and aggregated territorial sectors outside of it;
-
3) construction of production functions and assessment of the influence of decreasing/increasing migration and employment between sectors on the regional economy dynamics.
Methodology and data
Based on the development analysis results for regions and agglomerations in Russia, an approach has been created to identify territorial sectors depending on the characteristics of the development of territories and their geographical location. The region is divided into an agglomeration and a periphery. The main feature of the approach is to identify three territorial sectors: agglomeration, successfully developing territories and slowly developing (depressed) territories. The methodology was created based on an analysis of the development of various regions with the largest, large agglomerations and small capitals.
Data from Rosstat3 and Novosibirskstat4 were used to test the proposed approach. To build aggregated territorial sectors and models, information was obtained for municipalities on the following indicators: shipped own-produced goods, works and services performed on their own (excluding small businesses), including Industry; average number of employees (excluding small businesses); investment in fixed assets (excluding small businesses) and population as of January 1. Data on shipped goods are available only from 2014, which limited the study period. The value indicators of municipalities were recalculated into indices using their proportion in the corresponding regional indicator (investment dynamics and industrial production), which had previously been obtained in a comparable form, according to data available in Rosstat books. The problem is the lack of shipped goods indices by region. In this work, the dynamics of gross regional product and the proportions of municipalities in terms of shipped goods were taken, and an approximate estimate of the indices for the three identified territorial sectors was calculated. In addition to long-term investments, approximate fixed assets dynamics were built based on their structure at the end of 2013 and investment dynamics.
In the work, the Novosibirsk agglomeration was determined on the basis of the Novosibirsk Region Government Resolution 105-p, dated March 19, 20195. It included Novosibirsk, Berdsk, Iskitim, Koltsovo, Ob urban okrugs and Iskitimsky, Kolyvansky, Kochenevsky, Moshkovsky, Novosi-birsky, Ordynsky and Toguchinsky municipal districts, 12 municipal entities in total. There are also other approaches, for example, in the Order of the Ministry of Economic Development of Russia 669, dated September 26, 2023 (revised May 31, 2024) “On approval of Methodological recommendations for the creation of long-term plans for the socio-economic development of large and the largest urban agglomerations”6 there are no Iskitimsky, Ordynsky and Toguchinsky municipal entities. The Center for Strategic Research’s documents do not include Ordynsky and Toguchinsky municipal districts7.
The second sector was identified by analyzing the dynamics of population, employment, investment, output and labor productivity of the municipal entities of the region and comparing these indicators with the corresponding indicators of
Novosibirsk and the region in general, which allowed selecting more successfully developing municipalities. They have potential for economic growth, and their key indicators (investment, output, and labor productivity) have significantly better dynamics than the region in general. Based on the analysis, nine municipal entities were classified as successfully developing: Barabinsky, Bolotnitsky, Zdvinsky, Kargatsky, Kuibyshevsky, Maslyaninsky, Tatarsky, Chanovsky and Chulymsky districts. Then this list was refined taking into account the geographical location of municipalities, the specifics of their economic development and the availability of transport infrastructure.
The third sector consists of municipalities that are losing human capital and other resources, following a general pattern: the further away from the regional capital, the faster the population and other indicators decrease; these are depressed or slowly developing municipalities.
After aggregating the indicators for the three territorial sectors obtained, graphs were charted, the analysis of which made it possible to verify aggregation validity and check whether there are any dependencies.
As a result, according to regional documents, 12 municipal entities were initially included in the Novosibirsk agglomeration, 9 were classified as developing and 14 as depressed.
In 2018, the Barabinsk-Kuibyshev agglo-meration8 was launched as part of Barabinsky, Kuibyshevsky, Severnyi and Zdvinsky districts in the northwestern part of the region. A Coordinating Council has been formed, but there is still no active work. The heterogeneity of the emerging agglomeration should also be highlighted: along with developed municipalities, it also includes Severnyi District with a low level of economic development.
Figure 1. Municipal entities of the Novosibirsk Region
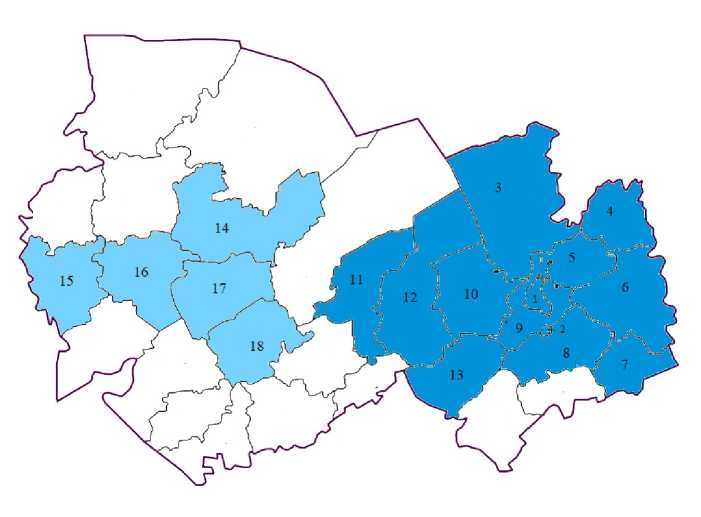
Colored: blue – expanded Novosibirsk agglomeration (1 – Novosibirsk, 2 – Berdsk, 3 – Kolyvansky Municipal District, 4 – Bolotninsky, 5 – Moshkovsky, 6 – Toguchinsky, 7 – Maslyaninsky, 8 – Iskitimsky, including Iskitim city, 9 – Novosibirsky, including Ob city and Koltsovo industrial township, 10 – Kochenevsky, 11 – Kargatsky, 12 – Chulymsky, 13 – Ordynsky), light blue – expanded Barabinsk-Kuibyshev agglomeration (14 – Kuibyshevsky Municipal District, 15 –Tatarsky, 16 – Chanovsky, 17 – Barabinsky, 18 – Zdvinsky)
The developing municipalities location analysis has shown that two of them (Bolotninsky and Maslyaninsky districts) are close to the east of the Novosibirsk agglomeration, and two (Kargatsky and Chulymsky) are connected with the west of it by the Trans-Siberian railway, and it can be assumed that after some time they will enter the agglomeration. The remaining five are either part of the Barabinsk-Kuibyshev agglomeration or they are adjacent to it. In this case, we can consider another option for aggregating municipalities, which eventually became the main one, including 16 municipalities in the expanded Novosibirsk agglomeration, and five municipalities in the expanded Barabinsk-Kuibyshev agglomeration (later in the article, these five municipalities will be understood as the Barabinsk-Kuibyshev agglomeration). 14 municipalities were classified as depressed in both variants (Fig. 1).
Based on the collected data, graphs were charted and analyzed to identify the dependencies of indicators; production functions were constructed, considering the correlation between the dynamics of shipped goods and the dynamics of employment and long-term investments (or fixed assets):
Y,(t) = A*ка(t)X L,« (t), (1)
where: Y(t) – shipped goods;
K(t) – long-term investments (or fixed assets);
L(t) – number of employees;
i – sector; t – year; A , α, β – constants.
The standard Excel and Statistica packages were used as tools.
Based on the constructed functions, it was analyzed whether an increase or decrease in migration (respectively, a change in the employment structure) to the Novosibirsk agglomeration could affect the gross regional product dynamics. For an approximate assessment of a potential decrease (increase) in population density in the agglomeration, part of the employment was transferred from one territorial sector to another while maintaining the capital-labor ratio in the sector (with a corresponding change in longterm investments or fixed assets). Equation (1) was used to calculate the change in total shipped goods, provided that the number of employees and investments in the region in general did not change.
Previously, a three-sector optimization model of the region’s economy was built based on the Cobb – Douglas production functions, with the sum of employed and fixed assets (long-term investments) unchanged (Druzhinin, 1990):
Y(t) = ^ Ai x Kia‘ (t) x Le (t)- > max. (2) i
Based on a special program, calculations of the optimal allocation of resources were carried out to maximize output without limitations and while fixing one of the indicators’ structure by sector for 2014–2022. In an optimal structure, the sectors’ return on assets ratio is determined by the assets elasticity ratio, and the sectors’ labor productivity ratio is determined by the labor elasticity ratio.
Results
The Novosibirsk Region’s population increased by 2.6% compared to 2000, in contrast to most regions of the Siberian Federal District (SFD): the district as a whole depopulated by 8.8%. The largest population in the region was recorded in 2018. It is worth noting that the number of employees peaked in 2012, and then it decreased by 3.4% in the Novosibirsk Region. Its gross regional product grew faster than that of other Siberian Federal District regions: compared with 2000 there was a 2.6-fold increase, and in the Siberian Federal District as a whole – 2-fold.
The difference in approaches to the allocation of agglomerations affects only the dynamics of developing municipalities’ indicators, since the four municipal entities adjacent to the Novosibirsk agglomeration are developing faster than the remaining five (Barabinsk-Kuibyshev agglomeration), most likely due to their proximity to Novosibirsk. Of these, only Maslyaninsky District has low rates of average revenue and profit (Kolomak, Sherubneva, 2023). In the first allocation variant, the population and employment in the Barabinsk-Kuibyshev agglomeration are decreasing more slowly; investment, shipping volume and labor productivity are growing faster. In the second variant, labor productivity in the Barabinsk-Kuibyshev agglomeration increased only by 2/3 in 2014–2022, and in the expanded Novosibirsk agglomeration by 29%, which differs slightly from the first aggregation variant (28%). From henceforth, the second option is considered, which takes into account the geographical location of municipal entities.
About 58.4% of the region’s population lives in Novosibirsk. Respectively, there is high production concentration in the Novosibirsk agglomeration, providing more than 80% of most indicators: more than 90% of shipped goods, and more than 95% of industrial output.
During the period 2005–2022, the population of the Novosibirsk agglomeration, as well as most of the largest agglomerations in Russia, increased. Migration is mainly directed to the Novosibirsk agglomeration; in 2023, only Barabinsky District had also positive net migration. Accordingly, the agglomeration population increased by about 13% in 2005–2022, while decreasing in the other two sectors by 22 and 23% (Fig. 2) . The sharp changes in population in 2010 and 2021 are due to a more accurate assessment based on the population censuses results.
Figure 2. Population dynamics of the three territorial sectors of the Novosibirsk Region compared to 2014
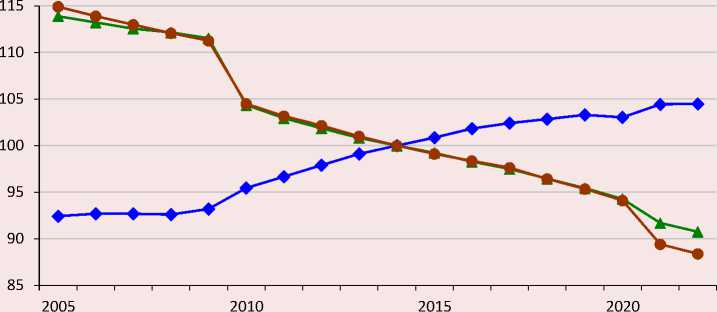
— ♦ — Agglomeration —л— Developing —•— Depressed
Source: own compilation based on Rosstat data.
The number of people employed in the region decreased, but in agglomerations this decrease was relatively small, by 13% in 2005–2022 in the metropolitan area and by 17% in the Barabinsk-Kuibyshev agglomeration, while in depressed municipal entities there was almost a 2-fold fall. However, investment changes differently: in the Novosibirsk agglomeration there was a 1.9-fold increase, while in the Barabinsk-Kuibyshev agglomeration – a 4.6-fold increase. As a result, the shipping volume grew faster in the Barabinsk-Kuibyshev agglomeration, about 1.4-fold, while in the Novosibirsk agglomeration – 1.2-fold. Accordingly, there was a 1.7-fold increase in labor productivity in 2014–2022 in the Barabinsk-Kuibyshev agglomeration, 1.3-fold in the Novosibirsk agglomeration, and a 7% decrease in depressed municipal entities (Fig. 3) .
The dependence of labor productivity on the capital-labor ratio was also analyzed, and the latter was calculated both on long-term investments over 4 years and on the assessment of fixed assets dynamics. In this work, linear homogeneous
Cobb – Douglas production functions were used for aggregated territorial sectors, in which the sum of factor elasticities equals one (Tab. 1) . It should be emphasized that the difference in investment efficiency between the two agglomerations is insignificant and it is much greater than that of depressed municipal entities, which means that the efficiency of investments in the Barabinsk-Kuibyshev agglomeration is as great as in the Novosibirsk agglomeration.
Based on the results obtained, it was estimated how the region’s output would change with a decrease or increase in migration between the sectors under consideration. The redistribution of the population (and employment, respectively) between sectors was analyzed. Since the employment in the Barabinsk-Kuibyshev agglomeration and depressed municipal entities is low (5.2 and 8.3%), the relocation of 1% of the employed from them to the Novosibirsk agglomeration almost does not increase the whole region’s output. The reverse transfer of 1% of the employed to depressed municipal entities will lead to a
Figure 3. Labor productivity dynamics of the three territorial sectors of the Novosibirsk Region compared to 2014, %
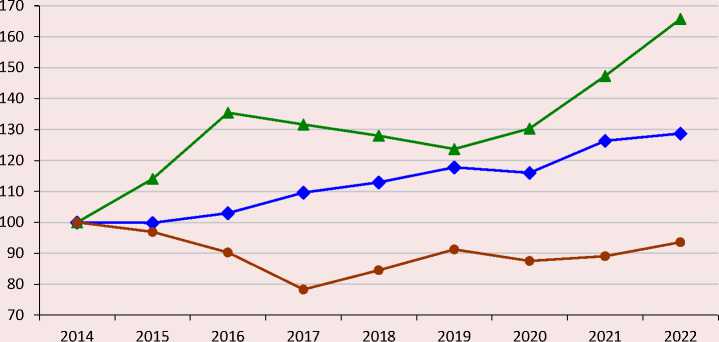
— ♦ — Agglomeration —*— Developing • Depressed
Source: own compilation based on Rosstat data.
Table 1. Calculation data on the parameters of the Cobb – Douglas functions for the three economy sectors of the Novosibirsk Region in 2014–2022
We have analyzed the differences between the real and optimal structure of the region’s economy. Calculations on the optimal structure sometimes lead to unrealistic results with a sufficiently large difference in factor elasticities across selected sectors. In the Novosibirsk Region, the difference in elasticity between the two agglomerations is insignificant, there is a high production concentration in the efficient Novosibirsk agglomeration. As a result, the optimal economy structure is close to the real one (Tab. 2) .
Table 2. Calculation data on the optimal structure for the three economy sectors of the Novosibirsk Region for 2014–2022 (2014 – 100%)
|
Year |
Actual values, shipped goods index |
Unlimited calculations |
Calculations with the fixed employment structure |
Calculations with the fixed assets structure |
Calculations with the fixed output structure |
|
2014 |
100.0 |
104.7 |
101.7 |
101.7 |
101.3 |
|
2015 |
98.0 |
107.8 |
104.6 |
104.6 |
104.0 |
|
2016 |
99.0 |
110.6 |
107.3 |
107.3 |
106.4 |
|
2017 |
103.2 |
113.6 |
110.1 |
110.1 |
109.6 |
|
2018 |
106.7 |
117.0 |
113.5 |
113.4 |
113.2 |
|
2019 |
109.5 |
120.7 |
117.0 |
116.9 |
116.7 |
|
2020 |
108.0 |
125.0 |
121.2 |
121.0 |
120.7 |
|
2021 |
116.4 |
129.5 |
125.5 |
125.3 |
125.0 |
|
2022 |
119.8 |
134.0 |
130.0 |
129.6 |
129.1 |
|
Source: Rosstat data. |
|||||
In the Novosibirsk Region, output deviation is increasing from 4% in 2014 to 12% in 2022 without limitations and from 1 to 9% with limitations on the structure of assets or labor. Without limitations, almost all resources are moved to the Novosibirsk agglomeration, and with the fixed output structure, resources in the other two sectors are reduced by about half. In the Barabinsk-Kuibyshev agglomeration, with the fixed employment structure, there is a 3-fold decrease in the value of assets, and with the fixed assets structure, there is a 6-fold decrease in employment. Similar changes are in depressed municipalities. The main reason is high labor productivity in the industrial Novosibirsk agglomeration and the high proportion of agriculture in the Barabinsk–Kuibyshev agglomeration (Fig. 4).
Figure 4. Labor productivity dynamics of the three territorial sectors of the Novosibirsk Region at current prices, thousand rubles
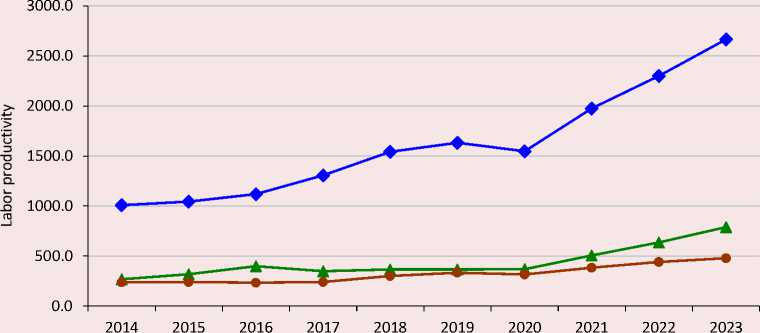
— ♦ — Agglomeration —A— Developing • Depressed
Source: own compilation based on Rosstat data.
Discussion
Our proposed new approach with the allocation of three sectors allowed us to show that there are municipal entities outside the metropolitan area that are developing no less successfully. The results obtained reflect certain differences typical for the Asian part of Russia. In European regions, periphery depopulation has a negative impact on the gross regional product dynamics, while in the Asian part it is rather positive: the faster region’s periphery depopulates, the faster gross regional product per capita grows (Druzhinin et al., 2024). The dissimilar structure of the economy leads to a significant difference in labor productivity in the center and on the periphery. It has already been emphasized that labor productivity, as a rule, is much higher in an agglomeration than in territories outside it (Isaev et al., 2022). A change of residence leads to a more productive and profitable type of activity, which contributes to migration to metropolitan areas.
The development of municipal entities outside the metropolitan agglomeration is hindered by weak intermunicipal interactions; the influence of the metropolitan area on the periphery is minor; many agreements are formal; issues of agglomeration processes activation are not reflected or poorly reflected in regional strategic documents; there is no consistency of documents at different levels (Druzhinin, Kuznetsova, 2023; Sekushina, Kozhevnikov, 2024; Ugryumova, Savelyeva, 2023). As a result, there is a danger of “enclavization” of the region, when almost the entire population lives in its capital, and the rest of the territory, once densely populated, is being developed on a shift basis (Kopytova, Patrakova, 2024).
The Barabinsk-Kuibyshev agglomeration is small in terms of population, with fewer than 200,000 people living in it. A research of relatively small metropolitan areas has shown that they can develop successfully under certain conditions (Kozhevnikov, Voroshilov, 2024). The Barabinsk-Kuibyshev agglomeration has a significant number of institutions of secondary vocational education that train specialists needed for economic development, as well as a branch and representative office of universities. Their presence contributed to a rather slow decline in employment, unlike in depressed municipalities. The creation of new enterprises is currently hampered by the lack of qualified personnel, and therefore it is necessary to increase funding for the vocational education system.
The existing potential needs support primarily from the regional authorities. In addition to the development of educational institutions, it is necessary to promote the creation of more favorable living conditions for the population, including the renovation of social infrastructure and engineering networks, urban environment improvement and the creation of conditions for recreation and sports.
Conclusion
The paper considers the development of the Novosibirsk Region’s municipal entities, identifies the Novosibirsk agglomeration, and, depending on the dynamics of the remaining municipalities and their geographical location, allocates two territorial sectors – successfully developing (Barabinsk-Kuibyshev agglomeration) and depressed municipal entities. Both sectors are losing population, but in the former, output and labor productivity are growing faster than in the Novosibirsk agglomeration.
During the indicators dynamics analysis and the construction of production functions, it was revealed that the efficiency of the Novosibirsk and Barabinsk-Kuibyshev agglomerations differs slightly, but a higher level of labor productivity leads to the fact that the flow of resources to the Novosibirsk agglomeration contributes to the efficiency enhancement of the whole region’s economy. At the same time, further population concentration in the Novosibirsk agglomeration will eventually cause a deterioration in the indicators of the Barabinsk-Kuibyshev agglomeration, accelerate the decline in employment in it and the process of desertification of the region in the west.
In the European part of the country, outside the Moscow and Saint Petersburg agglomerations, population outflow from the periphery leads to its desertification and decreasingly compensates for the population outflow from regional capitals to the Moscow and Saint Petersburg agglomerations, which causes a noticeable slowdown in gross regional product growth in most regions of the Northwestern Federal District, Central Federal District and Volga Federal District. To avoid such a scenario, it is necessary to develop regional programs in the Novosibirsk Region and other regions of the Asian part of the country to stimulate municipal entities with growth potential to increase funding for personnel training inside of them, and attract federal financing.
