The impact of the pandemic on demographic processes in the Russian Arctic

Author: Smirnov Andrei V.
Journal: Economic and Social Changes: Facts, Trends, Forecast @volnc-esc-en
Section: Social and economic development
Article in issue: 6 т.14, 2021.
Free access
Russia has achieved a high level of Internet connectivity and the use of digital technologies; this helps to accumulate and systematize huge amounts of population data. Modern challenges, such as the COVID-19 pandemic, require a more prompt and detailed analysis of the demographic situation. Understanding the information collected by digital platforms and services can improve the quality of decision-making and be widely used in science and management. The aim of our study is to assess the change in the demographic situation in the Russian Arctic under the influence of the pandemic, with the use of new sources of population data that have emerged as a result of digitalization of the economy and public life. The article proposes an outline for the formation of a demographic knowledge base by combining traditional population statistics with data from digital platforms. We consider advantages and disadvantages of new data sources, features and examples of their application. We provide a detailed description of demographic processes in the Arctic Zone of the Russian Federation in 2020-2021 with the use of municipal statistics, data from Yandex online platforms and international pandemic databases. With the help of the proposed outline, we consider the dynamics of morbidity, mortality and vaccination against coronavirus infection. We study the reaction of the population of the Russian Arctic to the pandemic by analyzing the structure of search queries and the intensity of movement in city streets. We reveal the specifics of the spread of COVID-19 in the Arctic and estimate the impact of the pandemic on the natural population change and human mobility in the Arctic Zone. We calculate excess mortality at the regional and municipal levels. Based on the vaccination rates, we draw conclusions about the prospects for further development of the pandemic. The results obtained can be used for development of socio-demographic policy measures and construction of demographic forecasts for the Northern and Arctic territories.
Pandemic, digital footprint, vaccination, excess mortality, migration, data sources, russian arctic
Short address: https://sciup.org/147236302
IDR: 147236302 | UDC: 314.02+314.4(985) | DOI: 10.15838/esc.2021.6.78.15
Text of the scientific article The impact of the pandemic on demographic processes in the Russian Arctic
The COVID-19 pandemic caused by SARS-CoV-2 has significantly affected global demographic changes in 2020–2021. It has claimed millions of lives worldwide, closed borders, reduced migratory movements, and led to economic decline [1]. Arctic societies are particularly vulnerable to epidemics due to the concentration of the population in isolated areas, high migration mobility and the prevalence of a number of chronic diseases [2], so ensuring sanitary and epidemiological safety has become one of the main objectives of the Strategy for Development of the Russian Arctic Zone and Ensuring National Security until 2035 approved in 20201.
A large comparative study [3; 4] identified five groups of Arctic countries and regions according to the nature of the pandemic in 2020. In Iceland, northern Norway, Finland, and the Faroe Islands (the “shockwave” group), incidence and mortality rates soared earlier than in other parts of the Arctic, but quickly went down due to extensive quarantine measures. In northern Sweden (the “lingering waves” group), the rises in incidence and mortality were more pronounced and prolonged due to soft policies aimed at building herd immunity in the population. In northern Canada and Greenland (the “isolated outbreaks” group), due to remoteness and preventive measures, no significant spread of the pandemic has been recorded; there were sporadic deaths. Alaska (USA) was part of the group called the “tsunami” because, while the incidence rate was relatively low at the beginning of the pandemic in November and December, it had the highest incidence rate in the global Arctic; then, after an effective vaccination campaign, it declined.
Russia (the “tidal wave” group) is of particular interest. With the relatively late onset of the pandemic, the Russian Arctic experienced the longest rises in morbidity and mortality. Russia accounts for most of the cases and deaths from coronavirus in the global Arctic2, and the relative numbers are comparable to Alaska and Sweden. In addition, Russia lags behind other Arctic territories in vaccination rates [4]. In order to understand the reasons for this situation, we will analyze in detail the data on natural and migratory movements of the population in this article.
A key to describing and explaining demographic processes during a pandemic might be the new data sources that have emerged from the digitalization of society [5; 6]. Digital transformation has become a major driver of societal change in the Arctic, as reflected in the State of the Nordic Region Report 2020 [7]. Web-based platforms and information systems collect enormous amounts of population data that can be applied to science and public administration. They have advantages in the speed of information accumulation over traditional statistics, which is especially important in a pandemic.
The study aims to analyze the demographic situation in the Russian Arctic under pandemic conditions using both traditional and new sources of population data. In theoretical terms, the originality of the study lies in the systematization of demographic data sources that can be collected or processed using new digital technologies. The resulting demographic knowledge base is highly responsive and detailed. In the spatial dimension, the detalization reaches the municipal and settlement levels, and in the temporal dimension, it reaches weeks and even days. The practical contribution of the work consists in obtaining new knowledge about the demographic development of the Arctic zone of the Russian Federation during the pandemic of coronavirus infection.
The study will answer three questions: (1) What data sources can be used to analyze demographics in the context of digitization of society? (2) How has the demographic situation in the Russian Arctic been changing during the coronavirus pandemic? (3) What are the demographic consequences of the COVID-19 pandemic for the Russian Arctic in 2020? The object of the study is the population of the Arctic zone in the Russian Federation, which includes 75 urban okrugs and municipal districts in 20213.
New digital sources of demographic data
Due to the high degree of urbanization [8], the Russian Arctic exceeds the Russian average in terms of Internet connectivity (Tab. 1) . The proportion of Internet users there is more than 90%, which is higher not only than the world average (51%), but also than the average level of the developed countries of the world (87%)4. More than half of Russian Arctic residents use the Internet to order goods and services, which is especially important for remote and isolated areas. 82% of households have broadband access to the network.
Many everyday practices, such as searching for information, working, studying, and communicating, are increasingly carried out in a networked environment using Internet platforms and services [6]. Due to the development of information technology and the spread of the Internet, there are unprecedented opportunities for data collection on a scale “both enormous and microscopic” [9, p. 131]. Internet platforms collect data about
Table 1. Internet connectivity rates in the Arctic zone of the Russian Federation and Russia as a whole*, %
Indicator Russian Arctic zone Russian Federation 2016 2018 2020 2016 2018 2020 Proportion of households with: - a computer 84.8 83.8 80.1 74.3 72.4 72.1 - Internet access 84.0 86.4 86.6 74.8 76.6 80.0 - Broadband Internet access 73.9 80.1 81.6 70.7 73.2 77.0 Proportion of the population**: - Internet users 86.4 91.2 90.6 76.4 83.8 87.2 - active Internet users (use at least once a week) 82.9 88.4 88.6 71.5 79.3 84.1 - using the Internet to order goods and services 38.0 55.9 51.3 23.1 34.7 40.3 * According to a sample federal statistical observation on the use of information technology and information and telecommunications networks by the population. ** To the total population in the age of 15–74; 2016 – for the population in the age 15–72. Source: Statistical information on the socioeconomic development of the Arctic zone of the Russian Federation. Rosstat. Available at:
3 “On state support for entrepreneurial activity in the Arctic zone of the Russian Federation”: Federal Law no. 193–FZ, dated July 13, 2020.
4 Statistics. International Telecommunication Union. Available at:
users by analyzing the digital footprint, that is, their actions on digital devices [10]. The collection and processing of user data is central to modern technology companies. “The developed capitalism of the twenty-first century has gradually built itself around the task of extracting and using a special kind of raw material: data... Just like oil, data is a raw material that is extracted, purified and used in many different ways. The more data one has, the more different are the ways in which one can use it”. [11, p. 37].
Let us consider the scheme of formation of the demographic knowledge base (Fig. 1). First of all, it is necessary to separate the real population and the virtual population, that is, the projection of the real population into the digital environment. They vary in both number and composition. The virtual population may or may not include several projections of a single person. In addition, digital technologies are used differently in different age-sex and social groups. The real population interacts in the digital environment and experiences its opposite influence [12]. For example, the demographic attitudes of the population change with the development of information technology, when new forms of mobility and virtual migration arise [13].
The demographic knowledge base is formed from two types of sources. First, these are traditional demographic data reflecting the characteristics of the real population: official statistics, the results of censuses and sample population surveys. Microdata bases are of particular interest here [14]. These are the results of surveys and censuses broken down by individual or household, which allow studying any distributions of features and constructing arbitrary tables. The number of publicly available microdata records is already measured in billions [15, p. 287]. It has been suggested that extensive demographic microdata collected for research purposes should be considered big data, since the same methods
Figure 1. Creating a demographic knowledge base using new digital data sources
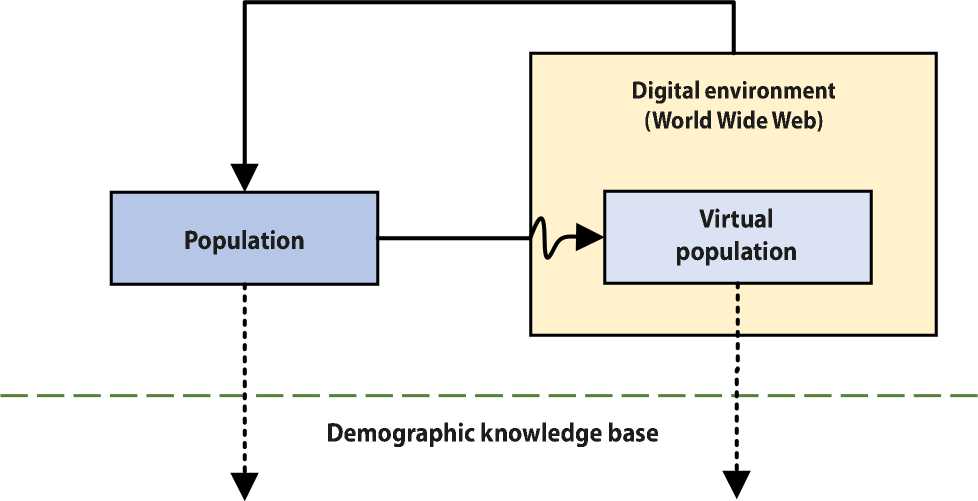
Traditional data:
- official statistics
- sample surveys
- microdata
New data sources:
- population digital footprint
- Internet platforms
- State information systems
Source: own compilation.
Methods of data verification and reconciliation
of processing, verification, and analysis often are applicable to them [16]. Thus, Rosstat provides access to microdata of many sample surveys and all post-Soviet censuses.
Publicly available statistical databases are widely used in Arctic research. For example, the Microdata Base of the Russian Census of 2010 was used to assess the human development indicators of the Russian Arctic at the municipal level [17]. Even more often, the Rosstat Municipal Indicators Database is used, which includes more than 500 indicators for 20 thousand municipalities of Russia. Due to its huge volume and high level of detalization, it can also be regarded as a microdata base, with territories and municipalities as its accounting units, rather than individuals. For example, with the help of this database, a ranking of the supporting zones of development in the Russian Arctic has been performed [18], and migration patterns of the Arctic population have been revealed [19].
While traditional demographic data are originally collected for research purposes, new digital data sources are of a different nature. They are generated directly in the digital environment for purposes often unrelated to science. These data are obtained from social media, search engines and other websites, call logs, GPS sensor readings, digitized texts [20; 21]. The intermediate position between the new and traditional data is occupied by online surveys conducted by methods close to traditional, but in a digital environment.
New data sources have also found application in the study of the Arctic. For example, information from the social media VKontakte has been used to analyze return migration in the Russian Arctic [22] and to identify the routes of intermunicipal movements [19]. NASA night satellite images have been used to analyze settlement systems in different parts of the world’s Arctic [23]. Big data from Sberbank made it possible to assess the structure and dynamics of population consumption in the
Arctic [24]. Data from the Google Mobility Reports service were used to study changes in the mobility of residents of Arctic countries [3].
The disadvantages of new digital data sources include low representativeness (in most cases), fragmentary nature, vulnerability to changes, possibility of errors in algorithms, false information and spam accounts, low reliability, duplication of information, and limited access to data [9; 25]. Their advantages are huge volume, high production speed, high detalization, internal diversity, exhaustiveness, interconnection with other data, extensibility, scalability [26]. It is noteworthy that new data sources are deprived of one of the main limitations of classical surveys – reactivity. When respondents know they are participating in a study, it can influence their responses [21].
In order to become an effective scientific tool, the demographic knowledge base must meet a number of requirements. First, the data must be linked to territories, ideally at the level of municipalities or even settlements. The higher the detalization, the more conclusions about the nature of demographic processes we can get. Second, data from different sources must not contradict each other. Methods are being developed to verify digital population data and to reconcile them with traditional statistics. These include poststratification and Bayesian hierarchical modeling [20]. Various methods of machine learning and data mining are also used. Third, the data should be as up-to-date as possible, without a significant time lag, taking into account seasonality and historical dynamics if possible.
The Arctic research centers are now making their first attempts to integrate research databases, scientific publications, and traditional knowledge into unified knowledge bases on socio-economic processes in the Arctic [27, p. 229]. In the future, these initiatives may become the basis for a more systematic explanation of the patterns of functioning of Arctic societies.
Research methodology
The Arctic zone of the Russian Federation will be considered within the boundaries defined by Federal Law no. 193–FZ, dated July 13, 2020, “On state support for entrepreneurial activity in the Arctic zone of the Russian Federation”5. According to the Law the territories of 75 urban okrugs and municipal districts in nine northern constituent entities of the Russian Federation (Fig. 2) are attributed to the Arctic. Their population at the beginning of 2021 was 2.6 million people (1.8% of Russia’s population), contributing about 6% to the gross regional product of the country. The population in the Russian Arctic is rapidly decreasing, since 1989 its number has decreased by about a third, and in Chukotka – by three times [28, p. 122]. Many settlements are completely or almost completely depopulated. The Arctic zone covers about 30% of Russia’s territory. There is a very high degree of urbanization, and the spatial distribution of the population is uneven [29]. Almost 80% of the population lives within 100 km of eight major population centers: Arkhangelsk, Murmansk, Apatity, Norilsk, Noyabrsk, Novy Urengoy, Salekhard, and Vorkuta [23].
The study of the demographic situation in the Russian Arctic zone was carried out using a number of methods: general scientific (comparison, generalization, modeling of the subject area), statistical (time-series analysis), demographic (calculation of natural and migration movement indicators, analysis of demographic structures) and economic and geographic (spatial analysis and mapping).
Figure 2. Population settlement in the Arctic zone of the Russian Federation at the beginning of 2021
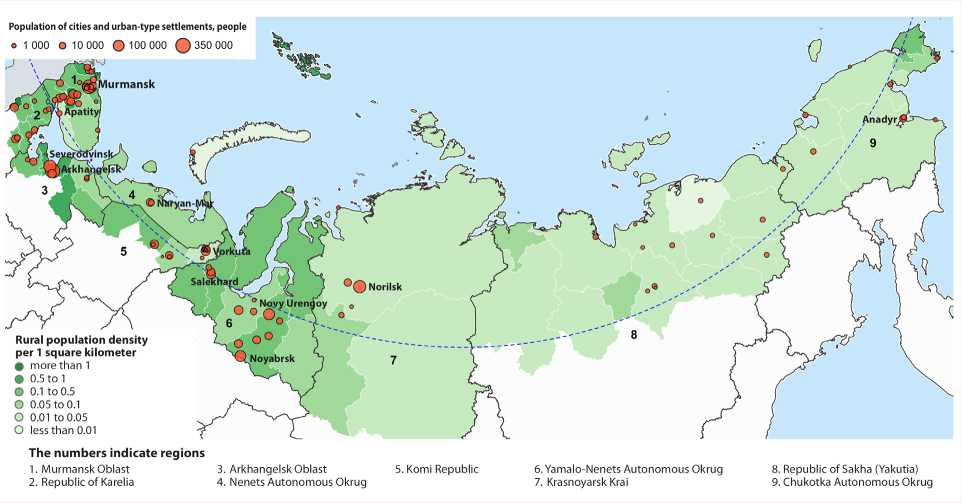
Source: compiled according to the database of indicators of municipalities. Rosstat. Available at: dbscripts/munst
The study combined traditional vital statistics with population data collected by digital platforms and services. The Rosstat Municipal Indicators Database was used to estimate indicators of natural and migration movement, as well as excess mortality in the Arctic6. Excess mortality in 2020 was estimated based on the rate of increase in the total mortality rate to the 2017–2019 average by multiplying the resulting value by the average annual population in 2020. Because of the mosaic nature of the Arctic territories, it is recommended to use indicators with the highest possible level of detalization [30], so excess mortality was calculated for individual urban okrugs and municipal districts.
The data set “Coronavirus statistics and selfisolation index” from the Yandex DataLens7 service, prepared using data from Johns Hopkins University, the website стопкоронавирус.рф, and Yandex services was used to estimate the morbidity, mortality from coronavirus, population response to the pandemic, and the degree of self-isolation of society. Data from the time of the pandemic beginning in Russia (March 2020) to the middle of September 2021 were unloaded from the service. All indicators of the base have a pronounced weekly cyclicity caused by both the mode of operation of health care facilities and the rhythm of people’s lives, so to even out the fluctuations we considered seven-day moving averages of indicators. Since the service data are available in terms of RF constituent entities, only the regions included in the entire Arctic zone of the Russian Federation (Murmansk Oblast, Nenets, Yamalo-Nenets and Chukotka autonomous okrugs) were analyzed, as well as the Arkhangelsk Oblast, the majority of whose population resides in the Arctic. The Arkhangelsk Oblast was considered with a weighting coefficient of 0.612, which corresponds to the proportion of the Arctic population in the total population of the region (excluding Nenets AO).
Four indicators of the pandemic in the Arctic zone and for Russia as a whole are considered in the dynamics: number of cases per day per 1 million people, number of deaths per day per 1 million people, number of search queries about the coronavirus per day per 1 million queries, and the index of self-isolation of cities.
Analysis of search queries was carried out according to 15 keyword phrases (markers) that users often search in conditions of self-isolation or illness: “antibodies”, “second wave”, “call an ambulance”, “home delivery”, “how not to get infected”, “buy antiseptic”, “buy a mask and respirator”, “treatment of coronavirus”, “loss of smell”, “pulse oximeter and saturation”, “take a test”, “make a CT scan”8, “symptoms of coronavirus”, “what to do at home”, “what to do if the ambulance won’t come”. Taken together, these searches allow assessing the extent of people’s interest in coronavirus infection. Increased interest, in turn, can help predict future COVID-19 outbreaks [31].
The index of self-isolation characterizes the change in the activity of users of Yandex services on the streets of cities during the pandemic. The value for the Arctic was calculated as the average for the nine largest cities in the Arctic zone of the Russian Federation: Apatity, Arkhangelsk, Vorkuta, Murmansk, Novy Urengoy, Norilsk, Noyabrsk, Severodvinsk and Severomorsk. The higher the point, the fewer people on the streets. A point of 0 corresponds to the level during the weekday rush hour before the pandemic, 5 points to the value at night9.
In order to draw conclusions about the prospects for a pandemic, it was also necessary to analyze the dynamics of vaccination of the population. We took data on the number of vaccinated people in the Arctic regions of the Russian Federation from the aggregator website gogov.ru10, and for the country as a whole from the global database11 on COVID-19 vaccination [32].
The considered indicators make up a kind of digital footprint of the pandemic, which captures its impact on people through the actions of Internet users and information posted on official Internet resources by public authorities. Calculation and mapping algorithms are implemented in Julia 1.6 programming language using DataFrames.jl, CSV. jl and VegaLite.jl packages.
Pandemic dynamics in the Russian Arctic
Epidemics, along with wars and famine in bad harvest years, are among the crisis components of population mortality. They have been constant companions of humanity throughout its history. Sometimes, but not always, in Russia, due to the low population density, the damage caused by epidemics was less than in Western Europe [33, p. 84]. In the Russian Arctic, epidemics also have their own specifics. Some features of the Arctic territories increase the damage from epidemics, while others, on the contrary, weaken it.
Because of the great remoteness of Arctic settlements [34], cases of COVID-19 infection in the Russian Arctic were registered later. However, the high concentration of population in cities and urban-type settlements contributes to a more rapid spread of diseases after the first infections. In addition, human mobility is high in most remote areas, and rotation of workers accelerates the spread of the virus [35]. Because of this, outbreaks occurred in a number of northern and arctic locations even in the early stages of the pandemic. Pandemic outbreaks among rotational workers were recorded in Belokamenka (Murmansk Oblast), at the Chayanda field (Khanty-Mansi Autonomous Okrug), in the Sabetta settlement (Yamalo-Nenets AO), the settlement of the Olimpiada plant (Krasnoyarsk Krai)12.
In cities, where the majority of the Arctic population lives, the health care infrastructure is relatively well developed, which makes it possible to provide timely assistance to those who fall ill. At the same time, hypertension, diabetes, tuberculosis, hepatitis, cardiovascular and many other diseases are more common in Arctic societies [2], which increase the risks of severe course of the disease and death of coronavirus patients. An even greater, but opposite influence on mortality rates is exerted by the age composition of the population. Comparative studies show that the main contribution to the reduction of life expectancy under the influence of the COVID-19 pandemic is made by the increased mortality of the population over the age of 60 [36]. The proportion of elderly people in the Arctic territories is lower, which reduces the final mortality rate among those infected.
We should also note that the social problems caused by the coronavirus pandemic in the Arctic are not limited to increased mortality. According to sociological studies, “among the main problems faced by the population in the conditions of the pandemic are the threat of restrictions on the activities of mining companies, travel, bans and restrictions on traditional fishing activities for the local population, job loss and reduced income, fear for one’s health and the health of loved ones” [37, p. 144].
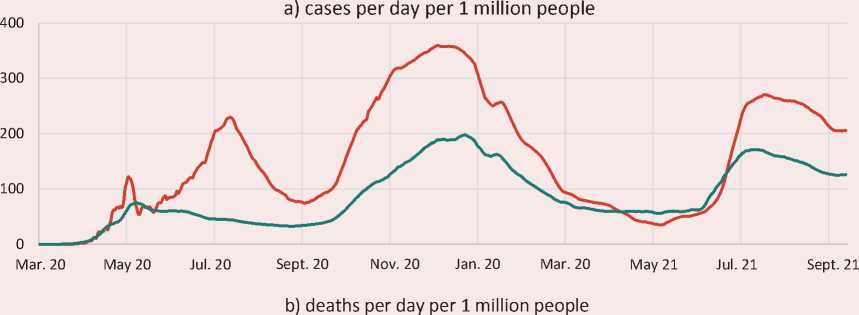
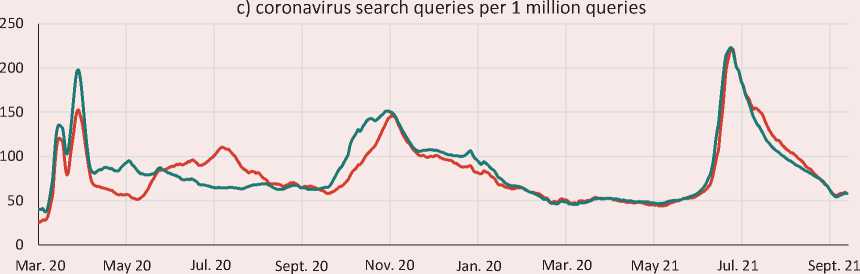
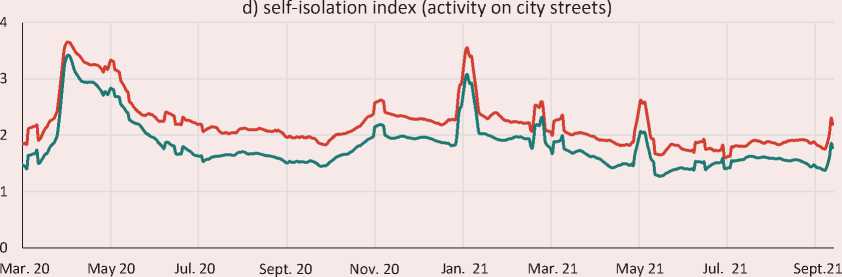
Let us consider the dynamics of four pandemic indicators in the Russian Arctic zone and Russian Federation as a whole for 2020–2021 by days (Fig. 3) . In order to describe epidemiological indicators,
Figure 3. Coronavirus pandemic statistics, 7-day moving average
Mar. 20 May 20 Jul. 20 Sept. 20 Nov. 20 Jan. 20 Mar. 20 May 21 Jul. 21 Sept. 21
Arctic regions of Russia
Russian Federation
Source: date of Yandex DataLens.
the analogy of “waves” is often used, which are characterized by clearly defined periods of growth and decline, maintained for a certain period of time [4, p. 3]. There are three distinct waves in the presented graphs. The first one lasted from the beginning of the pandemic in March 2020 to the end of August of the same year, the second – from September 2020 to April 2021, and the third – from May 2021.
Throughout most of the period considered, morbidity and mortality rates from coronavirus per 1 million inhabitants in the Arctic zone were higher than in Russia as a whole. The exceptions were the very beginning of the pandemic and April – May 2021 (see Fig. 3a). The higher rates, in addition to the factors mentioned above, may be related to the quality of statistical records in the Arctic regions. In the Arctic, most of the population lives in urban-type settlements, where the recording of diseases and deaths is better than in rural areas, and those who fall ill have more opportunities to visit medical organizations. Problems of comparability of morbidity and mortality data between countries and regions are discussed in scientific publications [38].
While the peak incidence according to official data was in the second wave of the pandemic, the peak mortality was in the third wave (see Fig. 3b). Among the five Arctic regions considered, the highest infection rates were in the Arkhangelsk (233) and Murmansk (174) oblasts, and the lowest were in Chukotka (60) and Nenets (86) autonomous okrugs. In terms of mortality, the situation is similar, only the Murmansk Oblast is in the lead. Yamalo-Nenets Autonomous Okrug takes average positions by all indicators. The leadership of the western Arctic regions can be explained primarily by their older age structure, as well as by the high population density, which contributes to the spread of the infection.
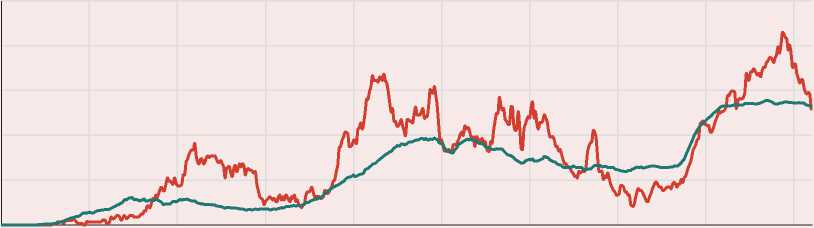
Search query data allow assessing the degree of influence of the pandemic on public sentiment (see Fig. 3c). Among the search queries considered, the most popular among Yandex users were “symptoms of coronavirus” (280 queries per 1 million queries), “get tested” (227), “antibodies” (206), “treatment for coronavirus” (125), and “loss of smell” (92). The request for loss of smell was more popular in 2020, as strains of coronavirus, which rarely cause loss of smell, became common in 2021. The dynamics of search queries for the Arctic and the country as a whole are almost the same. Search queries related to coronavirus are of greater interest to Internet users in the Murmansk and Arkhangelsk oblasts and the Yamalo-Nenets Autonomous Okrug. In Chukotka Autonomous Okrug information about coronavirus is searched for less frequently. A surge of interest in search queries about coronavirus is observed at the beginning of the infection waves: March 2020, October 2020, and June 2021. The numbers then decrease rapidly, although high incidence rates may be recorded for several more months.
According to Yandex services, the values of the self-isolation index in the Arctic were higher than the Russian average (see Fig. 3g), that is, the residents of Arctic cities have more restricted their movements. The peak of self-isolation indexes was in April–May 2020, which, on the one hand, is connected with the novelty of the threat and high uncertainty, on the other hand, with the implementation of the Presidential Decree No. 239 dated April 2, 2020, which established nonworking days with pay, suspended the activities of certain organizations and established a special procedure for the movement of persons and vehicles13.
After the end of non-working days, a slight increase in self-isolation rates was recorded during the second wave of coronavirus, but the schedule fluctuations were mostly associated with holidays. Among the Arctic cities, the self-isolation regime, according to Yandex services, was best observed by Severomorsk (2.7 points), Vorkuta, Apatity and
Severodvinsk (2.5 points each). The lowest selfisolation index was recorded in Novy Urengoy (1.6) and Arkhangelsk (1.8). In other Arctic cities, it was at the level of 2.0–2.2, while the national average was 1.8 points.
Although the digital footprint provides some insight into the nature of demographic change, the patterns identified need to be confirmed with data from traditional statistics.
Consequences of the pandemic for Arctic demographic development
In 2020, the overall decline in the population of the Russian Arctic has intensified compared to the previous year (Tab. 2). The pandemic had virtually no effect on fertility in 2020, as not enough time had passed since the pandemic began by the end of the year. Quarantine measures may have created problems with hospitalization in maternity wards, but such cases are isolated [39]. At the same time the mortality rate has significantly increased. As a result, natural increase, which had been declining but had maintained positive values over recent years, was replaced for the first time by a natural decrease in population. The negative trends were only partially offset by a decrease in migration losses in the Russian Arctic. The decrease in the absolute value of the negative migration balance was caused by the fact that the intensity of departures decreased more than the intensity of arrivals. As a result, total population growth returned to the level of 2018.
Let us estimate the value of excess mortality in the Arctic territories in 2020 (Tab. 3) . The
Table 2. Indicators of population change in the Arctic zone of the Russian Federation, 2017–2020
|
People |
Ratios per 1,000 people |
|||||||
|
2017 |
2018 |
2019 |
2020 |
2017 |
2018 |
2019 |
2020 |
|
|
Total increase |
-12,585 |
-12,066 |
-10,222 |
-11,932 |
-4.8 |
-4.6 |
-3.9 |
-4.6 |
|
Natural increase |
5,106 |
3,035 |
1,060 |
-3,575 |
1.9 |
1.2 |
0.4 |
-1.4 |
|
Born |
30,913 |
29,024 |
26,529 |
26,083 |
11.7 |
11.0 |
10.1 |
10.0 |
|
Died |
25,807 |
25,989 |
25,469 |
29,658 |
9.7 |
9.9 |
9.7 |
11.4 |
|
Positive migration balance |
-17,691 |
-15,101 |
-11,282 |
-8,357 |
-6.7 |
-5.7 |
-4.3 |
-3.2 |
|
Those who arrived |
133,910 |
137,488 |
126,124 |
109,446 |
50.6 |
52.2 |
48.1 |
41.9 |
|
Those who left |
151,601 |
152,589 |
137,406 |
117,803 |
57.3 |
57.9 |
52.4 |
45.1 |
Source: Database of indicators of municipalities. Rosstat. Available at:
Table 3. Dynamics of mortality in the Arctic zone of the Russian Federation in 2017–2020 and excess mortality in 2020
|
Territory |
Total deaths, people |
Total mortality rate per 1,000 population |
Excess mortality in 2020 to 2017–2019 levels |
||||||||
|
2017 |
2018 |
2019 |
2020 |
2017 |
2018 |
2019 |
2020 |
people |
per 1,000 people |
% |
|
|
Russian Arctic zone |
25,807 |
25,989 |
25,469 |
29,658 |
9.7 |
9.9 |
9.7 |
11.4 |
4,226 |
1.6 |
16.2 |
|
Murmansk Oblast |
8,371 |
8,463 |
8,462 |
9,951 |
11.1 |
11.3 |
11.4 |
13.5 |
1,667 |
2.3 |
20.1 |
|
Arkhangelsk Oblast excluding AO |
8,040 |
8,121 |
8,140 |
9,074 |
11.9 |
12.1 |
12.2 |
13.6 |
1,072 |
1.6 |
13.4 |
|
Yamalo-Nenets AO |
2,614 |
2,547 |
2,553 |
3,293 |
4.9 |
4.7 |
4.7 |
6.0 |
695 |
1.3 |
26.7 |
|
Republic of Karelia |
1,815 |
1,913 |
1,787 |
2,027 |
15.5 |
16.6 |
15.8 |
18.1 |
240 |
2.1 |
13.4 |
|
Komi Republic |
1,694 |
1,720 |
1,646 |
1,815 |
10.4 |
10.8 |
10.6 |
11.9 |
192 |
1.3 |
11.8 |
|
Republic of Sakha (Yakutia) |
742 |
675 |
634 |
868 |
10.9 |
9.9 |
9.4 |
12.8 |
187 |
2.8 |
27.5 |
|
Krasnoyarsk Krai |
1,686 |
1,609 |
1,413 |
1,659 |
7.2 |
6.8 |
6.0 |
7.0 |
80 |
0.3 |
5.1 |
|
Nenets AO |
378 |
394 |
380 |
449 |
8.6 |
9.0 |
8.6 |
10.1 |
62 |
1.4 |
16.1 |
|
Chukotka AO |
467 |
547 |
454 |
522 |
9.4 |
11.0 |
9.1 |
10.5 |
31 |
0.6 |
6.2 |
|
For reference: RF (thousand people) |
1,826 |
1,829 |
1,798 |
2,139 |
12.4 |
12.5 |
12.3 |
14.6 |
325 |
2.2 |
17.9 |
Source: Database of indicators of municipalities. Rosstat. Available at:
cumulative excess mortality in the Arctic zone of the Russian Federation was 4,226 people, or 16.2% increase to the 2017–2020 level, which is slightly lower than for the country as a whole (17.9%). The value below the national average can be explained by the low proportion of the population of older age groups at risk of coronavirus. Among the constituent entities of the Federation, the highest excess mortality was recorded in the Sakha Republic (27.5%) and Yamalo-Nenets Autonomous Okrug (26.7%). The lowest excess mortality was recorded in Krasnoyarsk Krai (5.1%) and Chukotka Autonomous Okrug (6.2%).
A more detailed analysis at the level of urban okrugs and municipal districts shows that high excess mortality is mainly observed in resourceproducing urban okrugs and districts of Siberia (Fig. 4). Many of them are characterized by rotational settlements and high migration turnover, which may have contributed to the rapid spread of coronavirus infection. Low values of excess mortality were recorded in some remote isolated cities (Norilsk, Anadyr) and territories with low migration mobility (Ust-Tsilemsky District of the Komi Republic, sparsely populated areas of Chukotka and the Arkhangelsk Oblast). However, analysis of international data shows that morbidity and mortality rates in such territories can quickly catch up with those of areas with earlier infections. “The delayed onset of a pandemic should be used to prepare for the inevitable emergence of the virus in more remote rural areas” [4, p. 9].
Russian Arctic territories have been characterized by high migration mobility in recent years, while the overall population loss in most cities and regions has remained unchanged [19; 40]. The impact of the pandemic on migration flows can be clearly seen in the analysis of the migration mobility of the population, i.e. the sum of those who arrived and those who left per 1,000 inhabitants (Tab. 4) . Human mobility of the Russian Arctic has decreased more than that of the Russian Federation
Figure 4. Excess mortality in cities and regions of the Russian Arctic, 2020 to the average level of 2017–2019, %
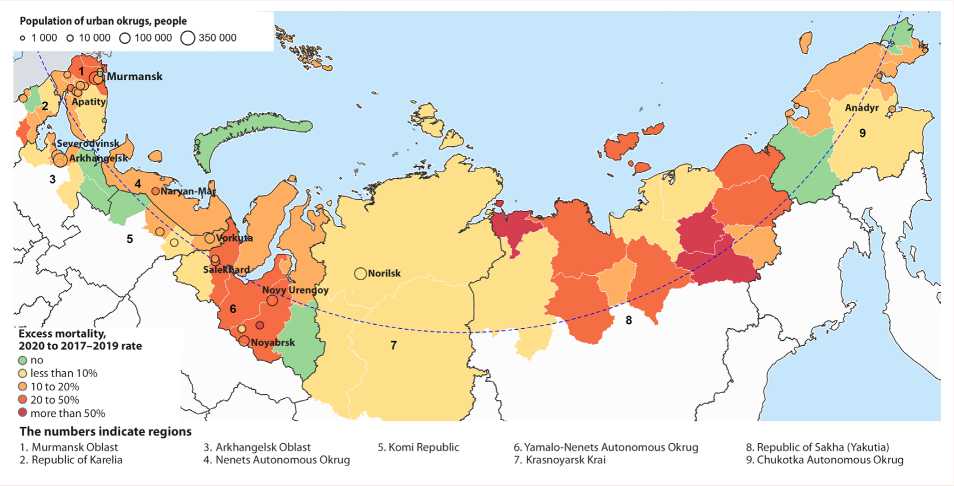
Source: compiled according to the Database of indicators of municipalities. Rosstat. Available at: dbscripts/munst
Table 4. Change in the human mobility in the Arctic zone of the Russian Federation in 2020 to the average level of 2017–2019 by constituent entities of the Russian Federation, %
|
Territory |
Total |
Type of migration |
||
|
intraregional |
interregional |
intercountry |
||
|
Russian Arctic zone |
-18.3 |
-26.9 |
-18.6 |
-7.9 |
|
Chukotka AO |
-1.6 |
11.0 |
-12.6 |
136.9 |
|
Republic of Sakha (Yakutia) |
-6.4 |
-7.7 |
-11.1 |
113.4 |
|
Krasnoyarsk Krai |
-11.5 |
-2.7 |
-15.7 |
-0.3 |
|
Komi Republic |
-15.2 |
-17.0 |
-22.7 |
56.9 |
|
Nenets AO |
-16.1 |
-22.6 |
-14.9 |
19.6 |
|
Republic of Karelia |
-18.2 |
-19.6 |
-16.8 |
-16.0 |
|
Murmansk Oblast |
-20.4 |
-43.5 |
-18.3 |
-23.4 |
|
Yamalo-Nenets AO |
-21.2 |
-17.5 |
-23.7 |
-15.6 |
|
Archangelsk Oblast excluding АО |
-23.3 |
-32.1 |
-12.9 |
-25.0 |
|
For reference: RF |
-13.4 |
-16.4 |
-15.0 |
5.3 |
Source: Database of indicators of municipalities. Rosstat. Available at:
as a whole, and the decrease has hardly affected the most remote territories: Chukotka AO, Yakutia and Norilsk, whose dependence on migration movements of labor resources is particularly high due to the extreme natural and climatic conditions. Although migration between countries became more difficult as a result of the restrictions [41], international migration mobility in Chukotka and Nenets Autonomous okrugs, as well as in the Komi and Yakutia republics, even increased. The frequency of movements decreased primarily within the region (everywhere except for Chukotka Autonomous Okrug).
Vaccination campaigns are underway to fight the pandemic on a global scale. In Russia, 32% of the population was vaccinated with at least one dose of vaccine as of mid-September 2021. By comparison, Iceland has 79% vaccinated, the Faroe Islands – 77%, Canada – 76%, Norway – 75%, Finland – 74%, Greenland – 72%, Sweden – 69%, and Alaska (USA) – 56%. Thus, Russia is inferior to all other Arctic territories. If we look broken down by Arctic region of Russia (Fig. 5), Chukotka AO stands out, with 45% of the population vaccinated. The other Arctic regions show values in the range of 28–34%. We should note that the Murmansk Oblast has a developed network of settlements associated with the functioning of the Northern Fleet of the Russian Navy. According to the Ministry of Defense of the Russian Federation, 98% of the military personnel of the Northern Fleet were vaccinated with the two-component vaccine as of October 2021, and about a quarter of the planned number have already been revaccinated14.
What is the outlook for the pandemic? In 2021, we can expect excess mortality rates comparable to or even higher than in 202015. Based on the low rates of vaccination in Russia, it is also very likely that significant excess mortality will persist in 2022. The future situation is difficult to forecast. Mortality, on the one hand, will be determined by the rate of vaccination and revaccination; on the other hand, it will depend on the appearance of new, more dangerous variants of coronavirus. The most widespread vaccine in Russia, Sputnik V,
Figure 5. Proportion of the population who received at least one component of the vaccine, by RF constituent entities, January – September 2021, %
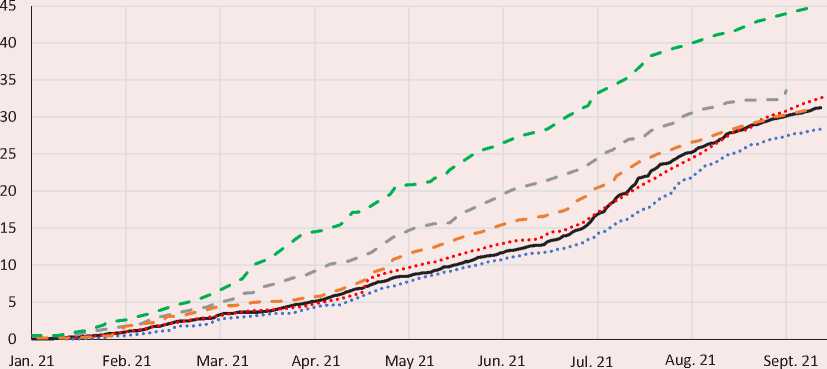
Russia Murmansk Oblast Arkhangelsk Oblast
Nenets AO Yamalo-Nenets AO Chukotka AO
has shown high efficiency in clinical trials [42] and has been approved and successfully used in almost 70 countries [43]. Other vaccines are being developed and tested, so a reduction in mortality can be expected in the long term. In the short term, nationwide, the pandemic will intensify the downward demographic dynamics that have begun again [44], and in the Russian Arctic it has already led to the replacement of natural increase by natural decrease in population in 2020.
Conclusion
The study shows that the combined use of traditional demographic statistics with new data accumulated in a digital environment allows conducting detailed and rapid analysis of the demographic situation. There is no doubt that in the future the digitalization of various spheres of human life will only intensify, enabling researchers to obtain even more data about the population. At the same time, the risks of misuse of the data and violation of privacy will increase, so the ethics of research in the digital environment will become important.
We can see that features of the Arctic territories, on the one hand, make their population more vulnerable to epidemics, on the other hand, contribute to a lower mortality rate. In 2020, excess mortality was 4.2 thousand people, which led to a natural decrease in the population of the Russian Arctic. Human mobility has been greatly reduced in most regions except for the very remote ones, where it determines the resilience of settlements. The pandemic has affected the behavior of the Arctic population, as captured by searches and the intensity of population movements on city streets. We identified the most problematic areas of the Arctic during the pandemic in terms of mortality and population vaccination rates.
The practical significance of the results obtained is that they can be used in the development of population policy measures under conditions of high uncertainty and variability of the situation. As the experience of pandemic control has shown, the effect of measures comes with a time lag, so decisions should be made quickly, as well as take into account the local specifics of territories and populations.
Further research should apply the considered approach to the formation of a demographic knowledge base for forecasting the demographic development of the Arctic zone of the Russian Federation. This will allow taking into account detailed migration routes, as well as differences in the composition of the population and economic specialization of the territories. Combined with the results of the 2021 census, the new data will make it possible to see the contours of the future settlement system of the Russian Arctic and to predict demographic trends in the coming decades.
References The impact of the pandemic on demographic processes in the Russian Arctic
- Torkunov A.V., Ryazantsev S.V., Levashov V.K. et al. Pandemiya COVID-19: Vyzovy, posledstviya, protivodeistvie [COVID-19 Pandemic: Challenges, Consequences, Countermeasures]. Moscow: Aspekt Press, 2021. 248 p.
- Spence J. et al. Covid-19 in the Arctic: Briefing document for senior Arctic officials. Senior Arctic Officials’ executive meeting, Iceland, 24–25 June 2020. Iceland: Arctic Council, 2020. 83 p.
- Petrov A.N., Welford M., Golosov N. et al. Spatiotemporal dynamics of the COVID-19 pandemic in the Arctic: Early data and emerging trends. International Journal of Circumpolar Health, 2020, vol. 79(1), pp. 1–9. DOI: 10.1080/22423982.2020.1835251
- Petrov A.N., Welford M., Golosov N. et al. The “second wave” of the COVID-19 pandemic in the Arctic: Regional and temporal dynamics, International Journal of Circumpolar Health, 2021, vol. 80(1), pp. 1–12. DOI: 10.1080/22423982.2021.1925446.
- Katzenbach C., Bächle T.C. Defining concepts of the digital society. Internet Policy Review, 2019, vol. 8 (4), pp. 1–6 DOI: 10.14763/2019.4.1430
- Smirnov A.V. Digital society: Theoretical model and Russian reality. Monitoring obshchestvennogo mneniya: ekonomicheskie i sotsial’nye peremeny=Monitoring of Public Opinion: Economic and Social Changes, 2021, no. 1, pp. 129–153. DOI: 10.14515/monitoring.2021.1.1790 (in Russian).
- Lundgren A., Randall L., Norlén G. et al. State of the Nordic Region 2020. Wellbeing, health and digitalisation edition. Copenhagen, Nordic Council of Ministers, 2020. 71 p. DOI: 10.6027/nord2020-052
- Shabunova A.A., Gruzdeva M.A., Kalachikova O.N. Settlement aspect of digital inequality in modern Russia. Problemy razvitiya territorii=Problems of Territory’s Development, 2020, no. 4, pp. 7–19. DOI: 10.15838/ptd.2020.4.108.1 (in Russian).
- Golder S.A., Macy M.W. Digital footprints: Opportunities and challenges for online social research. Annual Review of Sociology, 2014, vol. 40 (1), pp. 129–152. DOI: 10.1146/annurev-soc-071913-043145
- Billari F., Zagheni E. Big data and population processes: A revolution? In: SIS 2017. Statistics and Data Science: New Challenges, New Generations. Florence: Firenze University Press, 2017, pp. 167–178. DOI: 10.36253/978-88-6453-521-0
- Srnicek N. Kapitalizm platform [Platform Capitalism]. 2nd edition. Moscow: Izd. dom Vysshei shkoly ekonomiki, 2020. 128 p.
- Kotyrlo E. Impact of modern information and communication tools on international migration. International Migration, 2019, article number 12677, pp. 1–19. DOI: 10.1111/imig.12677
- Glushchenko G.I. Development of virtual migration in the context of the ongoing digitalization. DEMIS. Demograficheskie issledovaniya=DEMIS. Demographic Research, 2021, vol. 1, no. 2, pp. 57–64. DOI: 10.19181/demis.2021.1.2.4 (in Russian).
- Alburez-Gutierrez D., Aref S., Gil-Clavel S. et al. Demography in the Digital Era: New data sources for population research. In: SIS2019. Smart Statistics for Smart Applications. Milano: Pearson, 2019. Pp. 1–8. DOI: 10.31235/osf.io/24jp7.
- Ruggles S. Big microdata for population research. Demography, 2014, vol. 51 (1), pp. 287–297. DOI: 10.1007/s13524-013-0240-2
- Bohon S.A. Demography in the big data revolution: Changing the culture to forge new frontiers. Population Research and Policy Review, 2018, vol. 37 (3), pp. 323–341. DOI: 10.1007/s11113-018-9464-6
- Smirnov A.V. Human development and prospects for the knowledge economy formation. Arktika: ekologiya i ekonomika=Arctic: Ecology and Economy, 2020, no. 2 (38), pp. 18–30. DOI: 10.25283/2223-4594-2020-2-18-30 (in Russian).
- Dmitrieva T.E., Buryi O.V. Arctic supporting zones: the Ranks and the Projects. EKO, 2019, no. 1, pp. 41–59. DOI: 10.30680/ЕСО0131-7652-2019-1-41-59 (in Russian).
- Fauzer V.V., Smirnov A.V. Migration of the Russian arctic population: Models, routes, results. Arktika: ekologiya i ekonomika=Arctic: Ecology and Economy, 2020, no. 4 (40), pp. 4–18. DOI: 10.25283/2223-4594-2020-4-4-18 (in Russian).
- Hughes C., Zagheni E., Abel G. et al. Inferring Migrations: Traditional Methods and New Approaches Based on Mobile Phone, Social Media, and Other Big Data. Brussels: European Commission, 2016. 41 p. DOI: 10.2767/61617
- Bogdanov M.B., Smirnov I.B. Opportunities and limitations of digital traces and machine learning methods in sociology. Monitoring obshchestvennogo mneniya: ekonomicheskie i sotsial’nye peremeny=Monitoring of Public Opinion: Economic and Social Changes, 2021, no. 1, pp. 304–328. DOI: 10.14515/monitoring.2021.1.1760 (in Russian).
- Zamyatina N., Yashunsky A. Migration cycles, social capital and networks. A new way to look at Arctic mobility. In: New Mobilities and Social Changes in Russia’s Arctic Regions. London and New York: Routledge, 2017. Pp. 59–84. DOI: 10.4324/9781315640471
- Smirnov A.V. The Arctic population: Dynamics and centers of the settlement system. Arktika i Sever=Arctic and North, 2020, no. 40, pp. 270–290. DOI: 10.37482/issn2221-2698.2020.40.270 (in Russia).
- Skuf’ina T.P., Baranov S.V. Specific of population’s consumption: The trail of arctic residents in Sberbank big data. Problemy razvitiya territorii=Problems of Territory’s Development, 2020, no. 6(110), pp. 21–34. DOI: 10.15838/ptd.2020.6.110.2 (in Russia).
- Lazer D., Radford J. Data ex Machina: Introduction to big data. Annual Review of Sociology, 2017, vol. 43(1), pp. 19–39. DOI: 10.1146/annurev-soc-060116-053457
- Kitchin R. Big Data, new epistemologies and paradigm shifts. Big Data & Society, 2014, vol. 1(1), pp. 1–12. DOI: 10.1177/2053951714528481
- Zamyatina N.Yu., Pilyasov A.N. Rossiiskaya Arktika: K novomu ponimaniyu protsessov osvoeniya [The Russian Arctic: Toward a New Understanding of Development Processes]. Moscow: LENAND, 2018. 400 p.
- Leksin V.N. Systemic causes and consequences of spatially mediated depopulation. Region: ekonomika i sotsiologiya=Region: Economics and Sociology, 2021, no. 2(110), pp. 101–134. DOI: 10.15372/REG20210205 (in Russian).
- Fauzer V.V., Lytkina T.S., Fauzer G.N. Features of population settlement in the arctic zone of Russia. Arktika: ekologiya i ekonomika=Arctic: Ecology and Economy, 2016, no. 2 (22), pp. 40–50 (in Russian).
- Stjernberg M., Penje O. Population Change Dynamics in Nordic Municipalities – Grid Data as a Tool for Studying Residential Change at Local Level. Stockholm: Nordregio, 2019. 44 p. DOI: 10.30689/R2019:1.1403-2503
- Ahmad I., Flanagan R., Staller K. Increased internet search interest for GI symptoms may predict COVID-19 cases in US hotspots. Clinical Gastroenterology and Hepatology, 2020, vol. 18, issue 12, pp. 2833–2834. DOI: 10.1016/j.cgh.2020.06.058
- Mathieu E., Ritchie H., Ortiz-Ospina E. et al. A global database of COVID-19 vaccinations. Nature Human Behaviour, 2021, vol. 5, pp. 947–953. DOI: 10.1038/s41562-021-01122-8
- Vishnevskii A.G. Demograficheskaya istoriya i demograficheskaya teoriya [Demographic History and Demographic Theory]. Moscow: Izd. dom Vysshei shkoly ekonomiki, 2019. 368 p.
- Jungsberg L., Turunen E., Heleniak T. et al. Atlas of Population, Society and Economy in the Arctic. Stockholm: Nordregio, 2019. 80 p. DOI: 10.30689/WP2019:3.1403-2511.
- Zamyatina N.Yu., Pilyasov A.N. A new interdisciplinary area of study: Arctic regional science. Region: ekonomika i sotsiologiya=Region: Ekonomika i Sotsiologiya, 2017, no. 3(95), pp. 3–30. DOI: 10.15372/REG20170301 (in Russian).
- Aburto J.M., Schöley J., Kashnitsky I. et al. Quantifying impacts of the COVID-19 pandemic through life-expectancy losses: A population-level study of 29 countries. International Journal of Epidemiology, 2021, pp. 1–12. DOI: 10.1093/ije/dyab207
- Sleptsov A.N., Potravnaya E.V. Impact of the coronavirus pandemic on the life of Arctic regions in population estimates. Sotsiologicheskie issledovaniya=Sociological Studies, 2020, no. 7, pp. 144–147. DOI: 10.31857/S013216250009621-6 (in Russian).
- Danilova I.A. Morbidity and mortality from COVID-19. The problem of data comparability. Demograficheskoe obozrenie=Demographic Review, 2020, no. 7 (1), pp. 6–26. DOI: 10.17323/demreview.v7i1.10818 (in Russian).
- Shabunova A.A., Natsun L.N. Children of the pandemic: Health of infants born in 2020. Sotsial’noe prostranstvo=Social Area, 2020, vol. 6, no. 5. DOI: 10.15838/sa.2020.5.27.1 (in Russian).
- Fauzer V.V., Lytkina T.S. Migration processes in the Russian North. Sotsial’naya politika i sotsiologiya=Social Policy and Sociology, 2017, vol. 16, no. 1(120), pp. 141–149. DOI: 10.17922/2071-3665-2017-16-1-141-149 (in Russian).
- Ryazantsev S. V., Molodikova I. N., Bragin A. D. The effect of Covid-19 on labour migration in the CIS. Baltiiskii region=Baltijskij Region, 2020, vol. 12, no. 4, pp. 10–38. DOI: 10.5922/2079-8555-2020-3-2 (in Russian).
- Logunov D. et al. Safety and efficacy of an rAd26 and rAd5 vector-based heterologous prime-boost COVID-19 vaccine: An interim analysis of a randomised controlled phase 3 trial in Russia. The Lancet, 2021, vol. 397 (10275), pp. 671–681. DOI: 10.1016/S0140-6736(21)00234-8
- Nogrady B. Mounting evidence suggests Sputnik COVID vaccine is safe and effective. Nature, 2021, vol. 595, pp. 339–340. DOI: 10.1038/d41586-021-01813-2
- Rybakovskii L.L., Savinkov V.I., Kozhevnikova N.I. Features of demographic development in Russia: Past, present, future. Sotsial’no-trudovye issledovaniya=Social and Labor Research, 2021, no. 43(2), pp. 132–143. DOI: 10.34022/2658-3712-2021-43-2-132-143
