The impact of tourism revenues on investment

Author: Ashurov B.I., Nematulloev N.N., Burkhonov B.B.
Journal: Экономика и социум @ekonomika-socium
Section: Основной раздел
Article in issue: 4-1 (83), 2021.
Free access
The study examines the impact of domestic tourism on capital investment and the increase in income of the population through investment in tourism, the socio-demographics of the local population and public relations to their impact on tourism (economic, environmental and socio-cultural impacts). examines whether it can be confidential and whether it affects their satisfaction with local tourism management.The results of a survey among the local population assessed the relationship to tourism and the requirements of domestic tour packages.
Tourist demand, perceptions of the population, socio-demographic characteristics
Short address: https://sciup.org/140259132
IDR: 140259132 | UDC: 338.48
Text of the scientific article The impact of tourism revenues on investment
Several studies have shown that the population’s perception of tourism explores the importance of socio-demographic characteristics, particularly gender and habitat, in socio-cultural, economic and environmental influences. This article will help by studying the satisfaction of tourism with local management and identifying the impact of the impact of tourism on their satisfaction.
Tourism is considered an important source of income for many countries around the world. The tourism sector produced 10.4 percent of world GDP and provided 319 million jobs in 2018 (WTTC, 2019). These figures show how important tourism is for the world economy. It is seen not only as a global business, but also as an important source of income for vulnerable segments of society, such as women, the disabled, and others. The locals have little idea of tourism. In addition, although a lot of research has been done on archeological sites in Samarkand, Bukhara and Khorezm regions, little research has been done to study how the population perceives the impact of tourism. This study was conducted to meet the need to analyze the perception of the population of Samarkand, Bukhara and Khorezm regions in relation to tourism leaders. In our view, this study aims to educate tourism leaders on the importance of managing the impact of tourism on the local community and the impact on the local community in creating a healthy environment and clarifying the important factors that support sustainable tourism development.
Literature review
Ribeiro, MA; Pinto, P .; Silva, JA; Woosnam explains the attitudes of KM residents and the perception of tourist behavior in the example of developing countries. (2017)
Ko, DW; Stewart, WP Concepts are presented through a model of the structural equation of the population's attitude to the development of tourism (2002)
Jurovskiy, C .; Gursoy, D. The results of remote effects on the attitude of the population to tourism are studied. (2004)
Vargas-Sanches, A .; Porras-Bueno, N .; de los Ángeles Plaza-Mejía, M. A study of the population's attitude to tourism and the season (2014)
Mustafoyev, G.S. (2020) The role of domestic tourism in women’s employment and its impact on capital investment has been studied
Methodology
Sampling and data collection. The impact of population perceptions on tourism can be analyzed using hypotheses based on the following factors.
Community consolidation
H 1a . There is a positive correlation between the level of engagement and the impact of tourism on tourism.
H 1b . There is a positive correlation between the level of involvement and the perceived negative impact of tourism.
Distance from tourist area
H 2a . There is a negative correlation between distance from tourist zones and the positive tourism impact received.
H 2b . There is a positive correlation between the distance from tourist zones and the perceived tourism effects.
Gender
H 3a . Women are less optimistic about the positive impact of tourism than men.
H 3b . Women are more concerned about the negative impact of tourism than men.
Age
H 4b . There is a negative correlation between the age of tourism and the perceived negative impact.
Tourism-related jobs
H 5a . Residents engaged in tourism-related activities are more likely to experience a positive tourism impact.
H 5b . Residents engaged in tourism-related activities are less likely to experience the effects of tourism.
Level of education
H 6a . There is a positive correlation between the level of education and the perceived positive impact of tourism.
H 6b . There is a positive correlation between the level of education and the perceived negative impact of tourism.
Satisfaction with local governance.
H 7 . The benefits of tourism development have a positive impact on local government satisfaction.
H 8 . Tourism development costs have a negative impact on local government satisfaction.
Data on the attitude of the population to tourism were collected from the population of Samarkand, Bukhara and Khorezm regions, who were at least 18 years old. After reviewing the previously mentioned literature and participating in the Code of Ethics and Practice established by the American Public Opinion Research Association [1,3,5], a questionnaire was developed. Data collection was done via telegram messenger, email address and similar social networks.
Research factor analysis (type R) with analysis of the main components replaced by varimax was used to form a general understanding of the population in relation to different effects. Assumptions on factor analysis are not broken. The Kaiser-Meyer-Olkin statistic is 0.816, which exceeds the recommended threshold value of 0.06 [1, 4.6], and it is convenient to analyze the correlation factors between these elements. The data show that Bartlett's Sphericity test is important (approximately chi-square = 4649.167, df = 300, p <0.001). Items with a coefficient value less than 0.4 were deleted. A determined (regression) method was used to calculate the score of each factor. This method maximizes validity and gives true factor scores [1,5,8]. These scores were then used as related variables in a regression analysis to test the effect of several independent variables on residents ’perceptions. Accordingly, after several studies, five[1.3.8.9] pure models were produced from the data. The specific values of the factors are greater than one and account for 56.464% of the total variance of the data.
We created a five-question questionnaire among the population of Samarkand, Bukhara and Khorezm regions, which was used to assess the attitude of the population to tourism.
|
Models |
Items |
Factor Loading |
Mean |
SD |
|
PSC |
2.92 |
|||
|
α (0.732) e (6.200) VE (24.800) |
Tourism provides entertainment opportunities for the local community |
0.757 |
2.76 |
1.408 |
|
Tourism helps to creates more local associations |
0.584 |
2.83 |
1.229 |
|
|
Tourism helps to improve the government provided facilities (Health centres, better schools, post office, sport centres, etc.) |
0.656 |
2.96 |
1.351 |
|
|
Tourism helps to preserve local traditions |
0.663 |
2.74 |
1.363 |
|
|
PEn |
3.02 |
|||
|
α (0.730) e (3.220) VE (12.879) |
Tourism helps to protect the environment |
0.736 |
3.07 |
1.243 |
|
Tourism help to creates more natural parks |
0.549 |
2.91 |
1.290 |
|
|
Tourism encourages people to protect surrounding environment |
0.704 |
2.99 |
1.269 |
|
|
Tourism helps to keep my village\city clean |
0.784 |
3.11 |
1.278 |
|
|
PE |
2.92 |
|||
|
α (0.819) e (1.834) VE (7.335) |
Tourism increases my family incomes |
0.544 |
2.47 |
1.249 |
|
Tourism creates better public transportation infrastructure |
0.674 |
2.82 |
1.308 |
|
|
Tourism helps to build more roads |
0.802 |
2.93 |
1.267 |
|
|
Tourism helps to creates business |
0.805 |
3.15 |
1.325 |
|
|
Tourism helps to creates more jobs |
0.725 |
3.22 |
1.379 |
|
|
NSEn |
2.93 |
|||
|
α (0.809) e (1.447) VE (5.789) |
Tourism increases the uses of alcohol |
0.598 |
3.34 |
1.413 |
|
Tourism increases the amount of crime |
0.756 |
2.76 |
1.373 |
|
|
Tourism reduces my outdoor recreation |
0.643 |
2.61 |
1.207 |
|
|
Tourism makes crowding of public spaces and facilities |
0.549 |
2.99 |
1.216 |
|
|
Tourism hazards the citizen rights by using the lands and properties to create more hotels and borders from national parks |
0.594 |
3.06 |
1.283 |
|
|
Tourism creates more social needs |
0.595 |
2.87 |
1.175 |
|
|
Models |
Items |
Factor Loading |
Mean |
SD |
|
Tourism negatively affects the family relationships |
0.498 |
2.78 |
1.211 |
|
|
Tourism increases pollution (noise, air, etc.) |
0.596 |
3.12 |
1.304 |
|
|
Tourism hazard the natural landscape |
0.542 |
3.21 |
1.378 |
|
|
NE |
3.08 |
|||
|
α (0.829) e (1.415) VE (5.661) |
Tourism increases the price of properties |
0.845 |
3.40 |
1.393 |
|
Tourism increases the cost of living |
0.804 |
3.51 |
1.343 |
|
|
Tourism generates seasonal unemployment |
0.665 |
3.53 |
1.390 |
|
Kaiser-Meyer-Olkin Measure of Sampling Adequacy = 0.816; total variance explained data = 56.464%; α: Cronbach’s Alpha; e: Eigenvalues; VE: percentage of variance explained.
Factor loads for the derived models and Cronbach’s Alpha are shown, [1,4,7,8] i.e. Model 1: Positive Socio cultural (PSC); Model 2: Positive environment (PEn); Model 3: Positive Economics (PE); Model 4: Negative social environment (NSEn); Model 5: Negative economic (NE). Five models derived from factor analysis were then tested for reliability. The values of Kronbach’s Alpha coefficient obtained from this study range from 0.730 to 0.829, indicating a high correlation with their variable factors and the presence of internal compatibility of the substances. Examination of the correlation matrix shows that no correlation between factors is greater than 0.50.
We thought[1.9] it would be possible to include five models in the list of dependent variables and use the following independent variables (attachment, gender, place of residence, age, employed, education level). The average score was calculated based on the average scores of the public attachment elements to create a variable score.
Results
The results of the GLM model show that all five models are significant [1,2,3,5] (p <0.01) (6.3% of the units), explaining the change (pencil 10.6%),
(PE 14%) , (NSEn 8.6%), and (7.7% of SH). Linear regression was used to examine whether the concept models affect population satisfaction. The model was significant (F = 39.524; p = 0.000) and explained 30% of the change. The positive economic impact was the strongest predictor of satisfaction (b = 0.307), followed by a positive environment (d = 0.243) and a positive socio-cultural model (ph = 0.196). It was found that negatively perceived effects were not an important predictor of population satisfaction.
|
DV |
IV |
B |
Hypothesis |
Supported? |
|
PSC |
||||
|
a R2 0.064 R2 adjusted 0.0479 F 4.289 |
Distance |
0.240 *** |
H2a |
yes |
|
Education |
0.120 ** |
H6a |
yes |
|
|
Attachment |
0.071 * |
H1a |
yes |
|
|
T-employed |
–0.500 ** |
H5a |
no |
|
|
PEn |
||||
|
R2 0.107 R 2 adjusted 0.094 F 7.856 |
Distance |
0.211 *** |
H2a |
yes |
|
Attachment |
0.340 *** |
H1a |
yes |
|
|
T-employed |
–0.587 ** |
H5a |
no |
|
|
Age |
0.082 * |
H4a |
yes |
|
|
PE |
||||
|
R2 0.139 R 2 adjusted 0.126 F 10.721 |
Distance |
0.191 *** |
H2a |
yes |
|
Age |
–0.079 ** |
H4a |
no |
|
|
Gender |
–0.675 *** |
H3a |
yes |
|
|
NSEn |
||||
|
R2 0.091 R2 adjusted 0.162 F 6.201 |
T-employed |
0.340 * |
H5b |
no |
|
Distance |
0.345 *** |
H2b |
no |
|
|
Education |
0.152 ** |
H6b |
yes |
|
|
Gender |
–0.462 ** |
H3b |
no |
|
|
NE |
||||
|
R2 0.079 R 2 adjusted 0.065 F 5.493 |
Education |
0.091 * |
H6b |
yes |
|
Attachment |
0.171 *** |
H1b |
yes |
|
|
Perceptions IV → Satisfaction DV (0.300 ***) a |
|||||
|
Hypothesis |
H7 (Supported) |
H8 (Rejected) |
|||
|
Domains |
PSC (0.196 ***) b |
Pen (0.243 ***) |
PE (0.307 ***) |
NSEn (– 0.076) |
NE (–0.073) |
|
VIF |
1.438 |
1.254 |
1.427 |
1.381 |
1.540 |
Hypothesis 1, if there is a higher level of connectivity, the perceived negative and positive effects increase. This hypothesis was supported in terms of negative economic effects (b = 0.150, p <0.01); positive socio-cultural (b = 0.064, p <0.1); and a positive environment (ph = 0.230, p <0.01). Hypothesis 2 hypothesizes that the farther away the population lives from the tourist zone, the more they are concerned about the negative effects [4,3] and the less they like the positive effects. The results of the PE model support the H3a hypothesis (b = -0.565, p <0.01) Conversely, the NSEn results (b = -0.355, p = 0.003) reject the H3b hypothesis.
Hypothesis 4a was supported by the results of the PEn model (b = 0.076, p <0.1). It was predicted that the older the participant, the more negative they would perceive the positive tourism impact. Furthermore, in terms of the PE model, it was rejected (d = -0.086, p <0.05). There are no significant findings in negative areas.Tourism-related work is expected to have a positive impact on tourism. Thus, H5a was rejected in terms of PSC (b = -0.400, p <0.05) and PEn (p = -0.491, p <0.05). H5b was also rejected with NSEn results (b = 0.280, p <0.1). According to Hypothesis 6, the higher the level of knowledge of the population, the higher the perception of negative and positive effects. H6a was supported during the PSC (b = 0.116, p <0.05) period, and H6b was supported by the NE (b = 0.089, p <0.1) and NSEn (b = 0.135, p <0.05) results. In addition, Hypothesis 7 assumes that the acceptable benefits of tourism will have a positive effect on the satisfaction of the population with local government. This hypothesis was supported by PSC (b = 0.196, p <0.01), Pen (b = 0.243, p <0.01), and pe (b = 0.307, p <0.01). Finally, Hypothesis 8 suggests that once the population understands the costs of tourism development, their dissatisfaction with local management [2,3] becomes clear. This hypothesis was rejected.
As an example of the results [1,3,9], the b value of the sex in the PE area (regression coefficient) can be deduced from this, women receive less positive economic effects than men, and the average score is 0.565. Similarly, the value of age b in the PEn model shows that as the age group increases (e.g., 25–34 to 35–44), the positive effect on the environment increases by 0.076.
In general,[1.4.5] the results give an idea of the impact of the population on tourism in Samarkand, Bukhara and Khorezm regions. Regardless of the theoretical support of the results of the hypotheses, the addition was found to have the highest regression coefficient in the positive environment, the distance in the negative social environment, and the highest age in the positive economic field. those who are employed in the tourism industry (those who are employed) have the highest level in a positive environment.
Capital investments-internal tourism consumption interdependence
To evaluate empirical[9] dependence of investments on internal tourism consumption we used Keynesian model of income determination:
Ct = a0 + аг Yt +ut, 0 < «j < 1(2)
Yt = Ct + It(3)
Where
Cf. —internal tourism consumption;
Yt —internal tourism income;
ut — error term;
If. investment expenditure;
If we substitute (2) into (3) we get: К = п0 + n^ + wt(4)
where n0 =
«0
1 — «!
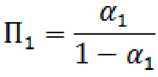
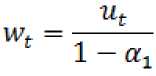
whichare short-run [9]multipliers (Gujarati D, Porter D., 2009, p.691).
Now we can estimate (4) using the OLS(ordinary least squares regression). Using MS Excel we obtained the following results(Table No.3):
Table No. 3
Statistical parameters. Capital investments-internal tourism consumption relationship1.
|
R squared |
Coefficients |
Standard error |
t-statistics |
P-value |
|
|
Intercept |
0,04 |
0,021 |
2,09 |
0,051 |
|
|
Capital investment on tourism and travel in billion US dollars |
0,92 |
3,22 |
0,20 |
15,39 |
0,000 |
As we can[9] see in table 3, both intercept and the independent variable are significant ( p valuesare close to zero), as well as capital investments explain 92% of change(R squared) in the tourism consumption, which is very significant. So, according to table 3, a 1 million US dollar increase in capital investments leads to an immediate increase of 3,22 million US dollars in internal tourism consumption in Uzbekistan. In turn, according to equation (1), this will trigger 129 percentage points increment in female employment. In brief, investing in tourism indirectly supports the rise of female employment.
Tourism is also important for personality development. Yurcu G. et al (2017) demonstrated that leisure motivation positively affected the personality traits and social wellbeing of students engaged in tourism. In this regard, tourism is not only important as a source of income for society, but alsoa key tool to enrich the social wellbeing.
Conclusion and discussion.
This study provides a broad understanding of the attitude and satisfaction of the population with the development of tourism in Samarkand, Bukhara and Khorezm regions. The main contribution of this study is the study of local satisfaction, employment of women through the development of domestic tourism. In addition, it reflects the profile of the impact of various external factors and internal factors on the types of tourist influences (economic, sociocultural and environmental) that are perceived differently, which contributes to current knowledge and understanding of the population's attitude to tourism development The results of the study show that more attention should be paid to the concepts of the local population, women should be involved in the industry and the population should be involved in tourism planning. Ways to increase employment and increase incomes by investing in tourism have been studied. . Future research should explore supporting sustainable tourism development and community participation in decision-making.
In our view, tourism is an area where women and other vulnerable groups are more equal than in other sectors. In addition, the sector plays an important role in personal social well-being and cultural integration. In this regard, it is possible to increase the welfare of the population by considering tourism as a means of social transformation, attracting foreign and domestic investment.
References The impact of tourism revenues on investment
- Alrwajfah M.M., Garcia F.A., Cortes-Marcias R. (2020) Females' perspective on tourism's impact and their employment in the sector: The case of Petra, Jordan. Sustainable Tourism and Hospitality Management. 11 (7), DOI: 10.3390/su11071907
- Ribeyro, MA; Pinto, P.; Silva, JA; Woosnam explains the attitudes of KM residents and the perception of tourist behavior in the example of developing countries. (2017)
- Ko, DW; Stewart, WP Concepts are presented through a model of the structural equation of the population's attitude to the development of tourism (2002)
- Jurovskiy, C.; Gursoy, D. The results of remote effects on the attitude of the population to tourism are studied. (2004)
- Madrigal, R. The concepts of tourism in cities are covered. (1993)
- Gursoy, D.; Chi, CG; Dyer, P. The attitude of the local population to mass and alternative tourism was studied. (2010)
- Vargas-Sanches, A.; Porras-Bueno, N.; de los Angeles Plaza-Mejia, M.A. study of the population's attitude to tourism and the season (2014)
- Sharma, B.; Dyer, P. Explains the perception of the population in relation to tourism and their impact on tourism. (2009)
- Mustafoyev, G.S. (2020) "THE IMPACT OF INTERNAL TOURISM CONSUMPTION ON FEMALE EMPLOYMENT, AND TOURISM DEMAND ANALYSIS (CASE OF UZBEKISTAN)", Economics and Innovative Technologies: Vol. 2020: No. 3, Article 3.
