The Implementation of 3D Scene Walkthrough in Air Pollution Visualization

Author: Shigang Wang, Weitao Li
Journal: International Journal of Information Engineering and Electronic Business(IJIEEB) @ijieeb
Article in issue: 1 vol.2, 2010.
Free access
We present a practical and novel approach to implement 3D scene walkthrough for air pollution visualization. This approach includes volume rendering and clipping methods, which are used to visualize large-scale air pollution data. A new viewpoint-based volume clipping method is used while rendering, which is fast and more interactive than previous methods. We achieved expected experimental results and our research could benefit environment monitoring and many other applications associated with pollution visualization.
Pollution visualization, volume rendering, volume clipping, 3D scene walkthrough
Short address: https://sciup.org/15013047
IDR: 15013047
Text of the scientific article The Implementation of 3D Scene Walkthrough in Air Pollution Visualization
Published Online November 2010 in MECS
In recent decades, both the government and environmentalists have paid much attention to air pollution control and environment monitoring. Visualization of weather data makes air quality monitoring intuitive, and helps people to make decisions or forecast pollution more easily. 2D display of scientific data can no longer satisfy the increasing requirement on realistic and immersive observation of large-scale data sets. Instead, with great development in graphics processing units, rendering scientific data in 3D has become more and more popular. However, scientific data visualization in 3D is much more complex, especially when the input data sets are large-scale. Consequently, interactive rendering of large-scale data has been one of the research focuses in scientific data visualization.
With the developments of virtual reality, people have paid more and more attention on virtual 3D rendering. Virtual 3D rendering has been widely used in game industry and other high-tech affairs. However, virtual 3D rendering haven't been introduced to many important public service fields. Air pollution monitoring is very crucial for cities, yet most air quality monitoring departments in china still use 2D methods to display meteorological data, which isn't intuitive at all and is lack of interaction. Visualization of meteorological data that allows 3D scene walkthrough could change this situation and achieve high accuracy of rendering at the same time.
There are many methods for air pollution visualization. In this paper, we choose to take advantage of direct volume rendering where each point in space is assigned a density for the emission and absorption of light and the volume renderer computes the light reaching the eye along viewing rays [1, 2]. Direct volume rendering is an attractive technique because it can convey a great deal of information in a single image by mapping the scalar data values in a sample volume to color and opacity [3]. It is especially suitable as we use large static data sets for rendering.
Volume clipping most apparently shows the three dimensionality and volumetric property of volume. It cuts away selected parts of a volume and uncovers important parts or details we should see as the viewpoint changes. Most clipping methods are depth-based or importance-driven; however, there are few specific and fast clipping methods for 3D scene walkthrough in a volume.
In this paper, we concentrate on visualizing 3D weather data through direct volume rendering, and solve the rendering problem inside the volume with a novel clipping method. The weather data are provided by the Meteorological Department of Jinan and have been preinterpolated to get a smoother display. We first load air pollution data into a visualization platform, and generate a volumetric cube which covers the whole data set. By combining texture-base volume rendering and viewpoint based volume clipping, we proposed a fast and practical method to visualize large-scale air pollution data and integrated it into our visualization platform which can be used for 3D scene walkthrough.
The main contributions of this paper are as follows:
-
1. We generate an effective method to map discrete density values of points in a volume on to values in the range between 0.0 and 1.0 such that the system can display values out of the range.
-
2. We generate a novel volume clipping method based on viewpoint for 3D scene walkthrough. We create a new 3D texture as a container for the volume with different sizes according to transformations of viewpoint, and avoid changing the volumetric data. Viewer could always see the volume part in front of his viewpoint.
Structure of the remaining parts of this paper is as follows. We reviews related work on fluid visualization and volume rendering in section II. Section III overviews the whole system, shows how the air quality visualization platform works and how the volume being rendered. Then we describe how the volume clipping happens in detail in section IV. In section V we present results of this experiment and discuss the advantages and disadvantages of our visualization of air pollution. We provide a brief conclusion and an outlook on future work in section VI.
-
II. RELATED WORK
Too much attention has been paid on air pollution simulation, and there are not plenty of good methods for air pollution data rendering, especially for real-time volume clipping in 3D scene walkthrough. This rendering platform applied in our system takes advantage of a program focusing on computational fluid dynamics (CFD) provided by Quentin Froemke and some other scientists [4], where ray casting is used for direct volume rendering to get a nice and visual representation of fluid. Although this program concentrates on multi-thread fluid simulation, it provides a good structure for direct volume rendering. In this paper, we improve the above mentioned rendering platform to make it more suitable for air pollutant rendering, and propose an efficient method for loading large scale static data. Fig.1 shows how the CFD platform working, this platform simulates the diffusion of air pollution.
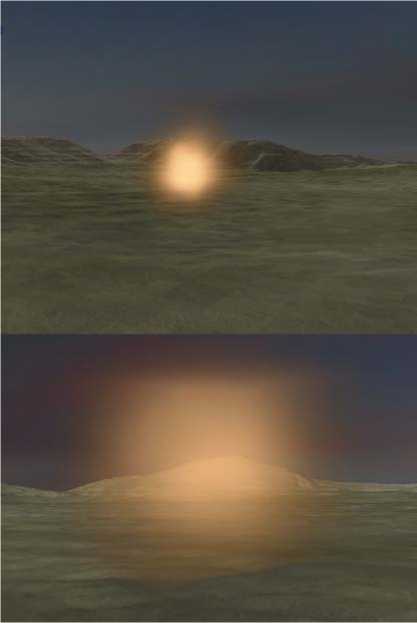
Figure 1. The volume cube being rendered in the 3D environment. View from top side.
Most previous clipping methods employ plane or combination of planes to clip volume. Although they are generally fast, the clipping results are coarse. Instead, we employ changing 3D textures for clipping, and get much better results without reducing clipping speed.
Daniel Weiskopf introduces two basic approaches to volume clipping [5]. The first one is depth-based and uses the depth structure of the clip object to clip. In the second one, a clip object is voxelized and represented by an additional volume data set. Clip regions are specified by marking corresponding voxels in this volume. Both approaches have some problems for 3D scene walkthrough, and we employ viewpoint-based volume clipping to solve them.
III SYSTEM OVERVIEW
This system is a visualization platform and can load static weather data, and can display 3D visualization effect of the data. It can be divided into two parts logically, the visualization platform part and the volume rendering part:
-
A. Visualization Platform
This platform is based on DirectX 3D which plays a crucial role in visualization and game developing. It provides a nice camera system so that the scene can automatically adjust while the viewpoint and the view direction changing. The transformation is interactive and accurate, which is important and necessary in 3D scene walkthrough.
The main function of this platform is to load air pollution data and provide basic support for volume rendering. Besides, this platform provides interface to load terrain. Terrain with information of height and texture could make the visualization more realistic. And as our research carrying on, we could load real terrain of city to show how the air pollution influencing the city clearly and intuitive.
We use a simple method to read the weather data into a data array, and record the maximum and minimum pollution densities, and then calculate the density range for later usage. An Array3D structure that is actually a 1D array is used to load 3D weather data [4]. This structure can help us visit density of each point in the volume by index and make the rendering go on smoothly.
The source density values range from a very small value such as 0.00000001 to a much larger value such as 7.7850485, which can’t be displayed by the platform. So we generate a brief mapping method to transform these values into values range from 0.0 to 1.0 so the platform can render the volume with these values successfully. We map source density value dsource into final density value d final , and dmin is the minimum source value recorded and range is the range of the source density values. The mapping formula is as follows:
d final =
d source
^^^^H
d min
range
-
B. Volume Rendering
Direct volume rendering is based on the premise that the data values in a volume are themselves a sufficient basis for creating an informative image. What makes this possible is a mapping from the numbers which comprise volume data to the optical properties such as opacity and color that compose a direct volume rendered image. This critical role is performed by Transfer Functions. Our proposed approach can be classified as a data-driven method. We propose such a method to automatically visualize volume data, providing the user a visual overview of a volume[6].
After loading data successfully, we get to the step of volume rendering. This program uses ray casting method to implement direct volume rendering, which is texturebased. After successfully loaded, the volumetric data is copied into a 3D texture, which is used in a pixel shader [4]. The texture is rendered as a cube at the position of the volume in the 3D scene. For each visible pixel, a ray is cast from the camera to this pixel on the cube. The corresponding point in the 3D texture is found and sampled and the ray marches through the texture at a fixed step size, accumulating the density data as it goes.
We create a 3D texture as a container for the volume and initialize it with the volume size and volumetric data, then the system renders the texture and the volume rendering implemented. Fig.2 and Fig.3 shows the volumetric cube being rendered while the system is running. The bright yellow air masses are air pollution areas, and the color of the pollution area is deeper as the pollution is more serious. The background bellow is the terrain picture of Jinan city. As we mainly focus on the visualization of pollution, we just take a plain map of Jinan as the background.
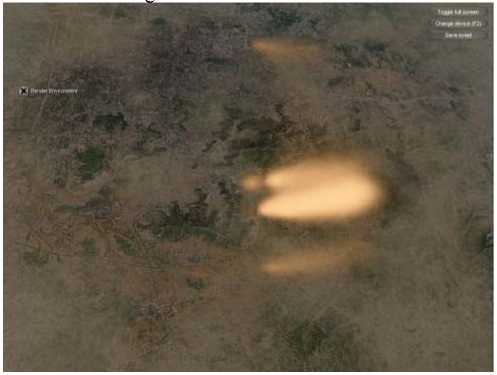
Figure 2. The volume cube being rendered in the 3D environment. View from top side.
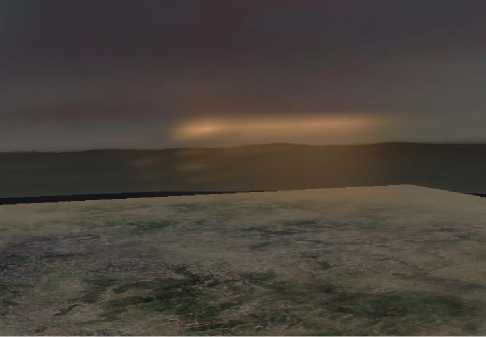
Figure 3. The volume cube being rendered in the 3D environment. View from front side.
-
C. Terrain Rendering
Terrain geometry is an important component of outdoor graphics environments, as used for instance in movies, virtual environments, cartography, and games[7]. Height field terrain rendering and editing is an important aspect of GIS, outdoor virtual reality applications such as flight simulators and 3D-games. Such scenes may contain thousands of polygons and although modern graphics cards allow the display of many thousands of polygons at real-time frame rates, many applications have models with geometric complexities that, by far, exceed the realtime capabilities[8]. In this part, we implement the realtime rendering of terrain height-fields.
When rendering terrains that utilize high resolution texture maps, texture memory management can quickly become the performance bottleneck. We present a system that computes a small working set of texture maps for each frame to be rendered. Utilizing frame coherence and a simple recurrence relation, the algorithm computes the texture resolutions necessary to render the scene, requiring only a few arithmetic operations per polygon[9].
In this platform, we use level-of–detail(LOD) control to approach terrain rendering. A hierarchy of mesh refinement operations is used to adapt the surface tessellation. The LOD algorithms are view-dependent, and they adaptively refine and coarsen the mesh based on the deviation in pixels between the mesh and the original terrain. Also we use texture clip maps to handle huge texture maps.
Terrain rendering is one important part of 3D scene walkthrough, yet as we mainly focus on volume rendering we just take it as a non-core approach and just have a brief introduction. Fig.4 shows the texture of terrain we used in this platform.
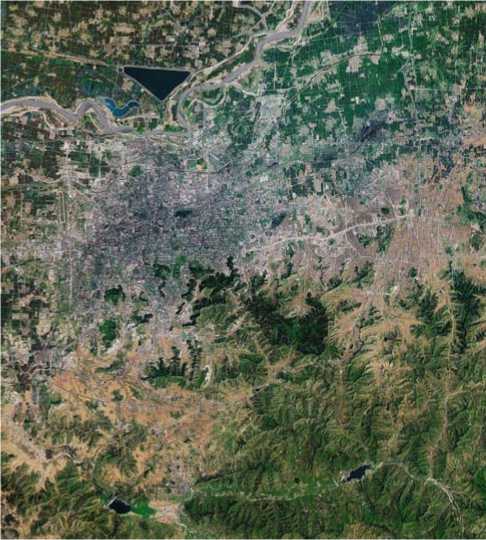
Figure 4. The terrain texture used in the 3D rendering
-
IV. Volume Clipping
Volume clipping is crucial for 3D scene walkthrough, and it should be real-time and accurate, so we try to generate an efficient method for clipping. The main volume clipping idea is to create a new 3D texture, the size and location of which change every time the viewpoint changes, and then load corresponding weather data into the 3D texture and render them.
First we develop a method to judge whether the viewpoint inside the volume cube. If it’s outside, there is no need to clip. If it’s inside, then we must clip the volume to cut away volume parts behind the viewpoint and create a new 3D texture. The location of the volume cube is fixed in the coordinate of the rendering scene, so we can judge by comparing the viewpoint’s coordinate with coordinates of eight vertexes of the cube. The cube’s origin and size of each dimension are initialized before reading the source weather data.
A. No Clipping Condition
If the viewpoint is outside the cube, we create a 3D texture with the same origin and size as the volume cube. Then we load the whole volume data into the 3D texture, set the transformation and scaling matrixes, and render the texture.
B. Clipping Condition
As the viewpoint is inside the cube, the clipping happens and we mainly change the size and location of the 3D texture to implement clipping. We determine which side of the volume cube should be clipped by comparing dimensions of the three axis components of view direction, and choose the axis that has the biggest dimension as the clipping direction. The clipping direction also varies depending on whether the choosing direction is negative.
There are six situations of the clipping as there are six clipping directions of the volume cube. The most important part for clipping is to determine the new size of the 3D texture for the volume cube according to viewpoint.
-
1) The first two situations happen when the x-axis component of the view direction has the largest dimension: We apply a float variable dx to help find the
location of the clipping plane. cx is the x-axis component of the viewpoint’s coordinate, ox is the x-axis component of the cube origin’s coordinate, and deltax is the x-axis component of scaling variable while rendering.
dx = x
c — o xx delta
x
-
a) If the direction of the x-axis component is negative, then we cut away the volume part off the cube origin: The clipping plane must be in front of the viewpoint so we can completely see the clipped volume part. We use an int variable tx = Ldx — 0.01 J to mark the location of the clipping plane in the volume. After a 3D texture with a new x-axis dimension tx created, only the x-axis component of the scaling matrix is changed.
-
b) Else as the direction of the x-axis component is positive, we just cut away the volume part towards the cube origin: Int variable tx = LDx —Ldx +1 Jj is used to mark the clipping plane, and Dx is the x-axis dimension of the original volume. The transformation and scaling matrixes should both be changed, as the clipped cube has a new origin.
-
2) The second two situations happen when the y-axis component of the view direction has the largest dimension:
dy
c — o yy deltay
-
a) When the direction of the y-axis component is negative, ty = Ldy — 0.01 J is the new y-axis dimension of the new 3D texture need to be created, and only the scaling matrix need reset.
-
b) When the direction of the y-axis component is positive, we create the 3D texture with t, =L Dy—Ld,+1JJ as its y-axis dimension, both the transformation and scaling matrix need reset.
-
3) If the z-axis component of the view direction has the largest dimension, the last two situations happen:
d z =
C z - O z deltaz
terrain and sky background so as to make the clipping process clearer.
-
a) If the direction of the z-axis component is negative, we create a new 3D texture with z-axis dimension tz = Ldz — 0.01 J , and then reset the z-axis dimension of the scaling matrix.
Else as the direction of the z-axis component is positive, t z = [ D z — [ d z + 1_|J is the z-axis dimension of the new 3D texture, and both the two matrixes need reset.
C. Trigger mechanism
As the system running, a 3D scene is generated and the air pollution is rendered in a volume cube. As viewers take mouse actions such move or click the mouse, the mouse monitor will send messages to the program. Once mouse actions inform the system that viewpoint is inside the volume cube, clipping happens. Else as the viewpoint is outside of the volume cube, the platform just renders the whole volume cube.
-
V. Results and Discussion
Our program is implemented in C++ using DirectX 3D for rendering. This program has been performed on a 2.33GHz Core Duo PC with 2GB of ram and an ATI Radeon HD 2600 PRO graphics board with 256 MB local video memory. We have got a sequence of satisfactory experimental results and make the program have a opportunity to be used in applications of air pollution visualization. The experimental data are atmospheric pollution space-time quantitative prediction of pollutants concentration data files. They cover 79 x 69 square kilometers’ area of Jinan city, and divide the troposphere into 12 layers according to height. The time resolution of the data files is one hour, and our data file contains data of 24 hours. The file contains three kinds of meteorological data and concentration data of six pollutants which are SO 2 , NO 2 , NO , CO , PM 10 and O 3 . We only use the SO 2 as the pollutant of our experiment.
Direct volume rendering and ray casting methods are used to implement air pollution rendering. Supported by these methods, we make the visualization of air pollution with features of translucent and realistic. Volume clipping method is used to achieve interaction between viewer and the pollution volume. This method helps implement 3D scene walkthrough in this scene.
A. Experimental Results
We generate two kinds of air pollution rendering scenes. The first kind is with terrain and sky background, and it shows how the visualization platform works. The second kind of experimental results are used to describe how the volume clipping happens, and we remove the
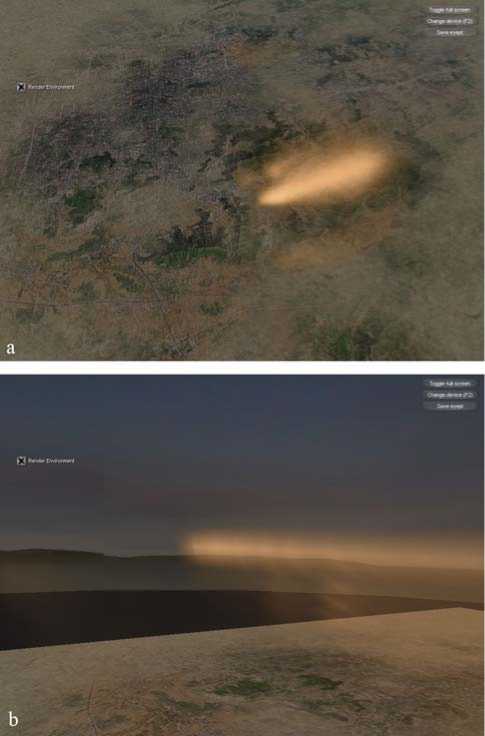
Figure 5. The visualization system: (a)Looking at the pollution volume from far away;(b)Getting into the pollution volume and looking forward.
Fig.4a shows what we firstly see when the system is running. The background below is the terrain texture of Jinan city, and the yellow translucent light group is the air pollution volume. The brighter the area is, the more serious the area is polluted. As we get into the volume, we got Fig.4b which shows the inside of the pollution volume and it’s clipped to cut away volume part behind the viewpoint.
To get a clearer impression of how the volume cube is clipped, we let the system only display the volume cube. Then we use a sequence of figures to show how the clipping process happening in Fig.5, Fig5a shows the whole volume cube in front of viewpoint, and our viewpoint moved forward from Fig.5c to Fig.5d in sequence, we can see the clipping happen clearly.
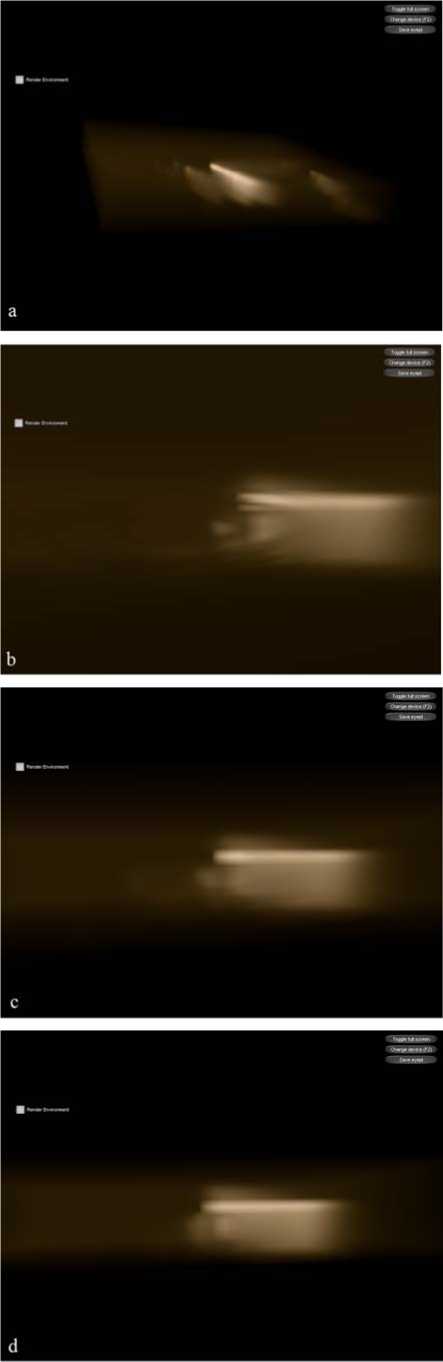
Figure 5. The clipped figure sequences as the viewpoint moving forward.
B. Discussion
The main advantage of our volume rendering approach is that it can load large volume data sets fast and display them interactively, and we generate a simple and practical method to map discrete and irregular volumetric data into a data range that our system can effectively render. Also we implement 3D scene walkthrough via a novel volume clipping method based on viewpoint. The main advantage of our volume clipping approach is that it is dynamical, simple, fast, and different from those clipping methods mainly change the volumetric value to achieve clipping. We concentrate on changing the 3D texture of the volumetric data according to the user’s viewpoint, and avoid changing the pre-loaded volumetric data. Both approaches make this program practical for fluid rendering based on volumetric data sets, especially for visualization of air pollution.
The main disadvantage of our approaches is that the implementation is preliminary and need to be accelerated. This system can’t display the volume in high detail, which mainly caused by the sparse density of our weather data and the ray tracing method for rendering. If the volumetric data are too large, there would be time delay while rendering. The clipping method need to change the 3D texture, reload data and reset the transformation and scaling matrixes every time the viewpoint changes, which may make the result disappointing if the application needs to be highly interactive.
-
VI. Conclusions
We have presented a system with a proper volume rendering approach and a novel volume clipping method for air pollution visualization in this paper. The system could load large data sets and render the volumetric data with moderate interaction, and clip the volume based on viewpoint to implement 3D scene walkthrough. The volume rendering and clipping are fast, so we could use these methods to achieve high interaction while implementing real-time 3D scene walkthrough.
However, when rendering large volume data, the rendering may have delay. The volume clipping is fast, yet simple, and the clipping may lack fidelity under some situations. In future work, we will make the system more practical and accelerate the volume rendering for better interaction.
Acknowledgment
Shigang Wang wishes to give thanks to Froemke Quentin from Intel for his explanations and advices on the visualization platform.
References The Implementation of 3D Scene Walkthrough in Air Pollution Visualization
- S.Guthe, M.Wand, J.Gonser, and W.Straßer, “Interactive Rendering of Large Volume Data Sets,” Visualization, 2002. VIS 2002. IEEE, pp. 53 - 60, November 2002
- Hon-Cheng Wong, Un-Hong Wong and Zesheng Tang, “Direct Volume Rendering by Transfer Function”, Information, Communications and Signal Processing, 2009. ICICS 2009. 7th International Conference, pp. 1-4, December 2009
- J.Wilhelms,A.Van Gelder, P.Tarantino, and J.Gibbs, “Hierarchical and Parallelizable Direct Volume Rendering for Irregular and Multiple Grids,” in Visualization '96. Proceeding, pp. 57 – 63, november 1996
- Q.Froemk, “Multi-Threaded Fluid Simulation for Games,” intel.com, June 2009.
- D.Weiskopf, K.Engel andT.Ertl, “Interactive Clipping Techniques for Texture-Based Volume Visualization and Volume Shading,” Visualization and Computer Graphics, IEEE Transactions, vol. 9, pp. 298-312, September 2003.
- Hon-Cheng Wong, Un-Hong Wong, Zesheng Tang, “Direct Volume Rendering by Transfer Function Morphing”, Information, Communications and Signal Processing, 2009. ICICS 2009. 7th International Conference, pp.1-4, December 2009
- Frank Losasso, Hugues Hoppe, "Geometry clipmaps: terrain rendering using nested regular grids", ACM Transactions on Graphics (TOG) - Proceedings of ACM SIGGRAPH 2004, Volume 23 Issue 3, August 2004
- Bent Dalgaard, Larsen Niels, Jørgen Christensen, “Real-time Terrain Rendering using Smooth Hardware Optimized Level of Detail”, Journal of WSCG, Vol.11, No.1, WSCG'2003, February, 2003
- Jonathan Blow, "Terrain rendering at high levels of detail", Game Developers Conference, March 2000
