The influence of the agglomeration effect on the demographic policy of territories

Author: Sitkovskiy A.M., Raisikh A.E., Gladky A.S., Bezverbnaya N.A.
Journal: Economic and Social Changes: Facts, Trends, Forecast @volnc-esc-en
Section: Regional economy
Article in issue: 6 т.18, 2025.
Free access
In the context of increasing spatial polarization and uneven urbanization, the central question becomes the empirical assessment of the agglomeration effect's influence on the demographic dynamics of peripheral settlements. This study is devoted to a quantitative analysis of the relationship between the distance of peripheral settlements from the core of an urban agglomeration and changes in their population during the 2010–2021 intercensal period. The theoretical and methodological basis is formed by the concepts of center-periphery systems and spatial polarization. The research covers 40 urban agglomerations in Russia and is based on studying the demographic dynamics of about 25,000 settlements. The methodology included: determining the geodesic distances from each peripheral settlement to the corresponding core; calculating four metrics of demographic dynamics: absolute, relative, logarithmic growth, and average annual growth rate; estimating paired Pearson and Spearman correlation coefficients between distance and demographic indicators. The empirical data is based on the results of the 2010 and 2020 All-Russian Population Censuses. Overall, for the entire set of peripheral settlements, a weak but stable negative monotonic dependence was recorded. Based on the analysis results, agglomerations were divided into three groups: those with a strong negative gradient (18 agglomerations, predominantly in Siberia and the Urals), a moderate gradient (15 agglomerations, including the largest ones – Moscow and Saint Petersburg), and no significant gradient (7 agglomerations). No positive correlations were found in any case. The practical significance of the results lies in substantiating the priorities of demographic policy: the need for targeted support of remote zones, the development of sub-centers, and the consideration of transport accessibility.
Agglomeration effect, demographic dynamics, spatial polarization, geodesic distance, correlation analysis, center-periphery gradient
Short address: https://sciup.org/147252994
IDR: 147252994 | UDC: 314.1; 332.1 | DOI: 10.15838/esc.2025.6.102.4
Text of the scientific article The influence of the agglomeration effect on the demographic policy of territories
The study was supported by Russian Science Foundation grant 25-78-30004 “Digital Demographic Observatory: Development of a Monitoring System for Demographic Processes in Russian Regions Using GIS Technologies and Big Data”,
Urban agglomerations represent complex center-periphery systems where demographic processes unfold unevenly. Large core cities typically accumulate population due to migratory influx and natural increase, whereas peripheral settlements often experience outmigration. The concept of spatial polarization directly points to the trend of population concentration in urban centers alongside the contraction of the periphery (Sitkovskiy, 2022). In other words, the agglomeration effect can manifest as a negative relationship between a settlement’s distance from the agglomeration core and its population dynamics: the farther from the center, the weaker the growth or the stronger the decline in population.
The relevance of this study is driven by the need for empirical determination of the zone of influence of the agglomeration effect under Russian conditions, within the framework of addressing the tasks of balanced spatial development enshrined in the strategic documents of the Russian Federation. Despite existing research dedicated to individual agglomerations, a gap in scientific knowledge persists, related to the lack of a systematic interagglomeration analysis that would allow not only confirming the existence of a gradient but also revealing typical patterns of its manifestation for different types of Russian agglomerations.
This study aims to fill this gap and proposes a quantitative assessment of the agglomeration effect using the example of 40 urban agglomerations, the list of which is specified in the draft1 of the Spatial Development Strategy for the period up to 20252. The centers of all these agglomerations are included in the list of supporting settlements approved by the current Spatial Development Strategy for the period up to 20303; however, unlike the previous draft strategy, it does not define the composition of agglomerations. The primary focus is on the peripheral settlements of the agglomerations, i.e., settlements administratively or functionally attributed to an agglomeration but not being core cities. The scientific novelty of the research lies in the development and testing of a typology of agglomerations based on the nature of the demographic gradient. The research hypothesis is that a stable negative demographic “center – periphery” gradient exists in Russian urban agglomerations, manifested in a systematic decrease in growth rates (or an increase in decline) of the population in peripheral settlements as their distance from the agglomeration core increases. The study’s objective is a comprehensive test of this hypothesis through the identification, quantitative assessment, and typologization of patterns in the manifestation of the agglomeration effect in the demographic dynamics of peripheral territories.
To achieve the stated objective and test the hypothesis, the following tasks are sequentially addressed in the work: 1) formation and analysis of an extensive database including coordinates of settlements, their statuses within the agglomeration (core or periphery), as well as population figures from the two previous All-Russian Population Censuses of 2010 and 2020; 2) calculation for each peripheral settlement of the geodesic distance to the core of the corresponding agglomeration and several metrics of demographic dynamics (absolute, relative, and logarithmic growth, as well as the compound annual growth rate – CAGR); 3) assessment of the strength and direction of the relationship between distance and demographic dynamics using paired Pearson and Spearman correlation coefficients; 4) development of a typology of agglomerations based on the obtained correlation dependencies; 5) interpretation of the strength of center-periphery gradients in different agglomerations based on the results and the developed typology.
Literature review
The observed dependence of population change rates on the distance to an agglomeration core in many countries is a classic gradient problem in spatial demography. Its theoretical foundation traces back to Clark’s exponential density decline and works on suburbanization and changes in urban contours: radial-distance profiles serve as the natural scale for analyzing population growth/ decline in the core, inner suburbs, and more distant periphery (Clark, 1951).
Despite extensive research on general trends of urbanization and suburbanization in Russia, systematic quantitative assessments allowing for the comparison of the strength and nature of the center-periphery demographic gradient for a representative sample of agglomerations have not yet been conducted. Existing studies typically focus either on the migration component or on in-depth analysis of individual, mostly large agglomerations. The present study aims to fill this gap by proposing a formalized inter-agglomeration analysis based on a unified methodology for 40 agglomerations.
Empirical studies for Russia over the last decade systematically record a pronounced center-periphery gradient in intra-agglomeration dynamics. Research based on detailed migration data for 2011–2020 confirms that maximum positive migration effects are observed in the “inner belt” of suburbs around major and regional centers at distances of approximately 20–40 km from the center. In contrast, more distant zones show weaker growth or even decline, with the magnitude of the “peak” depending on the scale of the core and the morphology of the agglomeration (Karachurina et al., 2021; Mkrtchyan, Gilmanov, 2023b). This redistribution of population is part of the broader process of vertical migration – upward movement along the settlement hierarchy from small settlements to large ones. In the 2010s, Russia saw almost no downward movement, and the beneficiaries of migration were cities with populations over 250,000, especially the agglomerations of Moscow and Saint Petersburg (Mkrtchyan, Gilmanov, 2023a). These studies convincingly confirm the predominant population growth in suburbs due to migration influx. However, the final demographic outcome, resulting from the combined influence of migration and natural population movement, as well as its variability across the country, remains insufficiently studied.
In the Russian context, suburbanization-driven population increase is almost always migration-determined and markedly age-selective: it primarily involves groups of young and middle-aged workingage people. Meanwhile, demographic aging and elevated mortality can offset growth at greater distances (Karachurina, Mkrtchyan, 2016; Mkrtchyan, 2019). Thus, the final population dynamics of settlements result from the interaction of migration and natural population movement (Halfacree, 2012; Stockdale, 2016; Johnson, Lichter, 2020).
A key methodological risk in assessing the relationship between population dynamics and distance to an agglomeration core stems from the effects of reclassification (changes in administrative boundaries, settlement status, etc.). L.L. Rybakov-sky proposes terming such growth “mechanical”, alongside natural and migratory growth4. Ignoring reclassification can systematically overestimate the true growth of the core and/or the nearest belts and underestimate indicators for peripheral territories. Therefore, approaches that separate growth into components related to migration, natural movement, and mechanical movement are considered more accurate (Jiang et al., 2022). Within this study, we deliberately accept this limitation, focusing on the final population dynamics according to census data. This, on one hand, prevents the disaggregation of growth components but, on the other hand, provides a representative picture of the final result of spatial population redistribution for all types of settlements.
The delineation line between “core – suburbs – periphery” is also sensitive to the method of agglomeration delimitation. Classic methods for assessing real interaction within an agglomeration are considered to be functional approaches based on commuting patterns (Raisikh, 2020a) and mobile operator data, which has been applied in Russian research for the Moscow agglomeration (Makhrova, Babkin, 2019). Unfortunately, data on daily movements are not collected for a large number of agglomerations in Russia. Under such conditions, preference should be given to proxy methods that allow for identifying actual catchment radii based on roads and other transportation lines and, consequently, correct distances. An assessment of the actual catchment radii for a large number of Russian agglomerations, based on a comparison with the areas of foreign agglomerations calculated from commuting data and the recalculation of agglomeration areas based on actual distances, was carried out in a study (Raisikh, 2020b). This directly relates to distance calculation: for correlation analysis, it is advisable to compare both straightline geodesic distances and travel-time accessibility to the core via public roads.
International sources confirm the dynamic nature of the gradient: phases of suburbanization and deurbanization are replaced by new cycles of reurbanization, which changes the sign and shape of the “growth – radius” dependence in specific time intervals (radii) and city classes (Haase et al., 2013). The scale and morphology of ringed growth are further explained by the size of the agglomeration and its polycentricity (Angel, 2023), as well as the distribution of nighttime light/urbanized areas by distance (Rubiera-Morollon, Garrido-Yserte, 2020).
A number of international big data studies show that the intensity of movements and their radial structure scale with city size: large cores have extensive catchment belts, and the growth profile with distance takes on a non-linear form with a local maximum in the near periphery (Kabisch, Haase, 2011; Kroll, Kabisch, 2012). For post-socialist metropolises (e.g., Prague), the contribution of migration and natural movement to suburbanization-driven growth varies across radii, further emphasizing the need to model not just a correlation with distance, but a gradient (Vobecka, Piguet, 2012).
For the Russian empirical context, two patterns are consistently observed: first, centripetal migration along the hierarchy of settlement → small city → regional center/suburb of large cities; second, “spillover” between the core and the nearest suburbs, where the growth of the latter is often more intensive than in the center, especially with the expansion of expensive and scarce housing and job segments (Karachurina, 2022). These findings align with distance-radial patterns of housing construction and central accessibility, which influence the final demographic dynamics of peripheral settlements.
The literature review has shown that when assessing the relationship between the dynamics of peripheral settlements and their distance to the core, a non-linear specification with zonal radius approximation and fixed agglomeration effects is preferable, along with the decomposition of growth into migration and natural components (if available). Such a design allows for separating the true distance-based response from artifacts of reclassification and differences between agglomerations (Aguilera, Mignot, 2004; Lambert, 2016; Sultana, Weber, 2013).
The conducted review allows us to conclude that, despite in-depth research on migration flows and suburban growth, the following gaps persist in existing scientific knowledge, which the present study aims to address:
-
1) the absence of a formalized comparative typology of Russian agglomerations based on the strength and nature of the center-periphery demographic gradient;
-
2) the limited analysis of the final demographic dynamics (the combined result of migration and natural movement) at the level of all peripheral settlements, not just the suburban zone;
-
3) a lack of rigorous quantitative comparisons performed on a unified methodological basis for a representative sample of 40 agglomerations, which prevents the identification of nationwide patterns and regional specifics.
The methodology of this research is aimed at overcoming these limitations and obtaining comparable quantitative estimates of the agglomeration effect for the entire country.
Methodology and methods
The objects of the study are 40 urban agglomerations of the Russian Federation, listed in the draft of the Spatial Development Strategy for the period up to 20255. The draft Strategy was chosen as the basis for the study precisely because it contained a complete list of municipalities constituting the core and periphery of the agglomerations. The core of an agglomeration is the largest settlement; the periphery consists of all settlements included in the municipal formations of the agglomerations according to the aforementioned draft Strategy. Data on population in settlements were obtained from the results of the two All-Russian Population Censuses of 2010 and 2020, as only they contain information precisely broken down by each settlement. The data were obtained through requests to Rosstat and are hosted on the EverGis platform6. The generated database for each settlement includes geographical coordinates (latitude φ and longitude λ), administrative affiliation, status within the agglomeration (core or periphery of a first or second-order agglomeration), as well as the resident population figures for 2010 and 2021 (since the 2020 All-Russian Population Census was actually conducted in 2021).
The chosen data source has two limitations: first, the population by individual settlements is not estimated in the intercensal period, meaning this indicator is only available on the census date;
second, there is also no possibility to separate population growth (decline) into natural and migration components. Mechanical growth was not estimated, as peripheral settlements of urban agglomerations were defined as all those classified as such at the time of the study, regardless of their municipal affiliation in 2010.
Table 1 presents the population of the agglomerations, calculated as the sum of the population in all core and peripheral settlements. Collectively, the 40 agglomerations cover a population of approximately 73.3 million people as of 2021, representing about half of Russia’s population. Of these, approximately 47.7 million people ( ≈ 65%) resided in the agglomeration cores (largest cities), and ≈ 25.6 million people ( ≈ 35%) – in peripheral settlements. On average, each urban core accounted for about 1.17 million inhabitants, while the average total population of the periphery of a single agglomeration was ≈ 0.63 million people (a core-to-periphery ratio of approximately 2 to 1 in terms of population). The total number of peripheral settlements across the 40 agglomerations is about 24.7 thousand (out of 155.5 thousand); thus, the average population size of an individual peripheral settlement is small (about 1 thousand inhabitants, many settlements are rural). Nevertheless, the population dynamics of the periphery in 2010–2021 were overall slightly positive: the total number of inhabitants in peripheral territories increased by approximately 4.2% (from 24.6 to 25.6 million people), while the total growth of core city populations was about 6.6% (from 44.7 to 47.7 million people). This indicates the leading role of cores in the overall population growth of agglomerations, although the periphery, on the whole, did not lag too far behind, thanks to growth in some suburban settlements.
Table 1. Population size and dynamics in Russian urban agglomerations, 2010–2021
|
Agglomeration |
Population size |
Number of settlements, units |
||||||||
|
Core |
Periphery |
Total |
||||||||
|
2010, people |
2021, people |
Increase, % |
2010, people |
2021, people |
Increase, % |
2010, people |
2021, people |
Increase, % |
||
|
Moscow agglomeration |
11503501 |
12380664 |
+7.63 |
7467735 |
7629273 |
+2.16 |
18971236 |
20009937 |
+5.48 |
6834 |
|
Saint Petersburg agglomeration |
4879566 |
5225690 |
+7.09 |
1192500 |
1311299 |
+9.96 |
6072066 |
6536989 |
+7.66 |
1532 |
|
Yekaterinburg agglomeration |
1349772 |
1515832 |
+12.30 |
1062818 |
1106312 |
+4.09 |
2412590 |
2622144 |
+8.69 |
319 |
|
Samara agglomeration |
1164685 |
1156608 |
-0.69 |
1348951 |
1399565 |
+3.75 |
2513636 |
2556173 |
+1.69 |
386 |
|
Rostov agglomeration |
1089261 |
1125299 |
+3.31 |
1393681 |
1400933 |
+0.52 |
2482942 |
2526232 |
+1.74 |
399 |
|
Nizhny Novgorod agglomeration |
1250619 |
1276560 |
+2.07 |
949266 |
912857 |
-3.84 |
2199885 |
2189417 |
-0.48 |
1442 |
|
Novosibirsk agglomeration |
1473754 |
1618039 |
+9.79 |
474352 |
517363 |
+9.07 |
1948106 |
2135402 |
+9.61 |
325 |
|
Kazan agglomeration |
1143535 |
1205651 |
+5.43 |
424100 |
592443 |
+39.69 |
1567635 |
1798094 |
+14.70 |
805 |
|
Chelyabinsk agglomeration |
1130132 |
1134643 |
+0.40 |
571917 |
647584 |
+13.23 |
1702049 |
1782227 |
+4.71 |
424 |
|
Volgograd agglomeration |
1021215 |
1030400 |
+0.90 |
561545 |
578544 |
+3.03 |
1582760 |
1608944 |
+1.65 |
239 |
|
Krasnodar agglomeration |
744995 |
987828 |
+32.60 |
425690 |
618088 |
+45.20 |
1170685 |
1605916 |
+37.18 |
187 |
|
Ufa agglomeration |
1062319 |
1096702 |
+3.24 |
366564 |
393335 |
+7.30 |
1428883 |
1490037 |
+4.28 |
876 |
|
Omsk agglomeration |
1154116 |
1178391 |
+2.10 |
241118 |
246146 |
+2.09 |
1395234 |
1424537 |
+2.10 |
326 |
|
Voronezh agglomeration |
889680 |
1054111 |
+18.48 |
257488 |
270243 |
+4.95 |
1147168 |
1324354 |
+15.45 |
271 |
|
Perm agglomeration |
991162 |
1048011 |
+5.74 |
181137 |
191281 |
+5.60 |
1172299 |
1239292 |
+5.71 |
300 |
|
Krasnoyarsk agglomeration |
973826 |
1066934 |
+9.56 |
150223 |
150385 |
+0.11 |
1124049 |
1217319 |
+8.30 |
107 |
|
Irkutsk agglomeration |
587891 |
623479 |
+6.05 |
392200 |
438487 |
+11.80 |
980091 |
1061966 |
+8.35 |
126 |
|
Kama agglomeration |
513193 |
524444 |
+2.19 |
573513 |
523263 |
-8.76 |
1086706 |
1047707 |
-3.59 |
598 |
|
Tyumen agglomeration |
581907 |
744554 |
+27.95 |
142582 |
157454 |
+10.43 |
724489 |
902008 |
+24.50 |
76 |
|
Vladivostok agglomeration |
592034 |
633102 |
+6.94 |
160047 |
145247 |
-9.25 |
752081 |
778349 |
+3.49 |
67 |
|
Makhachkala agglomeration |
572076 |
597316 |
+4.41 |
612250 |
679127 |
+10.92 |
1184326 |
1276443 |
+7.78 |
101 |
|
Saratov agglomeration |
837900 |
840785 |
+0.34 |
369660 |
401047 |
+8.49 |
1207560 |
1241832 |
+2.84 |
197 |
|
Tula agglomeration |
501169 |
546953 |
+9.14 |
659463 |
667919 |
+1.28 |
1160632 |
1214872 |
+4.67 |
1423 |
|
Novokuznetsk agglomeration |
547904 |
551919 |
+0.73 |
521769 |
482277 |
-7.57 |
1069673 |
1034196 |
-3.32 |
239 |
|
Izhevsk agglomeration |
627734 |
648944 |
+3.38 |
344804 |
349768 |
+1.44 |
972538 |
998712 |
+2.69 |
357 |
End of Table 1
|
Agglomeration |
Population size |
Number of settlements, units |
||||||||
|
Core |
Periphery |
Total |
||||||||
|
2010, people |
2021, people |
Increase, % |
2010, people |
2021, people |
Increase, % |
2010, people |
2021, people |
Increase, % |
||
|
Caucasian Mineral Waters |
142511 |
145971 |
+2.43 |
802989 |
808301 |
+0.66 |
945500 |
954272 |
+0.93 |
202 |
|
Barnaul agglomeration |
612401 |
633432 |
+3.43 |
285218 |
294957 |
+3.41 |
897619 |
928389 |
+3.43 |
149 |
|
Yaroslavl agglomeration |
591486 |
603961 |
+2.11 |
254351 |
263777 |
+3.71 |
845837 |
867738 |
+2.59 |
2589 |
|
Stavropol agglomeration |
398539 |
425853 |
+6.85 |
414394 |
424185 |
+2.36 |
812933 |
850038 |
+4.56 |
191 |
|
Astrakhan agglomeration |
520339 |
532699 |
+2.38 |
264512 |
277725 |
+5.00 |
784851 |
810424 |
+3.26 |
294 |
|
Cheboksary agglomeration |
453721 |
492331 |
+8.51 |
326063 |
317855 |
-2.52 |
779784 |
810186 |
+3.90 |
774 |
|
Ulyanovsk agglomeration |
614786 |
627870 |
+2.13 |
170862 |
165582 |
-3.09 |
785648 |
793452 |
+0.99 |
245 |
|
Tomsk agglomeration |
524669 |
575352 |
+9.66 |
205026 |
211279 |
+3.05 |
729695 |
786631 |
+7.80 |
142 |
|
Orenburg agglomeration |
548331 |
561686 |
+2.44 |
145464 |
175032 |
+20.33 |
693795 |
736718 |
+6.19 |
175 |
|
Kirov agglomeration |
473695 |
501247 |
+5.82 |
254485 |
219752 |
-13.65 |
728180 |
720999 |
-0.99 |
1137 |
|
Khabarovsk agglomeration |
577441 |
617473 |
+6.93 |
85313 |
91382 |
+7.11 |
662754 |
708855 |
+6.96 |
71 |
|
Kemerovo agglomeration |
532981 |
558973 |
+4.88 |
139799 |
142659 |
+2.05 |
672780 |
701632 |
+4.29 |
133 |
|
Penza agglomeration |
517311 |
522317 |
+0.97 |
160353 |
174914 |
+9.08 |
677664 |
697231 |
+2.89 |
152 |
|
Lipetsk agglomeration |
508887 |
509420 |
+0.10 |
148645 |
154871 |
+4.19 |
657532 |
664291 |
+1.03 |
193 |
|
Ryazan agglomeration |
524927 |
537622 |
+2.42 |
91430 |
93124 |
+1.85 |
616357 |
630746 |
+2.33 |
294 |
|
Total |
44725971 |
47659066 |
+6.56 |
24594277 |
25625635 |
+4.19 |
69320248 |
73284701 |
+5.72 |
24697 |
Compiled from: population data for all settlements within agglomerations according to the results of the All-Russian Population Censuses of 2010 and 2021.
For each peripheral settlement, the distance to the core was calculated. The distance D from each peripheral settlement to the center of the agglomeration was calculated as the geodesic (shortest arc on a spheroid) distance using coordinates. For this, the haversine formula for a sphere with radius R ≈ 6371 km was applied:
D = 2R arcsin ^J sin2 (^) + cos ф; cos фс sin2 (^ j (1)
where Дф = (pt- (pc and ДЛ = At- Ac — differences in latitude and longitude between the peripheral settlement i and the core city c. All distances are calculated in kilometers as straight-line distances (without considering the road network, as this work does not apply road graph methods or other network metrics – the analysis is limited to geographical distances). For the agglomerations, based on their composition defined in the draft of the Spatial Development Strategy for the period up to 2025, distances to peripheral points range from a few kilometers (for suburbs) to approximately 100 km (the most remote settlement within a municipality considered part of the agglomeration’s periphery:
for example, the village of Lyubitsy in Zhukovsky Municipal District of the Kaluga Region, which is part of the Moscow agglomeration). In the case of polycentric agglomerations (e.g., Caucasian Mineral Waters), the main city (the largest core, e.g., Pyatigorsk) was chosen as the conditional center of the agglomeration for distance calculations.
For each settlement, indicators of population dynamics over the decade 2010–2021 were calculated. Several newly emerged settlements were excluded from the analysis of relative changes. Four complementary metrics were used:
-
– absolute growth ∆ P : the difference between the population in 2021 and 2010;
-
– relative growth R : the ratio of absolute growth ∆ P to the population in 2010;
-
– logarithmic growth L : the natural logarithm of the ratio of the population in 2021 to that in 2010;
-
– compound annual growth rate (CAGR) : calculated as the average annual geometric rate of population change based on the 11-year study period.
CAGR = (^M 1/11 - 1 , (2)
' *2010
where P 2021 – population in 2021, and P 2010 – population in 2010.
Each of these indicators has its advantages. Absolute growth is more informative for large cities (where even a small relative growth results in a large influx of people), whereas relative and annual growth rates allow for comparing the dynamics of settlements of different sizes. In the subsequent analysis, we consider all four metrics, but we will pay special attention to relative growth and CAGR as the most illustrative characteristics.
To assess the relationship between the distance D from the center and the population dynamics indicators ( Y ), paired Pearson ( r ) and Spearman (ρ) correlation coefficients were used. The Pearson coefficient characterizes the degree of linear dependence between the values of two variables and ranges from -1 to +1. A negative value of r would indicate that as distance D increases, there is a systematic decrease in Y (which corresponds to the hypothesis of degradation in the distant periphery). The Spearman coefficient assesses a monotonic relationship and is computed as the Pearson coefficient but using ranked variables. It is less sensitive to outliers and non-linearities, showing whether a general tendency for Y to decrease (or increase) with increasing D is maintained. The complete results of the correlation coefficient calculations can be found in Table 2.
Table 2. Pearson ( r ) and Spearman ( ρ ) correlation coefficients between distance from core to periphery ( D ) and population dynamics indicators of Russian urban agglomerations for 2010–2021
|
Agglomeration |
Correlation coefficient |
|||||||
|
Pearson (r ) |
Spearman ( ρ ) |
|||||||
|
Δ P |
R |
L |
CAGR |
Δ P |
R |
L |
CAGR |
|
|
Group I. Strong negative gradient |
||||||||
|
Astrakhan agglomeration |
-0.32 |
-0.45 |
-0.52 |
-0.52 |
-0.52 |
-0.56 |
-0.56 |
-0.56 |
|
Barnaul agglomeration |
-0.28 |
-0.15 |
-0.32 |
-0.31 |
-0.54 |
-0.52 |
-0.53 |
-0.53 |
|
Volgograd agglomeration |
-0.14 |
0.02 |
-0.13 |
-0.12 |
-0.29 |
-0.33 |
-0.32 |
-0.32 |
|
Izhevsk agglomeration |
-0.22 |
-0.31 |
-0.32 |
-0.32 |
-0.4 |
-0.39 |
-0.39 |
-0.39 |
|
Irkutsk agglomeration |
-0.26 |
-0.45 |
-0.52 |
-0.52 |
-0.68 |
-0.64 |
-0.64 |
-0.64 |
|
Kirov agglomeration |
0.02 |
-0.26 |
-0.32 |
-0.32 |
-0.26 |
-0.45 |
-0.38 |
-0.38 |
|
Krasnodar agglomeration |
-0.34 |
-0.17 |
-0.16 |
-0.18 |
-0.44 |
-0.35 |
-0.35 |
-0.35 |
|
Lipetsk agglomeration |
-0.37 |
-0.16 |
-0.25 |
-0.24 |
-0.42 |
-0.36 |
-0.37 |
-0.37 |
|
Novokuznetsk agglomeration |
0.01 |
-0.3 |
-0.37 |
-0.37 |
-0.3 |
-0.42 |
-0.44 |
-0.44 |
|
Novosibirsk agglomeration |
-0.25 |
-0.36 |
-0.38 |
-0.39 |
-0.52 |
-0.54 |
-0.54 |
-0.54 |
|
Orenburg agglomeration |
-0.38 |
-0.44 |
-0.43 |
-0.44 |
-0.48 |
-0.48 |
-0.48 |
-0.48 |
End of Table 2
|
Agglomeration |
Correlation coefficient |
|||||||
|
Pearson (r ) |
Spearman ( ρ ) |
|||||||
|
Δ P |
R |
L |
CAGR |
Δ P |
R |
L |
CAGR |
|
|
Penza agglomeration |
-0.15 |
-0.31 |
-0.3 |
-0.3 |
-0.4 |
-0.47 |
-0.46 |
-0.46 |
|
Perm agglomeration |
-0.14 |
-0.42 |
-0.43 |
-0.43 |
-0.46 |
-0.54 |
-0.54 |
-0.54 |
|
Tomsk agglomeration |
-0.16 |
-0.27 |
-0.37 |
-0.36 |
-0.51 |
-0.52 |
-0.51 |
-0.51 |
|
Tyumen agglomeration |
0.16 |
-0.47 |
-0.46 |
-0.47 |
-0.51 |
-0.61 |
-0.6 |
-0.6 |
|
Ulyanovsk agglomeration |
-0.15 |
-0.22 |
-0.26 |
-0.26 |
-0.39 |
-0.45 |
-0.46 |
-0.46 |
|
Khabarovsk agglomeration |
-0.24 |
-0.45 |
-0.35 |
-0.36 |
-0.54 |
-0.57 |
-0.56 |
-0.56 |
|
Cheboksary agglomeration |
-0.12 |
-0.03 |
-0.21 |
-0.2 |
-0.26 |
-0.38 |
-0.38 |
-0.38 |
|
Group II. Moderate negative gradient |
||||||||
|
Vladivostok agglomeration |
-0.03 |
-0.36 |
-0.25 |
-0.26 |
-0.33 |
-0.2 |
-0.2 |
-0.2 |
|
Voronezh agglomeration |
-0.25 |
-0.21 |
-0.21 |
-0.21 |
-0.24 |
-0.28 |
-0.27 |
-0.27 |
|
Yekaterinburg agglomeration |
-0.17 |
-0.12 |
-0.08 |
-0.09 |
-0.18 |
-0.19 |
-0.19 |
-0.19 |
|
Caucasian Mineral Waters |
-0.06 |
-0.22 |
-0.22 |
-0.22 |
-0.15 |
-0.26 |
-0.26 |
-0.26 |
|
Kazan agglomeration |
-0.06 |
-0.11 |
-0.11 |
-0.12 |
-0.3 |
-0.23 |
-0.24 |
-0.24 |
|
Kemerovo agglomeration |
-0.22 |
-0.17 |
-0.19 |
-0.2 |
-0.33 |
-0.33 |
-0.35 |
-0.35 |
|
Moscow agglomeration |
-0.02 |
0.01 |
-0.07 |
-0.06 |
-0.1 |
-0.13 |
-0.1 |
-0.1 |
|
Nizhny Novgorod agglomeration |
0 |
-0.16 |
-0.22 |
-0.22 |
-0.25 |
-0.25 |
-0.26 |
-0.26 |
|
Omsk agglomeration |
-0.21 |
-0.26 |
-0.21 |
-0.22 |
-0.2 |
-0.28 |
-0.28 |
-0.28 |
|
Samara agglomeration |
-0.02 |
-0.12 |
-0.13 |
-0.13 |
-0.21 |
-0.21 |
-0.2 |
-0.2 |
|
Saint Petersburg agglomeration |
-0.06 |
-0.07 |
-0.24 |
-0.24 |
-0.3 |
-0.33 |
-0.32 |
-0.32 |
|
Saratov agglomeration |
-0.13 |
-0.13 |
-0.06 |
-0.05 |
-0.16 |
-0.14 |
-0.07 |
-0.07 |
|
Stavropol agglomeration |
-0.06 |
-0.1 |
-0.04 |
-0.05 |
-0.18 |
-0.24 |
-0.24 |
-0.24 |
|
Ufa agglomeration |
-0.1 |
-0.06 |
-0.16 |
-0.16 |
-0.14 |
-0.15 |
-0.16 |
-0.16 |
|
Chelyabinsk agglomeration |
-0.18 |
-0.22 |
-0.19 |
-0.19 |
-0.29 |
-0.26 |
-0.26 |
-0.26 |
|
Group III. No significant gradient |
||||||||
|
Kama agglomeration |
0.02 |
-0.04 |
-0.02 |
-0.02 |
0.07 |
0 |
0.02 |
0.02 |
|
Krasnoyarsk agglomeration |
-0.11 |
-0.11 |
-0.1 |
-0.1 |
-0.05 |
-0.03 |
-0.03 |
-0.03 |
|
Makhachkala agglomeration |
-0.09 |
0.1 |
0.19 |
0.19 |
-0.05 |
0.12 |
0.14 |
0.14 |
|
Rostov agglomeration |
-0.14 |
0.08 |
0.07 |
0.07 |
-0.04 |
0.05 |
0.05 |
0.05 |
|
Ryazan agglomeration |
-0.02 |
0.05 |
0.05 |
0.05 |
0 |
0.03 |
0.03 |
0.03 |
|
Tula agglomeration |
0.05 |
-0.02 |
-0.02 |
-0.02 |
0.02 |
0.01 |
0.01 |
0.02 |
|
Yaroslavl agglomeration |
-0.04 |
-0.05 |
-0.09 |
-0.1 |
-0.13 |
-0.1 |
-0.1 |
-0.1 |
|
Note: Δ P – absolute population growth, R – relative population growth, L – logarithmic population growth, CAGR – compound annual growth rate of population. Source: own compilation. |
||||||||
Correlations were calculated first for the entire set of peripheral settlements across Russia, and then separately for each agglomeration (i.e., within groups of settlements belonging to the same agglomeration). The statistical significance of the coefficients (null hypothesis ρ = 0) was tested at the level р < 0.05. For this, sample sizes were taken into account: thus, in the entire sample (about 25,000 observations), even very weak correlations can be significant, whereas within a single agglomeration (hundreds of observations) the sensitivity threshold is lower. Due to the non-Gaussian nature of the distributions (especially of relative growth rates), primary attention is given to interpreting the Spearman coefficient as a more reliable indicator of trend.
Results
For the entire set of peripheral settlements across the 40 agglomerations, a weak but statistically significant negative correlation was found between distance from the center and demographic dynamics. In other words, on average, remote settlements
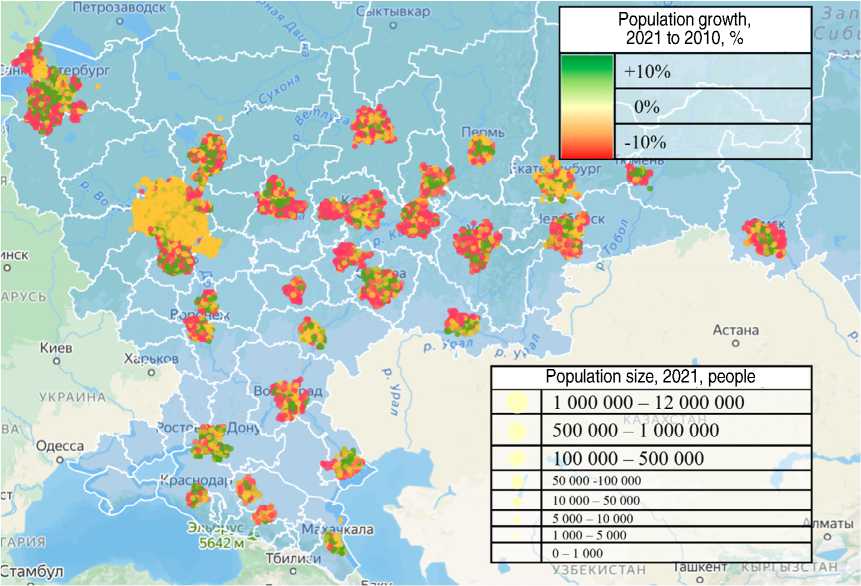
Figure 1. Population size and its dynamics in settlements of urban agglomerations in western Russia for 2010–2021
Compiled from: Sitkovskiy A.M. (2025). The settlement system of Russia. Geoinformation Platform EverGis. 2025. Available at: (accessed: 14.09.2025).
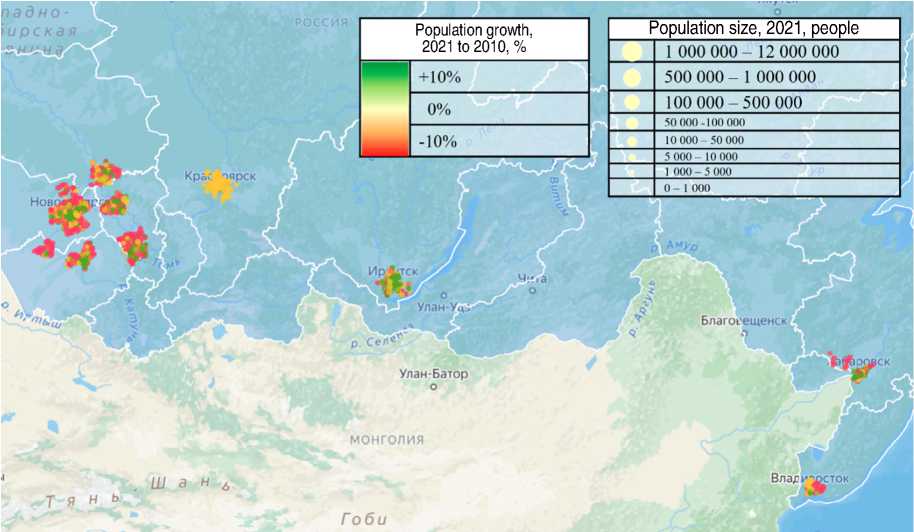
Figure 2. Population size and its dynamics in settlements of urban agglomerations in eastern Russia for 2010–2021
Compiled from: Sitkovskiy A.M. (2025). The settlement system of Russia. Geoinformation Platform EverGis. 2025. Available at: (accessed: 14.09.2025).
showed slightly worse population growth indicators over the decade than those close to the cores. For instance, the Spearman coefficient ρ between distance D and relative growth R was approximately –0.12 (with р ≈ 10-72, i.e., significant at any reasonable level). A similar value of ρ ≈ –0.129 was obtained for CAGR (also highly significant), and ρ ≈ –0.127 for absolute growth. Pearson coefficients were even smaller in absolute value (around –0.03 to –0.09), indicating that the linear dependence is very weak and the overall trend is formed primarily by the rank-based (monotonic) component. In other words, at the all-Russian scale, the distance effect manifested insignificantly: against the backdrop of numerous other factors determining the growth or decline of specific settlements, distance from the core city alone explains only a small fraction of the variation. Nevertheless, the sign of the coefficient is negative, which corresponds to the initial hypothesis that “the center develops faster than the periphery”.
It should be emphasized that the negative relationship is observed when averaging across all agglomerations, but it is by no means equally pronounced in each agglomeration. Some agglomerations show a clear center-periphery demographic gradient, while in others the dependence is weak or statistically indistinguishable. Let us consider the differentiated results by agglomeration.
Figures 1 and 2 present a cartogram reflecting the total population in 2021 (relative size of the circle) and population dynamics for 2010–2021 (color: red –10% over 10 years, yellow 0%, green +10%) for all settlements included in the 40 urban agglomerations of Russia.
From the cartogram in Figures 1, 2 and the statistical data, it is evident that the strongest negative distance effect is characteristic of a number of agglomerations in different regions. For instance, the Novosibirsk agglomeration shows one of the strongest dependencies: Spearman’s ρ ≈ –0.543 (for relative growth, р « 5.9x10 - 2). This means that more distant rural areas and small towns around
Novosibirsk lost population significantly faster, while the population in the nearest suburbs of the core grew or declined less. Similar coefficients were obtained for logarithmic growth and CAGR (around -0.54), as well as for absolute growth (ρ ≈ –0.52). The latter fact is interesting because absolute changes are usually smoothed out in rural areas, yet even they are ranked quite strictly by distance. A similarly strong gradient is observed in the Irkutsk agglomeration (ρ ≈ –0.64 for relative growth) and the Barnaul agglomeration (ρ ≈ –0.52), as well as in a number of medium-sized agglomerations in the European part, such as Kirov (ρ ≈ –0.45), Ulyanovsk (ρ ≈ –0.45), and Penza (ρ ≈ –0.47). In all these cases, the coefficients are statistically significant at р < 0.001, indicating pronounced demographic centralism: the periphery is effectively drawn toward the core, with remote settlements depopulating much faster than suburban zones.
Alongside the aforementioned cases, moderately strong negative correlations (ρ in the range of –0.3 to –0.4) were found for approximately half of the agglomerations. These include, for example, Perm (ρ ≈ –0.54), Orenburg (ρ ≈ –0.48), Chelyabinsk (ρ ≈ –0.259), Omsk (ρ ≈ –0.277), Novokuznetsk (ρ ≈ –0.417), Lipetsk (ρ ≈ –0.357), Krasnodar (ρ ≈ –0.350), Kama (ρ ≈ –0.327, although р > 0.1), and others. The Moscow agglomeration – the largest in the country – showed a relatively weak negative relationship: (ρ ≈ –0.128) (but with a huge n > 6000, so р ≈ 10–24). In other words, the influence of distance in the localities near Moscow is statistically significant but small: it is noticeable that, on average, distant parts of the Moscow Region lost population slightly more than nearby suburbs, but the variability is substantial. This is more likely explained by the fact that the actual influence of the Moscow agglomeration, expressed in positive population dynamics, extends far beyond its formal boundaries. The Saint Petersburg agglomeration demonstrated a more pronounced gradient: p ® -0.327 (p ® 10-36) for relative growth, indicating a clear concentration of growth around Saint Petersburg (essentially, growth in the core and nearest suburbs alongside depopulation in many remote territories of the Leningrad Region). At the same time, the Pearson coefficient for Saint Petersburg was close to zero (about -0.07), indicating some non-linearity: likely, the main population decline was concentrated in the most distant parts (>100 km from the city), while the intermediate zone (50–100 km) did not differ significantly from the suburbs, forming a two-tier structure of “suburban zone” and “distant periphery”.
It is important to note that no significant positive correlation between distance indicators and population growth was found in any of the examined agglomerations. In other words, there are no examples where more distant settlements systematically grew faster than closer ones. The closest to zero (and the only one with a positive sign) was the relationship in the Makhachkala agglomeration (ρ ≈ +0.14, р = 0.21, not significant) – essentially, no effect. In the Rostov agglomeration, the correlation was close to zero (ρ ≈ +0.054, р = 0.28), i.e., the growth/decline in the number of inhabitants in settlements weakly depends on the distance to Rostov-on-Don. A similar pattern is observed in the Tula agglomeration (ρ ≈ +0.014, р = 0.64) and a number of others: the absence of a significant gradient (with p ranging from -0.1 to +0.1) was recorded in eight agglomerations. Besides those mentioned above, these also include Saratov (p ~ -0.14, p ~ 0.07 — borderline significant), Krasnoyarsk (ρ ≈ +0.032, р = 0.76), Vladivostok (small p » +0,20, but the sample is small, p > 0.3), Kama (the polycentric agglomeration of Tatarstan with centers in Naberezhnye Chelny and Nizhnekamsk, ρ ≈ +0.003, р ≈ 0,95), and Caucasian Mineral Waters (p ® -0.257, p < 0.01 — significant but relatively small in magnitude). The absence of a pronounced distance-based gradient in these systems may be due to various reasons – from polycentricity or linear layout (as, for example, in the resort towns of Caucasian Mineral Waters, where there are several comparable centers and settlements are tied to them, not to a single core) to generally low-variability dynamics (in a number of agglomerations, the population is decreasing in all settlements, both near and far, under the influence of a general regional trend).
To illustrate the above, let us consider several illustrative cases:
Novosibirsk agglomeration. In the core – the city of Novosibirsk – the population increased from 1.47 to 1.62 million people (+10.2%) during the 2010s. The population of the near periphery (suburbs within a radius of ≈ 30 km, including satellite cities like Berdsk, Ob, and a number of settlements) also generally grew or remained stable. However, remote districts of the Novosibirsk Region (70–100 km or more from the city) lost a significant amount of population – in many villages, it decreased by 20–30% or more. As a result, at a distance of ≈ 10– 20 km from Novosibirsk, most settlements had R close to zero or positive; at ≈ 50 km – around zero or slightly negative; and beyond 70+ km – almost entirely significantly negative growth. Statistically, this is reflected in p ® -0.54. Thus, the Novosibirsk agglomeration represents a classic example of a large city drawing population from the periphery: nearby settlements benefit from integration into the urban economy (some rural residents move closer to the city, to the suburbs), while distant villages become depopulated.
Moscow agglomeration. Moscow, as a megacity, is unique in scale (over 12.5 million inhabitants in 2021). Since 2010, its population has grown by almost 2 million people, primarily due to migration influx. The population of the Moscow Region (the agglomeration’s periphery) also increased (+4%, from 7.1 to 7.4 million), but the growth is extremely unevenly distributed: satellite cities and settlements in the near belt (especially at distances of 5–30
km from the Moscow Ring Road) experienced a construction boom and population influx (e.g., Krasnogorsk, Domodedovo, dozens of settlements in New Moscow), while remote districts of the Region (70–100 km from the capital) stagnated or declined. Since Moscow’s near periphery is very extensive and includes thousands of settlements, and the distant periphery is represented by a relatively smaller number of settlements, the overall correlation effect is smoothed out. The calculated p « -0.13, although significant, is much weaker than in Novosibirsk. Nevertheless, the qualitative trend is the same: Moscow’s suburban ring is a zone of population attraction, while the outlying districts of the Moscow Region and adjacent regions (partially included in the agglomeration) experience outmigration. For the Moscow agglomeration, statistics confirm the classic center-periphery bias.
Rostov agglomeration . An opposite example is the almost complete absence of a center-periphery gradient. Rostov-on-Don is a large city (small population growth, +2.5%, to 1.13 million people in 2010–2021), but the surrounding territories have their own specificities. First, there are other cities nearby (satellite cities Taganrog, Bataysk, Novocherkassk), which themselves attract some migration. Second, the population of rural areas in the Rostov Region is generally declining not too intensively due to the relatively developed agriculture in southern Russia. As a result, the variation in growth rates in the periphery is large and not ordered by distance: there are remote stanitsas (Cossack villages) with population growth (e.g., districts with an influx of labor migrants), nearby villages with decline, and vice versa. The Spearman correlation is statistically zero, i.e., the agglomeration effect is not traceable. A similar situation is noted for a number of other agglomerations in the south and center of Russia, where demographic differences are determined more by historical-economic factors than by geography.
Caucasian Mineral Waters . This is a polycentric agglomeration: a number of resort towns (Pyatigorsk, Kislovodsk, Yessentuki, Mineralnye Vody, Georgievsk, Zheleznovodsk) are relatively equal in size and role. The periphery includes settlements around them. Here, there is not one capital center, but several, and the distance to one conditional core (we used Pyatigorsk in the calculations) only partially reflects a settlement’s actual connection to the centers. As a result, the coefficient p equals -0.257: a weak negative dependence, but significantly less pronounced than in monocentric agglomerations. In fact, this agglomeration is structured according to a different logic: each peripheral village is tied not so much to Pyatigorsk as to the nearest city, so the overall gradient is blurred.
Out of the 40 agglomerations, 18 exhibit a noticeable negative gradient (p < -0.3) between distance and population growth in the periphery. These include most agglomerations in Siberia and the Urals (Novosibirsk, Omsk, Kemerovo, Krasnoyarsk, etc.), a number of agglomerations in the Volga Region (Perm, Kazan, Ulyanovsk), and the Center (Kirov, Lipetsk, etc.). In almost all these cases, р < 0.001, meaning the effect is statistically highly significant.
Fifteen agglomerations have a moderately negative relationship (-0.3 < p < -0.1). These include, for example, the Moscow, Saint Petersburg, Yekaterinburg, Samara, Volgograd, Voronezh, Nizhny Novgorod agglomerations, and others. The significance of the effect varies: in megacities, due to the huge n , even p ~ -0.1 is reliable, while in some medium-sized cities, p ~ -0.2 is already borderline significant.
The remaining seven agglomerations did not show a significant trend (|p| < 0.1, р > 0.05): the Rostov, Tula, Krasnoyarsk, Makhachkala, Kama, and some other agglomerations. Here, either demographic dynamics are uniformly negative everywhere (all peripheral settlements are losing population at roughly the same rate, as in the Tula agglomeration), or various local factors are at play, leveling out the effect of distance (as in the Rostov agglomeration or Caucasian Mineral Waters).
Thus, the sign of the correlation between “distance – population growth” is universally negative or zero; no opposite tendency was found anywhere. This leads to an important conclusion: in no major urban region does the periphery as a whole grow faster than the areas close to the city. The agglomeration effect manifests in one form or another everywhere, although its scale varies significantly.
Discussion of results
The obtained results confirm the existence of an agglomeration (center-periphery) effect in the demographic dynamics of Russian urban agglomerations; however, its degree of expression depends on numerous circumstances. In most agglomerations, the principle of spatial polarization is clearly observed: the largest cities act as centers of population attraction, while the remote periphery stagnates or degrades. This conclusion aligns with previously noted general trends of urbanization in the post-Soviet space, where urban growth is accompanied by outmigration from rural peripheral territories. Quantitative analysis has shown that this trend is statistically significant at the aggregate level and is especially pronounced in a number of regional agglomerations (in Siberia, the Urals, and the Volga Region).
At the same time, the heterogeneity in the influence of distance between agglomerations indicates the presence of other important factors. For instance, a weakly expressed gradient in some agglomerations means that the spatial distribution of growing and shrinking settlements may be determined by specific local conditions, rather than simply by remoteness from the center.
Polycentricity and subcenters. In agglomerations with several large cities (examples include Caucasian Mineral Waters, as well as the Kazan-Naberezhnye
Chelny linkage in Tatarstan – two agglomerations in the region), residents of peripheral territories may migrate to the nearest sub-center, not necessarily the largest one. This smooths out a single radial gradient. More accurate results for such agglomerations would likely be obtained by calculating distances to the nearest core city, rather than to one fixed center.
Features of economy and settlement patterns. In agglomerations with developed agricultural or dacha (summer house) peripheries (e.g., the Rostov, Krasnodar agglomerations), population outflow may be less pronounced at greater distances, as the rural population there is more stable. Conversely, in resource-based regions (Kemerovo, Perm Territory), small mono-towns in the periphery may rapidly depopulate regardless of distance (influenced by the closure of enterprises). Such processes overlay the geographical factor.
Transport layout. The presence of high-speed transport arteries and suburban railway connections can expand a city’s zone of attraction. For Moscow and Saint Petersburg, for example, the distant periphery, if well-connected (commuter trains, highways), may remain more populated than the actual distance suggests. This complicates the dependency: the key parameter may not be geodesic distance, but travel-time accessibility. Our study did not use a road network graph, so for agglomerations with non-uniform transport accessibility (e.g., river barriers, mountains, lack of roads in certain directions), the results may be distorted.
General regional trends. If a region is depopulating overall (e.g., some regions in Central Russia), then all settlements around a city may be losing people – both near and far. Under such conditions, the correlation will be low, although the city may still fare somewhat better (its population declines more slowly). The results we obtained for the Tula and Saratov agglomerations align closely with this pattern: slight population decline, with minor and random differences.
The virtually complete absence of cases with positive correlation is noteworthy. This means that no agglomerations were found with an inverse effect, where the remote periphery would grow faster than the near periphery. Theoretically, this could occur if the agglomeration core were stagnating or losing population, while peripheral settlements were growing for some reason (e.g., due to residents relocating to the outskirts or development of the outer belt). However, even in steadily depopulating urban agglomerations (Kirov, Omsk), we observe the opposite picture: the core population is decreasing, but in the periphery, it declines even faster.
This indicates the radial spread of depopulation – when the economic problems of the center multiply in the periphery. In successful agglomerations, the growth of the core is complemented by the growth of the near periphery but does not reach the distant boundaries. Overall, the gradient of “better in the center, worse on the periphery” is observed everywhere, which aligns with the study’s initial hypothesis. Our conclusions about the demographic gradient are consistent with the patterns of migration attractiveness identified for Russian suburbs (Mkrtchyan, Gilmanov, 2023b).
It is also worth noting the differences between Pearson and Spearman coefficients observed in several cases. The Spearman coefficient revealed monotonic trends, while the Pearson coefficient was sometimes closer to zero (or even differed in sign for certain metrics). This suggests a non-linear dependency. Most often, such a situation arose when the near periphery of an agglomeration grew almost as actively as the core, while the distant periphery shrank. In this case, linear regression may yield a small slope (or an ambiguous slope depending on the weight of the groups), whereas rank correlation captures the overall decreasing trend. An example is the Krasnodar agglomeration: the population of Krasnodar grew rapidly (≈+32% over the decade), suburbs also showed high growth, but areas 60– 80 km away stagnated or experienced population decline. As a result, the Pearson coefficient for relative growth turned out to be insignificant (r ≈ +0.17, р = 0.04), while the Spearman coefficient was significantly negative (p ® -0.35, р = 1.9 x 10⁻⁵). Therefore, the dependency was clearly nonmonotonic: first, growth rates increase with distance (from the center to the suburbs), and then, after approximately 20–30 km, begin to fall as distance increases (transition to the remote periphery). Such two-zone models require more complex analysis (e.g., segmentation by distance or polynomial regression), which is beyond the scope of this study. However, it is important to emphasize that even in such cases, the periphery as a whole did not outpace the core: it is simply that the near periphery shares the success of the core, while the distant periphery does not. Such a two-step profile is characteristic of the largest agglomerations, where a broad “growth belt” forms around the city.
Several limitations of the study should be mentioned. First, the use of geodesic distance as the sole spatial metric simplifies reality. Future research could incorporate road network distance or travel time, which would likely improve the model’s explanatory power (especially for agglomerations with complex geography). However, such calculations are very labor-intensive and require not only specialized software but also an actual road network graph for all of Russia. Second, correlation analysis reveals a relationship but does not prove a direct cause-and-effect dependency. The negative correlation between distance and population growth indicators aligns with the hypothesis that proximity to a city promotes growth (due to the availability of jobs, infrastructure, etc.).
However, reverse influences are also possible: for example, rapidly growing suburban settlements may become administratively closer to the city (incorporated into its boundaries), i.e., the agglomeration itself may expand, absorbing developing settlements. Such cases are accounted for in our data (the “periphery” status was retained even if a settlement formally became part of the city limits). Nevertheless, in this study, we do not equate correlation with causation. Third, factors such as settlement size and initial population size were not considered. It is possible that large subcenters (district centers) in the periphery have their own drivers of growth or resistance to decline, independent of the main city. A more complex regression model could include variables of initial population, economic profile, etc. Here, however, we focused precisely on the paired dependency on geography, which, of course, simplifies the multidimensional nature of socio-ecological-economic space.
The results of the study are significant for state policy and territorial development planning. The identified agglomeration effect means that, all else being equal, the most remote settlements of agglomerations are at risk of demographic decline. This should be considered when developing measures to support the rural periphery – it may be necessary to stimulate economic activity not only in the main city but also in key peripheral nodes (sub-centers) to extend the positive influence of the center in space. The Spatial Development Strategy of the Russian Federation declares the need for balanced development of agglomerations; however, our data shows that this balance is often not yet achieved: cores confidently outpace the outskirts in demographic dynamics. This is particularly acute in eastern regions, where distances are great and population density is low: without targeted efforts, further concentration of population in a few points with extensive depopulated peripheral territories may occur.
On the other hand, the presence of suburban growth zones around megacities (Moscow, Saint Petersburg, Kazan, Krasnodar, etc.) indicates the spread of urbanization – the phenomenon of suburbanization, where part of the population prefers to settle outside the city but close to it. This is a positive aspect in terms of relieving pressure on cities, but it increases the load on the transport system and requires the formation of polycentric agglomeration frameworks. Planning solutions, such as creating new points of attraction (technoparks, social facilities) in the periphery, could smooth out excessively sharp gradients, but, as experience shows, they cannot be completely eliminated: a large city will still remain more attractive. Nevertheless, the blurring of the agglomeration effect (for example, in the Rostov or Krasnodar agglomerations, where the periphery is growing relatively) can be regarded as a sign of more uniform development of the agglomeration territory. State policy should strive for precisely such equalization, supporting peripheral settlements so that they do not lag too far behind the core.
Conclusion
This study presents a comprehensive analysis of the influence of the agglomeration effect – the factor of distance to the urban center – on the population dynamics of peripheral settlements located within agglomerations. The research object comprised 40 urban agglomerations in Russia for the period 2010–2021, using statistical comparison of distances and demographic indicators for tens of thousands of settlements as the methodology. The following key findings were obtained.
In almost all agglomerations, a negative relationship is observed between a settlement’s distance from the core city and its population growth rate. On average for Russia, the Spearman coefficient ρ ≈ –0.12 for relative growth, which, although not high in absolute value, is statistically significant and indicates an entrenched centerperiphery gradient: the distant periphery contributes less to the agglomeration’s population growth, often showing decline, while core cities and their immediate surroundings grow.
The strength of the agglomeration effect varies significantly. In approximately half of the agglomerations, the gradient is strong (ρ < –0.3), reaching peak values in the Novosibirsk, Irkutsk, and Barnaul agglomerations (ρ ≈ –0.5). In another third of cases, the relationship is moderate (ρ ≈ –0.2), and only about 20% of agglomerations show no significant influence of distance (within statistical error). No positive correlations were found in any case, meaning nowhere does the periphery outpace the core in demographic rates.
In a number of agglomerations, a non-linear nature of the dependency was identified: close suburbs may grow almost as fast as or faster than the city itself (a suburbanization effect), creating a locally positive relationship at short distances. However, beyond a certain radius, the trend reverses to negative (distant villages lag sharply). Overall, two zones can be distinguished: an inner periphery (roughly 0–30 km), gravitating toward and often benefiting from the core’s growth, and an outer periphery (50 km and beyond), gradually losing population. The boundary between them is blurred and depends on the specific city (larger for megacities). This two-zone pattern results in the Pearson coefficient being close to zero, while the Spearman coefficient captures the overall decline in indicators with increasing D . The use of both coefficients in the study allowed for revealing these nuances.
The results indicate the need to pay increased attention to the development of the remote peripheries of agglomerations. Without support, these territories risk continuing demographic decline, exacerbating the imbalance between center and periphery. Simultaneously, the growth of suburban zones requires integrated planning – creating infrastructure, transport links, and jobs in new development areas so that the agglomeration develops harmoniously. The methodology applied in the study (spatial analysis merging statistical and geographical data) can be used to assess subsequent periods or to test the influence of other factors (road accessibility, industrial development, migration flows).
In conclusion, we emphasize that the agglomeration (center-periphery) effect is clearly present in the demography of Russian urban agglomerations, though its scale varies. The work supplements qualitative understanding with quantitative measurements. The obtained data can serve as a basis for further research on urbanization and for making informed decisions within the framework of implementing the strategy for balanced spatial development of the country and regions of Russia.
