The influence of the metallurgical corporation owners’ interests over the financial performances of the parent enterprise (in the case of OJSC “Severstal”)
")
Author: Povarova Anna Ivanovna
Journal: Economic and Social Changes: Facts, Trends, Forecast @volnc-esc-en
Section: Development strategy
Article in issue: 5 (17) т.4, 2011.
Free access
The article represents the new results of the ongoing researches “The influence of the metallurgical corporation owners’ interests over the national and regional development”, which are carried out in the ISEDT RAS under the direction of Doctor of Economics, Professor V.A. Ilyin. The first article, which dealt with that problem, represented the analysis of the financial and economical activity of the largest ferrous metallurgy corporations in Russia (OJSC “Severstal”, Novolipetsk Steel, Magnitogorsk Iron and Steel Works) with all their segments on the basis of the reports prepared by the international standards. However, those reports didn’t contain sufficient information about the parent enterprises of the corporations. This article analyzes the financial and economic activity of OJSC “Cherepovets Iron and Steel Complex “Severstal”. The analysis is performed according to the annual account submitted in accordance with Russian Accounting Standards (RAS) and published on the official website of the company
Ojsc "severstal", owners' interests, results of the financial and economical activity
Short address: https://sciup.org/147223295
IDR: 147223295 | UDC: 334.7(470.12)
Text of the scientific article The influence of the metallurgical corporation owners’ interests over the financial performances of the parent enterprise (in the case of OJSC “Severstal”)
Key results of the enterprise’s financial and economic activity in 2010
The main factor determined the activity of OJSC “Severstal” in 2010 was a recovery of demand and prices for steel products. The world steel consumption grew by 17%, Russian consumption – by 38%.
The company managed to overcome the crisis decline in production; it increased its production volume by 2.7% in comparison with 2008. Increase in both export and domestic prices contributed to a significant gain in sales, primarily in the markets of the Russian Federation – almost by 35%.
As a result, products sold proceeds increased by 1.5 times in comparison with 2009, but its pre-crisis level was not restored (tab. 1) .
However, the increase in revenue (46%) outstripped the production growth (17.7%). This fact proves that the increase in revenues was achieved mainly due to advance in marketprice, rather than expansion of production.
When we speak about production development, we should note that corporate management channeled considerable resources in 2008 – 2010 to implement the chosen strategy which was oriented to the vertical integration through mergers and acquisitions in the external mar- kets. According to the annual account of funds flow, they spent over 100 billion rubles, or almost 40% of investment costs, to purchase the subsidiaries (tab. 2).
The growth rate of cost value (150.7%) outpaced the growth in revenues (146%) in 2010, which was the reason for the reduction of product profitability. At the same time all the costs components included in the profit margin index increased significantly. Cost value growth and low sales volume didn’t indemnify for the crisis fall in gross margin. Although it increased by one third in comparison with 2009 (tab. 3) .
Table 1. The main business process perspectives of OJSC “Severstal” in 2008 – 2010
|
Indicators |
2008 |
2009 |
2010 |
2010 in % to |
|
|
2008 |
2009 |
||||
|
Total output, thousand tons* |
19196 |
16760 |
19722 |
102.7 |
117.7 |
|
Sales volume, thousand tons |
10197 |
8675 |
10201 |
100.0 |
117.6 |
|
Including: domestic market |
6271 |
4069 |
5478 |
87.4 |
134.6 |
|
external market |
3926 |
4606 |
4723 |
120.3 |
102.5 |
|
Average price for steel products, doll./tons |
1001 |
604 |
723 |
72.2 |
119.7 |
|
Including: domestic market |
1073 |
710 |
816 |
76.0 |
114.9 |
|
external market |
778 |
486 |
585 |
75.2 |
120.4 |
|
Sale proceeds, billion rubles |
243.6 |
143.6 |
209.8 |
86.1 |
146.1 |
* Total output of pig iron and crude steel.
Sources: annual account of OJSC “Severstal” for the period of 2009 – 2010; calculations by ISEDT RAS.
Table 2. Subsidiaries acquisition expense of OJSC “Severstal”
|
Indicators |
2008 |
2009 |
2010 |
Total for 2008 – 2010 |
|
Investment costs, bln. rub. |
132.8 |
67.1 |
83.5 |
283.4 |
|
Acquisition costs, bln. rub. |
48.6 |
31.0 |
24.2 |
103.8 |
|
Percentage to investment costs |
36.6 |
46.2 |
29.0 |
36.6 |
|
Sources: Annual account of OJSC “Severstal” for the period of 2009 – 2010; calculations by ISEDT RAS. |
||||
Table 3. Cost value and gross margin of OJSC “Severstal” in the period of 2008 – 2010, bln. rub.
|
Indicators |
2008 |
2009 |
2010 |
2010 in % to |
|
|
2008 |
2009 |
||||
|
Cost of revenue, total |
157.4 |
104.5 |
157.5 |
100.0 |
150.7 |
|
Raw materials |
98.2 |
67.6 |
116.0 |
118.1 |
171.6 |
|
Fuel |
4.9 |
6.7 |
8.3 |
169.4 |
123.9 |
|
Electric power |
6.1 |
4.0 |
5.3 |
86.9 |
132.5 |
|
Remuneration of labour |
10.5 |
6.6 |
7.2 |
68.6 |
109.1 |
|
Gross margin |
86.2 |
39.0 |
52.3 |
60.7 |
134.1 |
|
Profit margin, % |
30.3 |
17.8 |
16.5 |
-13.8 p.p. |
-1.3 p.p. |
Sources: Annual account of OJSC “Severstal” for the period of 2009 - 2010; calculations by ISEDT RAS.
Table 4. Quarterly expense and profit dynamics of OJSC “Severstal” in 2010, bln. rub.
|
Indicators |
I qu. |
II qu. |
III qu. |
IV qu. |
2010 |
|
Commercial expenses |
2.2 |
2.4 |
2.5 |
2.8 |
9.9 |
|
Executive expenses |
1.6 |
1.9 |
2.2 |
2.1 |
7.8 |
|
Interest payable |
2.6 |
2.8 |
2.8 |
2.6 |
10.8 |
|
Other expenses |
5.1 |
10.3 |
8.6 |
73.5 |
97.5 |
|
Total expenses |
11.5 |
17.4 |
16.1 |
81.0 |
126.0 |
|
Profit, loss (-) before tax assessment |
10.4 |
6.4 |
7.3 |
-58.2 |
-34.1 |
|
Net profit, loss (-) |
8.4 |
5.0 |
5.8 |
-58.8 |
-39.6 |
|
Sources: Annual account of OJSC “Severstal” for the period of 2009 – 2010; calculations by ISEDT RAS. |
|||||
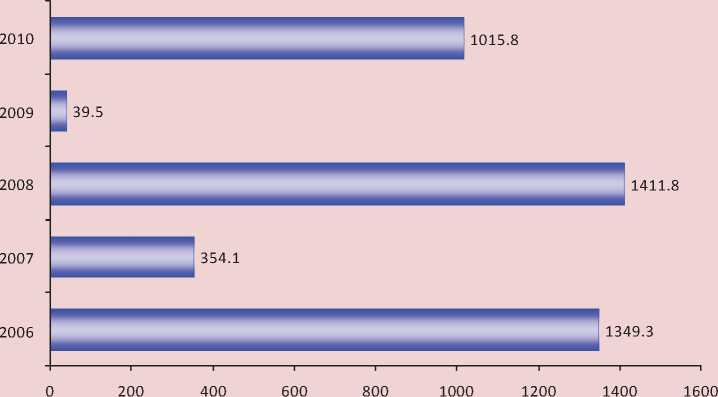
Figure 1. Financial performance dynamics of OJSC “Severstal” for the period of 2008 – 2010, bln. rub.
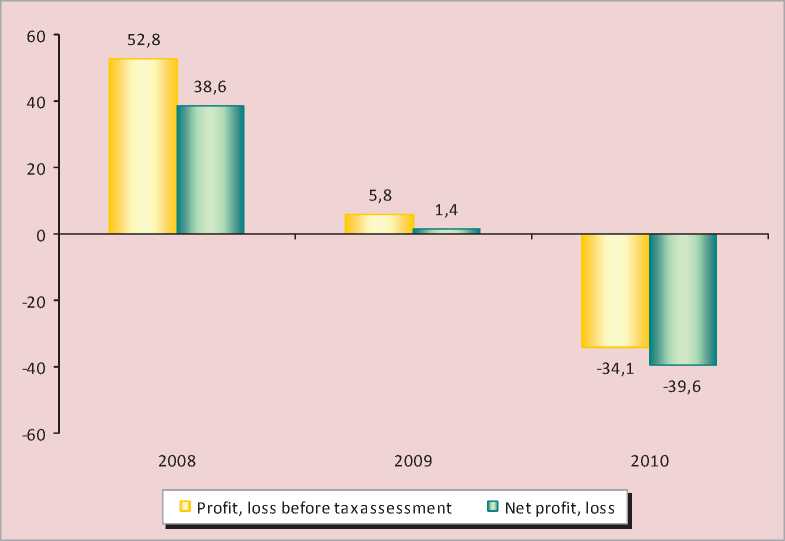
It would seem that the company had to increase the tax base due to the significant increase in gross margin in 2010. However, the annual account proves the contrary of it: the loss amounted to 34 billion rubles before the tax assessment for 2010. As a result, the year was completed with the net loss of 39.6 billion rubles. Severstal had a profit for the tax purposes and net profit even in 2009 when there was a crisis large-scale collapse of revenues (fig. 1) .
In order to understand the causes of the Company’s loss, it is necessary to analyze the quarterly formation of the final financial performance in 2010.
It is known that the expenses which are not included in the sold production price index influence over the size of taxable profit. They are commercial, executive, interest and other expenses, including the reserves created for investment depreciation.
Table 4 contains the characteristics of expense and profit dynamics of OJSC “Severstal” in 2010.
This tables shows that OJSC “Severstal” operated in the black over three quarters of 2010, but it incurred losses in the fourth quarter which exceeded the consolidated returns for nine months almost by 2.5 times. The main source of loss was a rising scale of other
Figure 2. The cost of long-term and short-term investments of OJSC “Severstal” and the cost of the reserves created for their depreciation in 2008 – 2010, bln. rub.
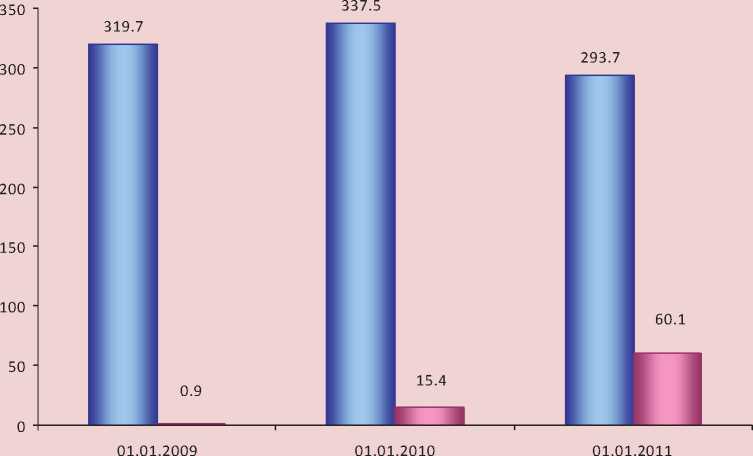
□ Fina ncia l investments □ Reserves
expenses, which accounted for almost 80% of the costs included in the calculation of taxable income. In addition, the dynamics of other expenses remained stable during first three quarters, but they increased greatly by 8.5 times from 8.6 billion rubles to 73.5 billion rubles.
According to “Other income and expenses itemization” the reserves created for investment depreciation amounted to more than 60% of the other expe nses3.
The dynamics of the company’s financial investments in 2008 – 2010
OJSC “Severstal” was increasing the value of financial investments during the period from 2008 till 2010 (fig. 2) .
The vast majority of financial investment (75 – 80%) was directed to the authorized capital stocks of the subsidiaries and affiliates. On average, about 15% of the investments were used to take up the loans (tab. 5) .
93% of the total investments to the authorized capital stocks were the share of the management companies which were the controlling shareholders of other companies. They formed the main reserves for investment depreciation (tab. 6) .
The Cyprus Management Company Upcroft Limited sold 50.8% of its share in the Italian company Lucchini S.p.A for 1 euro to A.A. Mordashov in June, 2010. At the same time, net wealth of Lucchini, valued by the estimated value without sale costs, amounted to a negative sum.
Table 5. The structure of financial investments of OJSC “Severstal” in 2008 – 2010
|
Indicators |
2008 |
2009 |
2010 |
|||
|
bln. rub. |
share, % |
bln. rub. |
share, % |
bln. rub. |
share, % |
|
|
Financial investments, total |
319.7 |
100.0 |
337.5 |
100.0 |
293.7 |
100.0 |
|
Investments to the authorized capital stocks of other organizations |
239.3 |
74.8 |
253.2 |
75.0 |
232.6 |
79.2 |
|
Securities of other organizations |
2.1 |
0.7 |
0.8 |
0.2 |
0 |
0 |
|
Loans granted |
48.6 |
15.2 |
55.6 |
16.5 |
37.9 |
12.9 |
|
Deposits |
27.5 |
8.6 |
26.2 |
7.8 |
20.9 |
7.1 |
|
Others |
2.2 |
0.7 |
1.7 |
0.5 |
2.3 |
0.8 |
Sources: Annual account of OJSC “Severstal” for the period of 2009 – 2010; calculations by ISEDT RAS.
Table 6. The cost of OJSC “Severstal’s” financial investments to the subsidiaries and the reserves created for investment depreciation in 2010, bln. rub.
|
Name of organization |
Location |
Basic activity |
Value of investments at the end of 2010 |
Reserve |
|
Upcroft Limited |
Cyprus |
Management |
29707.2 |
29707.2 |
|
“Holding Mining Company” LLC |
Cherepovets |
Management |
140832.2 |
14492 |
|
Severstal Investments LLC |
The USA |
Management |
37713.9 |
7204.1 |
|
Severstal US Holdings LLC |
The USA |
Management |
58008.7 |
7159.1 |
|
Waytrend Limited |
Cyprus |
Management |
2568.6 |
859.1 |
|
Baracom Limited |
Cyprus |
Management |
3959.1 |
661.1 |
|
“Promzhilstroy” LLC |
Cherepovets |
Construction |
34.3 |
34.3 |
|
“Severstalskrap-Komi” LLC |
Vorkuta |
Iron-and-steel scrap procurement |
11.7 |
11.7 |
|
Total |
272835.7 |
60128.6 |
||
|
Sources: Annual account of OJSC “Severstal” for 2010. |
||||
In this regard, investment depreciation in the company Upcroft Limited was used in corpore to create the reserve that increased the costs of OJSC “Severstal” almost by 30 billion rubles.
The real investment cost in the company Severstal US Holdings LLC was reduced by 15 billion rubles at the expense of the sale of three steel mills with negative net assets which were located in the USA (the reserve was formed for the entire selling price of doll. 225 million or nearly 7 billion rubles). The investment cost was also reduced by the discounting of the future cash flows of two U.S. factories where Severstal US Holdings LLC was a controlling shareholder. As OJSC “Severstal” shares 47.7% in the company Severstal US Holdings LLC directly, as well as it has the remaining shares indirectly through its subsidiaries Severstal Investments LLC and Baracom Limited, so the amount of admitted reserve was distributed to three companies (Severstal US Holdings LLC – 7.2 billion rubles;
Severstal Investments LLC – 7.2 billion rubles; Cyprus Limited – 0.7 billion rubles).
The financial investment depreciation of 14.5 billion rubles was found in LLC Holding Mining Company mainly in the gold and coal mines where that company was a controlling shareholder.
They created the reserve in the amount of stable (over a year) decline in financial investment (0.9 billion rubles) for another Cypriot management company Waytrend Limited.
Overall, nearly 80% of the depreciation losses charged to the financial performance of the parent company were invested in the authorized capital stocks of the foreign management companies. They were the controlling shareholders of the unprofitable foreign companies which were bought by OJSC “Severstal” leaders in 2004 – 2008. Three of them went into liquidation in 2010.
Thus, the reserve created for investment depreciation caused the increase in other expenses. It was a key unprofitability factor for OJSC “Severstal” in 2010.
Excluding the reserve cost, the company’s profit before taxation amounted to 26.1 billion rubles, net profit – 20.5 billion rubles and additional budget revenues – 0.9 billion rubles (tab. 7) .
Dynamics in the commercial, executive, interest payable and other expenses which are accountable for taxation
Cost escalation influenced greatly over the company’s financial performances. Cost escalation amounted to 23% of the expenses which were used for taxation. This conclusion is clearly illustrated by figure 3, which represents the dynamics in the commercial, executive, interest payable expenses over the last three years.
Table 7. Influence of the subsidiaries’ investment depreciation over the financial performance of OJSC “Severstal” in 2010, bln. rub.
|
Indicators |
2010 |
|
Profit (loss)* before depreciation declaration |
26.1 |
|
Profit (loss) after depreciation declaration |
(34.1) |
|
Current profit tax** (According to the report, f. № 2 by OAO Severstal) |
4.3 |
|
Profit tax accrued on the amount of the profit before depreciation declaration*** (26073 bln. rub.) |
5.2 |
|
Profit tax which wasn’t remit to the budget (estimation) |
0.9 |
|
Net profit (loss) before depreciation declaration |
20.5 |
|
Net profit (loss) after depreciation declaration |
(39.6) |
|
* Financial performance before taxation. ** The current profit tax is calculated by OJSC “Severstal” on the assumption of the reference expense adjusted for permanent tax liabilities, deferred tax assets and deferred tax liabilities of the reporting period. *** Because of the difficult calculating methodology of the current profit the tax is calculated by ISEDT RAS based on the amount of the potential profit and the current tax rate of 20%. Sources: f. № 2 “Profit and Loss”, the annual report of OJSC “Severstal” for 2010; calculations by ISEDT RA S. |
|
Table 8. The share of commercial and executive expenses in the gross margin of OJSC “Severstal”
|
Indicators |
2007 |
2008 |
2009 |
2010 |
|
The total volume of commercial and executive expenses, bln. rub. |
10.8 |
12.3 |
13.4 |
17.7 |
|
The share in gross margin,% |
15.8 |
14.3 |
34.4 |
33.8 |
|
Sources: Annual account of OJSC “Severstal” for the period of 2007 – 2010; calculations by ISEDT RAS. |
||||
Table 9. The share of interest payable expenses in the profit on sales of OJSC “Severstal”
|
Indicators |
2007 |
2008 |
2009 |
2010 |
|
Interest payable expenses, total, mln. rub. |
2387.3 |
5940.2 |
8936.9 |
11008.5 |
|
Interest charges, mln. rub. |
2387.3 |
4675.8 |
8836.0 |
10798.2 |
|
Loan servicing expenses, mln. rub. |
0 |
1264.4 |
100.9 |
210.3 |
|
The share in the profit on sales, % |
4.1 |
8.0 |
34.9 |
31.8 |
|
Sources: Annual account of OJSC “Severstal” for the period of 2007 – 2010; calculations by ISEDT RAS. |
||||
Table 10. The credits and loans received by OJSC “Severstal”, bln. rub.
|
Indicators |
2007 |
2008 |
2009 |
2010 |
|
Received credits and loans |
0.5 |
84.4 |
16.0 |
31.8 |
|
Credit and loan indebtedness |
26.2 |
127.1 |
141.1 |
147.8 |
|
Debt load, % * |
8.5 |
41.0 |
45.3 |
55.3 |
|
Net asset value |
284.1 |
309.6 |
311.4 |
267.5 |
|
* It was calculated by ISEDT RAS as the ratio of Credit and loan indebtedness to net assets. Sources: Annual account of OJSC “Severstal” for the period of 2007 – 2010. |
||||
Figure 3. Dynamics in the manufacturing expenses of OJSC “Severstal“, which are included in the calculation of taxable income in 2008 – 2010, bln. rub.
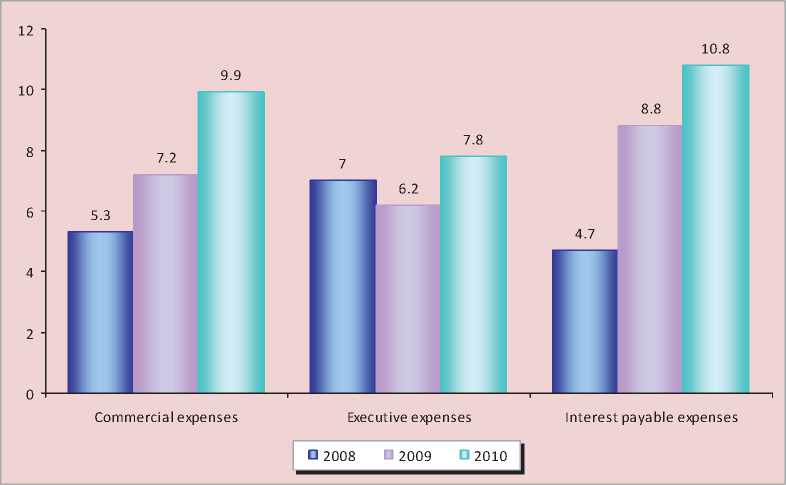
Commercial expenses increased by 85% over three years. Executive expenses grew less rapidly, because the company was forced to optimize them in 2009. However, executive expenses had grown again by the end of 2010. The volume of executive expenses amounted to two thirds of the wage fund (67.5% in 2008; 65.3% in 2009; 76.5% in 2010). Both commercial and executive expenses ate up more than a third of gross margin in 2009 – 2010 and reduced the income for tax purposes (tab. 8) .
Steady rising of interest payable expenses for the use of credit resources was the most important for the reduction of the tax base. Interest payable expenses4 had already increased by 1.5 times in 2009, and they had increased by 1.2 times by the end of 2010. It took more than a third of operating profit of OJSC “Severstal” to pay interests on the loans and pay for debt service in 2009 – 2010 (tab. 9) .
Such growth was the result of the large-scale borrowing of OJSC “Severstal” (tab. 10) .
The increase in debt on the borrowed funds and simultaneous reduction of financial investments promoted the decline in net asset value and the increase in debt load of the company from 40 – 45% in 2008 – 2009 up to 55% in 2010.
The principal creditor of OJSC “Severstal” is a public company Steel Capital S.A incorporated under the laws of Luxembourg. More than half of foreign loans are in its name (tab. 11) .
The largest credits and loans were taken in 2007 – 2008:
-
• in EBRD (credit contract of 17.12.2007) – 600 million euro;
-
• in Steel Capital S.A (credit contract of 29.07.2008) – 1250 million dollars;
-
• Deutsche Bank AG (credit contract of 22.09.2008) – 1200 million dollars.
EBRD credit payment term is December, 2017; two other credits must be canceled in September, 2013.
Table 11. Debt liability of OJSC “Severstal” in the context of creditors, bln. rub.*
|
Creditor |
Remaining debt |
|
|
01.01.2010 |
01.01.2011 |
|
|
Steel Capital S.A (the USA) |
49.1 |
58.5 |
|
The European Bank for Reconstruction and Development (EBRD) |
16.9 |
18.8 |
|
VTB Bank Europe (UK) |
2.7 |
0.9 |
|
Deutsche Bank AG, Amsterdam |
36.3 |
26.8 |
|
OJSC Sberbank of Russia |
5.1 |
5.1 |
|
CJSC Severgal |
0 |
2.7 |
* The debt was recounted by ISEDT RAS at the rate of euro and dollar on 31.12.2009 and on 31.12.2010. Sources: Annual account of JSC Severstal for the period of 2007 – 2010; calculations by ISEDT RAS.
Table 12. OJSC “Severstal’s” account payable
|
Indicators |
2008 |
2009 |
2010 |
|||
|
bln. rub. |
Share, % |
bln. rub. |
Share, % |
bln. rub. |
Share, % |
|
|
Account payable, total |
154.2 |
100.0 |
165.2 |
100.0 |
189.9 |
100.0 |
|
Including: to suppliers and contractors |
13.4 |
8.7 |
14.9 |
9.0 |
25.3 |
13.3 |
|
loans and credits |
127.1 |
82.4 |
141.1 |
85.4 |
147.8 |
77.8 |
|
taxes-and-duties |
0.5 |
0.3 |
1.1 |
0.7 |
0.6 |
0.3 |
|
other |
13.2 |
8.6 |
8.1 |
4.9 |
16.2 |
8.5 |
|
Current liquidity ratio, %* |
2.71 |
2.88 |
1.60 |
|||
|
Own circulating assets |
-38.6 |
-52.9 |
-64.4 |
|||
* It was calculated by ISEDT RAS as the ratio of current assets to short-term debt liabilities.
The buyup of unprofitable North American assets (its peak was in 2008) was likely to be made due to those loans.
OJSC “Severstal” took up the currency credit for doll. 1 billion in Steel Capital SA for the period of 7 years in October, 2010.
Thus, Severstal employees would have to work to pay these credits, most of which were used to meet a lack of their own circulating assets of Severstal’s foreign business in the form of loans. In order to analyze the credit history of OJSC “Severstal” it is important to consider not only the debt liabilities, but account payable of Severstal, paying particular attention to the calculations of payments to the budget (tab. 12) .
The cumulative account payable increased by 1.2 times during 2008 – 2010 mainly due to debt liabilities (credits and loans) and trade debt. It was the main reason for the decline of asset liquidity. The current liquidity ratio was 2.88 even during the crisis in 2009; it dropped to 1.60 in 2010 (in world practice if the value of current liquidity ratio is below one, it indicates the company’s insolvency).
The company’s relationship with the budget
In 2010 OJSC “Severstal” could significantly reduce the arrears in budget payments. But it is still about 500 million rubles. The arrears in budget payments are characterized again by the growth over six months in 2011 (fig. 4) . Meanwhile, the size of the deposits amounted to more than 20 billion rubles at the end of 2010. So, they can solve all the problems related to settlements with the budget.
According to the annual reports of OJSC “Severstal”, the Company didn’t take part in judicial proceedings in the period from 2008 till 2010. Such proceedings could influence over its financial and economic activities. We should note that although OJSC “Severstal” had large account payable during sharp decline in tax revenues to all levels of budget system, there were no claims to the company by the tax administrations of the Vologda Oblast.
OJSC “Severstal” also had the arrears in budget payments on value-added tax (VAT). It amounted to more than 1 billion rubles at the beginning of 2011 (fig. 5) .
Figure 4. Dynamics of the arrears in budget payments of OJSC “Severstal”, mln. rub.
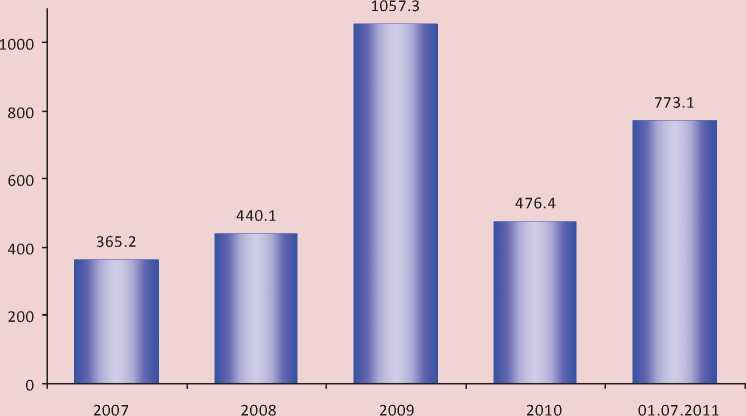
Figure 5. Dynamics of the budget accounts receivable on value-added tax, mln. rub.
Annual reports of Severstal do not contain comments on this debt. However, it can be assumed that it is a debt of the federal budget which requires VAT paid on export goods.
Since the Russian accounting standards do not reflect the amount of VAT calculated by the payer to refund the budget, let’s use the annual reports of OJSC “Severstal” which is compiled by international standards. According to these data5, the company filed for VAT refund in the amount of doll. 1.3 billion or 36.5 billion rubles5 (tab. 13).
Table 13. VAT charged to be reimbursable from the budget to OJSC “Severstal” in 2006 – 2010, bln. rub.
|
Indicators |
2006 |
2007 |
2008 |
2009 |
2010 |
Total for 2006 – 2010 |
|
Reimbursable VAT, total |
6635.8 |
6180.2 |
8358.7 |
6789.3 |
8491.5 |
36455.6 |
|
Including: Russian Steel |
5446.0 |
5280.6 |
6850.4 |
5211.4 |
6725.8 |
29514.2 |
|
Severstal Resources |
1189.8 |
899.6 |
1508.3 |
1577.9 |
1765.8 |
6941.4 |
Sources: Annual account of OJSC “Severstal” according to IFRS for the period of 2007- 2010; calculations by ISEDT RAS.
Table 14. VAT which was assigned to be pay in the budget and to be repay from the budget in 2006 – 2010
|
Indicators |
The Russian Federation |
The Vologda Oblast |
||||||||||
|
2006 |
2007 |
2008 |
2009 |
2010 |
2006 – 2010 |
2006 |
2007 |
2008 |
2009 |
2010 |
2006 – 2010 |
|
|
VAT which was assigned to be pay in the budget, bln. rub. |
1858 |
1340 |
2127 |
2341 |
2527 |
10193 |
5.1 |
9.9 |
14.3 |
12.2 |
9.6 |
51.0 |
|
VAT which was assigned to be repay from the budget, bln. rub. |
811 |
278 |
922 |
1110 |
1122 |
4243 |
2.2 |
2.4 |
4.0 |
7.7 |
6.6 |
22.9 |
|
In % of the gross amount |
43.7 |
20.7 |
43.4 |
47.4 |
44.4 |
41.6 |
42.4 |
24.3 |
28.0 |
63.4 |
68.6 |
45.0 |
|
Actual compensation, bln. rub. |
no data |
no data |
1104 |
963 |
no data |
no data |
no data |
4.0 |
7.5 |
no data |
||
Sources: the reports of Federal Tax Service of Russia; the reports of the Federal Tax Service in the Vologda Oblast, calculations by ISEDT RAS.
Export VAT refund leads to the substantial loss of federal revenues. According to the Federal Tax Service of Russia, the amount of the returned VAT for the whole country amounted to more than 2.2 trillion rubles in the period of 2009 – 2010. This amount could completely close the federal budget deficit (1.8 trillion rubles in 2010) or it could make up for a chronic shortage of the Pension Fund (over 1 trillion rubles). So this amount could become the financial basis of modernization.
According to the reports of the Federal Tax Service in the Vologda Oblast, there were 23 billion rubles of VAT which was assigned to be returned to Vologda taxpayers in the period from 2006 till 2010. It was almost a half of the gross amount of VAT payable to the budget and two-thirds – in 2009 2010 (tab. 14) .
With an unprecedented deficit of the budgetary system of the Vologda Oblast in the last decade (6.5 billion rubles and 6.9 billion rubles respectively) in the period from 2009 to 2010 the amount of VAT which was assigned to be repay from the budget could cover the deficit at the expense of additional transfers from the federal budget in the form of grants for balance. Meanwhile, the Vologda Oblast was one of the most vulnerable to the crisis effects among the regions of Russia. So it received that grant which amounted to 3.2 billion rubles in 2009 and only 681 million rubles in 2010.
The existing practice of the VAT refund is nothing more than as a form of tax concession6. According to the Federal Customs Service7, on the average several large exporters of oil, gas, ferrous and nonferrous metals receive 75% of export VAT. But do these exporters really need tax eases? For example, the tax component of OJSC “Severstal” is very low – less than 10% of expenses.
Net profit, if we do not take into account the crisis years, was 16 – 22% of revenues, that is, corporate earnings covered the amount of VAT which was assigned to be repay from the budget (tab. 15) .
The scheme of VAT refund which is legalized in Russia reduces the effectiveness of tax policy. It is clear that the new deputies of the State Duma must decide on the VAT abolition to the companies exporting abroad raw materials and products of primary processing.
The leaders of Severstal were actively providing loans primarily to the related parties during the period from 2008 till 2010. They spent 160 billion rubles or nearly 20% of total expenditure to these purposes. The lending peak was in crisis 2009 (tab. 16) .
According to the cited data, a third of loans issued in 2009 almost two-thirds of loans issued in 2010 fell to the U.S. companies of Severstal. As it had been emphasized time and again, all those companies were unprofitable.
Consequently, the management corporation was forced to maintain them using the funds of their parent company, including the loans.
In 2010 three American steel companies (they are mentioned in the table) were classified on the balance sheet as assets held for sale. Those companies had loans which amounted to 10.3 billion rubles. Before their sale, those loans were transferred to the reserves for loans investment depreciation (10.2 billion rubles) and doubtful accounts receivable related to the repayment of accrued interest (0.1 billion rubles) and attributed to the loss of OJSC “Severstal”. Consequently, the direction of the holding refused to recover the loans which were issued to American subsidiaries, thereby they increased the loss of the parent company in 2010.
Thus, debts to the budget which amounted to 1.5 billion rubles and deteriorated financial performance in the period from 2009 till 2010
Table 15. Taxes-and-duties payment of OJSC “Severstal” to the budget system of the Russian Federation, bln. rub.
|
Indicators |
2006 |
2007 |
2008 |
2009 |
2010 |
|
Paid taxes-and-duties, bln. rub. |
12.6 |
21.7 |
24.9 |
2.2 |
7.4 |
|
In % to current expenses |
7.8 |
10.5 |
9.5 |
1.5 |
3.2 |
|
Net profit, bln. rub. |
35.1 |
42.1 |
38.6 |
1.4 |
0 |
|
In % to profit |
21.9 |
21.8 |
15.8 |
0.9 |
0 |
|
Sources: Annual account of OJSC “Severstal” according to IFRS for the period of 2007 – 2010; calculations by ISEDT RAS. |
|||||
Table 16. The loans, which are issued by OJSC “Severstal” to the related parties, bln. rub.
|
Indicators |
2008 |
2009 |
2010 |
|
Issued loans*, total |
49635.4 |
58647.5 |
51475 |
|
In % to general expenses |
12.4 |
24.9 |
14.4 |
|
Including foreign enterprises (North America)** |
12753.7 |
18418.5 |
33538.9 |
|
In % to the total value of issued loans |
25.7 |
31.4 |
65.2 |
|
including the loans to the companies, total |
2814.9 |
7615.9 |
10313.3 |
|
Severstal Sparrows Point LLC (the USA) |
0 |
4740.9 |
7349.8 |
|
Severstal Wheeling Inc (the USA) |
2332.3 |
2392.4 |
2437.8 |
|
Severstal Warren (the USA) |
482.6 |
482.6 |
525.7 |
|
* Including percents. ** Loans in U.S. dollars are converted by ISEDT RAS in the ruble equivalent on the basis of foreign exchange rates established by the Central Bank. Sources: an explanatory note to the annual report of OJSC “Severstal” for the period from 2009 to 2010; Report about cash flows for the period from 2009 to 2010; calculations by ISEDT RAS. |
|||
Table 17. The guarantees, issued by OJSC “Severstal” to the third parties under obligations of the related parties, bln. rub.
|
Indicators |
2008 |
2009 |
2010 |
|
Issued guarantees, total |
20528.2 |
15187.0 |
16159.4 |
|
In % to net assets |
6.6 |
4.9 |
6.1 |
|
Including foreign enterprises (North America) |
14078.0 |
11631.2 |
4774.9 |
|
In % from the total amount of issued guarantees |
68.6 |
76.6 |
30.0 |
|
Sources: an explanatory note to the annual report of OJSC “Severstal” for the period from 2009 to 2010; calculations by ISEDT RAS. |
|||
Table 18. Accrued dividends of OJSC “Severstal” in 2010
When we analyze loaning, we shouldn’t lose sight of such important aspect as the guarantees for obligations issued by the third parties. OJSC “Severstal” provided the guarantees for 52 billion rubles in 2008 – 2010 (tab. 17) .
The table shows that the absolute part of the guarantees was granted to secure the credits and loans of the same American companies such as steel mills Severstal Dearbom, Inc and Severstal Columbus, LLC. Guarantees are issued for three years. The leaders of Severstal will likely have to pay the guarantees issued by the parent company because these plants are unprofitable.
Calculation and distribution of dividends
The Board of Directors of OJSC “Severstal” began to pay dividends again in 2010. The total amount of accrued dividends in 2010 was 6.8 billion rubles (tab. 18) .
An extraordinary general meeting of shareholders of OJSC “Severstal” announced the dividend payment for 9 months at the end of December in 2010. Of course, the net profit of the company amounted to 24 billion rubles at the end of three quarters of 2010 and promotion of shareholders was legitimate. However, the decision on dividend payment was made at the end of 2010, when negative financial performance of the year was obvious. Due to the cost of dividend reserve capital (surplus earnings) was decreased by 4.3 billion rubles. In spite of net loss in 2010, the general meeting announced dividend payments of 2.42 rubles per share on 27th of June, 2011. The total amount of funds allocated for these purposes, amounted to 2.4 billion rubles, including the dividends of 2 billion rubles accrued to A.A. Mordashov. Dividend expenses were charged to surplus earnings.
Consequently, in the presence of losses and the negative value of own circulating assets the dividends for 2010 were paid due to exhaustion of the reserve capital.
Conclusions and suggestions
The results of this research allow us to formulate the following conclusions:
-
1. In 2010 OJSC “Severstal” had all the chances to improve the final financial performances. The profit was increased by 66 billion rubles or by 1.5 times as compared with 2009 due to favorable pricing environment and growth in production volumes. However, the company completed 2010 with the net loss amounted to almost 40 billion rubles.
-
2. The main unprofitability factor of OJSC “Severstal” in 2010 was a sharp increase in other expenses at the end of the year which was provided by the reserves for investment depreciation amounted to 60 billion rubles. 80% of the losses were provided by the foreign low-margin structures of Severstal, where was a steady decline in value of their investments.
-
3. The increase in commercial and executive expenses led to the decrease of the profits for tax purposes by 34% in 2010.
-
4. More than a third of the operating profit, which served as the basis for the formation of taxable profit, was used to pay bank debts in 2009 – 2010. The company spent 20 billion rubles for these purposes. Despite these benefits, debt wasn’t reduced. On the contrary, debt expenses were becoming more and more: in 2010 they increased by 23% as compared with 2009.
-
5. The decisive factor in the rising of interest payable expenses was the large-scale borrowing of OJSC “Severstal” in 2008. Their sum was estimated at 84 billion rubles. The company was buying up the U.S. assets during that year, which was unprofitable in the moment of purchase and in future. They used credit resources amounted to 35.6 billion rubles in 2009 – 2010. As a result the company debt amounted to 150 billion rubles at the beginning of 2011, including 80% of long-term external debt.
-
6. Available liquidity, including borrowings, was derived from the parent company in the form of loans to affiliated organizations.
211.6 billion rubles were used for these purposes in 2008 – 2010. At the same time the North American companies, three of which halted production in 2009 because of the falling demand in the automotive industry were provided with the loans and guarantees amounted to 95.2 billion rubles. Subsequently, during the classification of these enterprises as “assets for sale” Severstal’s leaders refused of their own accord to recover loan debts and they canceled the remaining debt amounted to 10.3 billion rubles as the loss of the parent company.
-
7. When Severstal had the net loss amounted to 40 billion rubles, the Board of Directors took out almost 7 billion rubles from the Cherepovets Metallurgical Plant in the form of dividends by the reducing of reserve capital. In this case the main owner of the company, its CEO got 5.6 billion rubles.
-
8. According to the report of OJSC “Severstal”, tax-and-duties debts amounted to 0.8 billion rubles on 01.07.2011.The debt of itself is not a violation of the law. However, it is difficult to justify the loans and guaranties to the related parties and dividend payments during the growth of short-term obligations not only to the budget, but also to extra-budgetary social funds, suppliers and contractors.
-
9. The system of tax benefits in the form of zero VAT rate on export products, which is legalized by Tax Code, dashed the budget system. Throughout the country the loss of the federal budget at the expense of VAT refund is more than 15% of the total revenues and 40% of the accrued VAT. VAT refund amounted to 14.3 billion rubles only in the Vologda Oblast in 2009 – 2010. It is comparable with the total amount of deficit in the region during this period.
In summary, we can emphasize that one of the main results of our research was the confirmation of the previous hypotheses on the financing of unprofitable foreign assets of Severstal at the expense of the parent company.
Only according to the disclosed information, in the period from 2008 till 2010 the leaders of the company sent about 200 billion rubles to these purposes (two thirds of the average net asset value) which were earned by the CMP employees.
The result of such practices was the net loss which was received firstly during the last decade, as well as the steady decline in solvency in the form of the negative value of its own circulating capital and the growth of debts.
The results of our research demonstrate once again the need for legislative consolidation of the mechanisms to counter the oligarchic nature of the Russian economy. In this regard, we consider that it is possible to offer to representative authorities of the Russian Federation the following activities:
О Denounce the agreement concluded between Russia and Cyprus “On avoidance of double taxation” (05.12.98), according to which the tax on dividends in favor of Cypriot companies is set at 5%. The president D.A. Medvedev proposed to domestic businessmen to pay profit taxes earned offshore or officially there to register there. These ideas have not implemented yet.
О It is necessary to use in practice the agreements of the Russian Federal Tax Service with major companies on pricing principles. For example, an inspection result of the coal industry which was carried out by the Accounting Chamber of the Russian Federation in 2009, showed that more than 80% of exported Kuzbass coal were implemented by using transfer pricing schemes, which allowed them to reduce selling price as compared with the market price. Budget losses for profit tax were estimated at 11.5 billion rubles.
О Consider the possibility of imposition of tax for the export of currency abroad not less than 20%. According to the economists’ calculations, about 6 trillion rubles were transferred to offshore. It twined the budget deficit by two times.
О Resolve the issue about the abolition of export VAT refund without delay. It would allow us to increase revenues of the federal budget by 15%. The Federal subjects would have opportunity to get additional transfers (currently only 15% of the federal budget goes to the providing of financial assistance in the regions).
О Provide the Federal Tax Service of the Russian Federation with the power to obtain all the information about the activities of any enterprise. In particular, it is necessary to legitimize the receipt of information about transactions with affiliated parties. It will allow us to track the tolling schemes to output the export earnings, as well as strengthen control over transfer pricing8.
P.S. ISEDT RAS is continuing to research the influence of the metallurgical corporation owners’ interests over national and regional development. Their results will be published in the immediate journal.
References The influence of the metallurgical corporation owners’ interests over the financial performances of the parent enterprise (in the case of OJSC “Severstal”)
- Ilyin V.А. The influence of the metallurgical corporation owners’ interests over the national and regional development//Economic and Social Changes: facts, trends and forecasts. -2011. -№ 3 (15). -Pp. 14-37.
- Electronic resource. -Available at: http://www.severstal.com/rus/ir/disclosers/financial_reports/index.phtml
- Reports on the results and main activities of the Federal Customs Service//. -Available at: http://www.customs.ru/index.php?option=com_newsfts&view
