The method for lifetime estimation through the mechanical properties in tension

Author: Bakhracheva Yuliya Sagidullovna
Journal: НБИ технологии @nbi-technologies
Section: Технико-технологические инновации
Article in issue: 2 (11), 2014.
Free access
The method for prediction of Paris' curve shape through the results of tensile test is suggested. For this purpose the author developed non-direct method for determination of Kth and Kfc and corresponding to them da/dN values. The relationship between Kth and b/y ratio was found. The correlation Kfc(KIc) was also shown. It makes possible to estimate lifetime of different structures with cracks under cyclic loading.
Paris' curve, cyclic loading, lifetime, non-direct method, tensile test
Short address: https://sciup.org/14968317
IDR: 14968317 | UDC: 669.0 | DOI: 10.15688/jvolsu10.2014.2.4
Метод оценки долговечности по механическим свойствам при растяжении
Предложен метод прогнозирования формы классической кинетической диаграммы усталостного разрушения по результатам испытаний на растяжение. Для этого разработаны косвенные методы определения пороговых размахов коэффициентов интенсивности напряжений Kth и Kfc, а также соответствующих им значений скоростей da/dN. Установлена взаимосвязь между Kth и отношением предела прочности к пределу текучести b/y. Получена корреляция Kfc(KIc). Показана возможность прогнозирования долговечности различных конструктивных элементов и деталей машин при наличии трещин в условиях циклического нагружения.
Text of the scientific article The method for lifetime estimation through the mechanical properties in tension
For many years attempts have been made to understand the crack growth mechanism and predict lifetime under conditions of cyclic loading. Cracks exist in many structural components. The crack growth resistance is an important property of the material which controls the lifetime of the component. Studies on the growth of cracks have led to the observation that fatigue life of many engineering materials is primarily dependent on micro-structural features, such as inclusion particles, voids, slip-bands or manufacturing defects. Thus, knowledge of the crack rate makes possible the prediction of residual lifetime of a component. Due to that cracked component may be kept in service for an extended useful time. Applying the fracture mechanics principles makes possible to predict the number of cycles spent for crack growth to some specified length or to final failure.
Determining the critical cyclic loading conditions is commonly performed by using a Paris’ curve. The Paris’ curve is dependence of crack growth rate, da/dN on the stress intensity range A K = K m a x - K min .
This curve may be divided into three regions (fig. 1). At low stress intensities, Region I, cracking behavior is associated with threshold, AKth, effects. By considering the term AKth the designer can ensure that no crack growth will occur. AKth is the “fatigue crack growth threshold”, and signifies the critical value of AK below which crack growth will not occur. It is calculated using the Paris’ curve, and is the value of AK corresponding to da/dN = 0. In the Region III, at high AK values, crack growth rates are extremely high and little fatigue life is involved. Finally, in the mid-region, Region II, the curve is essentially linear and can be described by the Paris’ equation da I dN = C (A K) n, (1)
where C and n are material constants and A K is the stress intensity: A K = K max - Kmin.
However, the procedure for Paris’ curve determination by means of direct testing is enough complicated and expensive. Sometimes, it is just impossible, for example in cases when structures or equipment are under exploitation conditions.
Therefore many investigators made large efforts to develop models for Paris’ curve shape predicting. The relationship between fracture toughness, AK fc and K Ic , AK fc and K Id was shown in paper [4; 6]. The correlation between constants С and n in the Paris’ equation is known [3; 7]. But up to date there is no model for AK th and constants n and С in Paris’ equation predicting.
Our approach to this problem is presented below.
Analysis
The simplified shape of a Paris’ curve is presented on fig. 1.
К m/cycle
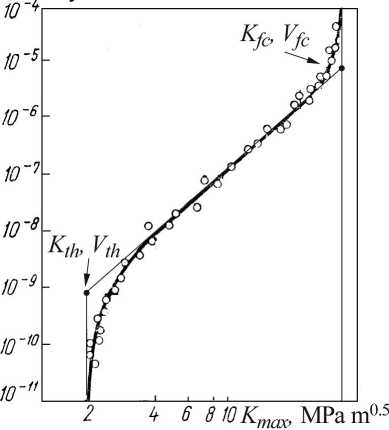
Fig. 1. The simplification of Paris’ curve
As can be seen from this figure, the reconstruction of a curve linear Region II may be done if the A K th , A K fc , and corresponding to them da/dN values are known. It makes possible to calculate constant n in Paris’ equation as:
n = ( lg v fc - lg v h ) 1 ( lg A K c - lg A K th ) , (2) where vth and vfc – the crack propagation rates corresponding to A K th and A K fc .
Crack propagation rates in eqn. (2) are not known.
For this reason the assumption is accepted that the crack propagation rate is proportional to the small scale yielding zone width. In this case it makes possible to rewrite the eqn. (2) in the following form (3):
n = ( lg r fc - lg r h ) I ( lg A K fc - lg A K th ) , (3)
where rth and rfc are the small scale yielding zones corresponding to A K th and A K fc . The rfc and rth values are determined as:
r fc
1L_M A K_
2п ( оy J, rth =
(1 — 2 Ц )2 f A K h ) 2 п I S k J ,
where ц - Poisson’s ratio, S k - fracture stress.
In the eqn. (5), the substitution of an Sk value instead of о y is accounted for by the following reason. The A Kth determination procedure is carried out under conditions of a load decreasing. Thus, the crack propagation in this region is accomplished in the extremely hardened material.
It can be seen from eqns (3–5) that for the purposes of further analysis it is necessary to develop the non-direct methods for A K th and A K fc determination.
Discussion
We have proved the existence of a linear correlation between fracture toughness, КIc , and A K fc values for more than 40 different steels [5]. This relationship is shown on fig. 2 and is described by the following equation:
A K fc = 0.8611 • K Ic - 26.387. (6)
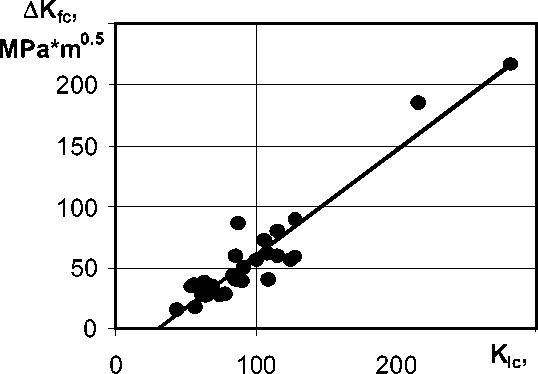
MPa*m0.5
Fig. 2. The relationship between КIc and Δ Кfc
Previously [1; 2; 8] the practical methods for fracture toughness КIc prediction through mechanical properties in tension and hardness values of materials were developed. The predicted КIc value may be used for Δ Кfc calculation through the eqn. (6).
The results of calculation Δ Кfc are presented in table 1.
In this work also the relationship between Δ Кth and σ b/ σ y was proposed (fig. 3).
It is valid for many different steels [4–6] and may be described by linear function:
Δ Kth = 36.906 ⋅ σ b / σ y - 34.04, (7)
where σ b is an ultimate tensile strength, σ y is a yield stress.
The results of Δ Кth calculation are presented and compared to their experimental values in table 2.
It should be noted however that determining Δ Кth values is dependent on testing equipment.
Now, when the Δ Кth и Δ Кfc are already found, the n constant value in the eqn. (3) can be calculated. After that we have to find the С constant in eqn. (1).
The correlation between constants С and n in the Paris’ equation is known [3; 7]. We have confirmed this relationship for steels investigated in present paper. It can be described as:
C =0.0002⋅ e - 6.9048 ⋅ n (8)
The fair of this formula was shown for more than 200 different materials. The correlation coefficient value equals to 0.998. Thus in the linear region of a Paris’ curve the crack propagation rate is controlled by the single parameter С or n . The results are presented in tables 3, 4 and fig. 4.
As can be seen from the presented analysis the non-direct method for determination of all parameters of the Paris’ curve is developed. The calculated and experimental values of constants C and n are in good agreement.
Table 1
The comparison of results experimental and calculation Δ Кfc values
|
Steels |
Т , К |
σ 0.2 МPa |
σ b МPa |
Δ К fc МPa ∗ m (experiment) |
Δ К fc МPa ∗ m (calculation) |
δ , % |
|
15KH2МFА |
293 |
584 |
700 |
121.3 |
127.5 |
4.8 |
|
243 |
647 |
752 |
59 |
63.8 |
7.5 |
|
|
213 |
674 |
783 |
62 |
72.3 |
14.2 |
|
|
15KH2NМFА |
293 |
593 |
707 |
129.4 |
132.8 |
2.6 |
|
243 |
658 |
756 |
72.46 |
85.7 |
15.4 |
|
|
183 |
745 |
943 |
34.2 |
42.9 |
20.2 |
The comparison of results experimental and calculation A K th values
|
Steels |
Т , К |
σ 0.2 МPa |
σ b МPa |
Δ K th МPa*m (experiment) |
Δ K th МPa*m (calculation) |
δ, % |
|
15KH2МFА |
293 |
584 |
700 |
9.1 |
10.19 |
-12 |
|
243 |
647 |
752 |
12.4 |
8.85 |
28 |
|
|
213 |
674 |
783 |
12.5 |
8.83 |
29 |
|
|
15KH2NМFА |
293 |
593 |
707 |
9.2 |
9.96 |
-8.2 |
|
243 |
658 |
756 |
10.2 |
8.36 |
18 |
|
|
183 |
745 |
943 |
10.6 |
10.67 |
-19 |
|
|
St3sp |
293 |
240 |
470 |
33.58 |
30.03 |
10.58 |
|
18Gsp |
293 |
260 |
500 |
28.08 |
28.12 |
-0.13 |
|
09G2S |
293 |
352 |
503 |
15.25 |
15.06 |
1.24 |
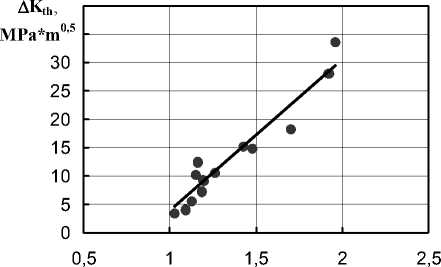
σ b / σ y
Fig. 3. The relationship between K K th and b b / a y
Table 2
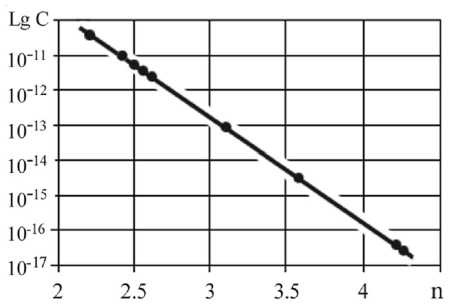
Fig. 4. The C dependence on a n value
For the lifetime prediction the Wilson’ approach can be used. The number of cycles, N, necessary for crack grows from the initial size а0 to the critical size acr can be found from the Paris’ equation as where Ab = bmax - a min, M - parameter of geometry and the shape of defect, we get
N = r---- d a
1 0 C ( A o^Ma ) n .
N = J
da
C ( A K ) n .
Integrating of the eqn. (11) results in
-
(9) Wilson’ formula:
|
Assuming that 2 |
\ 1 1 1 |
|
A K = AbV Ma , (10) N = ( n - 2) CMn 2 A ^ 1 |
( n - 2)/2 ( n - 2)/2 _ a о aC r _ |
Table 3
The comparison of results experimental and calculation n values
|
Steels |
σ 0.2 МPа |
σ b МPа |
С (experiment) |
С (calculation) |
δ , % |
|
20KH13 (1) |
655 |
775 |
3.12 |
3.15 |
1.0 |
|
20KH13 (2) |
566 |
749 |
2.89 |
3.04 |
5.1 |
|
14KH17N2 |
782 |
943 |
2.56 |
2.76 |
7.4 |
|
13KH11N2V2МF |
885 |
1 015 |
2.86 |
2.88 |
0.9 |
|
08KH17N6Т |
840 |
895 |
2.57 |
3.18 |
19.3 |
|
1KH16К4NМVFBА |
980 |
1 163 |
2.56 |
3.51 |
27.1 |
Table 4
The comparison of results experimental and calculation C values
|
Steels |
σ 0.2 МPа |
σ b МPа |
C (experiment) |
C (calculation) |
δ , % |
||
|
20KH13 (1) |
655 |
775 |
5.89 |
⋅ 10-9 |
6.07 ⋅ |
10 -9 |
2.9 |
|
20KH13 (2) |
566 |
749 |
1.15 |
⋅ 10-9 |
1.27 ⋅ |
10-9 |
9.4 |
|
14KH17N2 |
782 |
943 |
6.71 |
⋅ 10-9 |
8.88 ⋅ |
10 -9 |
24.4 |
|
13KH11N2V2МF |
885 |
1 015 |
3.82 |
⋅ 10-9 |
3.79 ⋅ |
10 -9 |
-0.8 |
|
08KH17N6Т |
840 |
895 |
6.04 |
⋅ 10-9 |
4.72 ⋅ |
10-9 |
-27.9 |
|
1KH16К4NМVFBА |
980 |
1 163 |
1.6 ⋅ |
10-8 |
1.99 ⋅ |
10-8 |
19.6 |
The acr value is found from the condition of the pressure vessel fracture or can be taken with consideration of crack size allowed for this structure.
The verification of the suggested model has shown its applicability for express lifetime estimation of different structures.
Conclusions
-
1. The relationship between Δ Kth and σ b/ σ y ratio was found. The correlation Δ Kfc ( KIc ) was also demonstrated.
-
2. The non-direct method for determination of Δ Kth and Δ Kfc and corresponding to them da/ dN values was developed.
-
3. The method for prediction of Paris’ curve shape through the results of tensile test is suggested. It makes possible to estimate lifetime of different structures with cracks under cyclic loading.
References The method for lifetime estimation through the mechanical properties in tension
- Bakhracheva Yu.S. Operativnaya otsenka sklonnosti materialov k khrupkomu razrusheniyu pri staticheskom i tsiklicheskom nagruzhenii. Diss. kand. tekhn. nauk [Operative Estimation of Materials' Liability to Brittle Fracture Under Statik and Cyclic Loading. Cand. techn. sci. diss.]. Velikiy Novgorod, 2004. 126 p.
- Bakhracheva Yu.S. Otsenka vyazkosti razrusheniya staley po rezultatam kontaktnogo deformirovaniya //Vestnik Volgogradskogo gosudarstvennogo universiteta. Seriya 10, Innovatsionnaya deyatelnost , 2012, no. 7, pp. 53-56.
- Romvari P., Tot L., Nad D. Analiz zakonomernostey rasprostraneniya ustalostnykh treshchin v metallakh [The Analysis of Regularities of Fatigue Cracks in Metals]. Problemy prochnosti, 1980, no. 12, pp. 184-188.
- Troshchenko V.T. Prognozirovanie dolgovechnosti metallov pri mnogotsiklovom nagruzhenii [Forecasting Metals' Lifetime Under Multicycle Load]. Problemy prochnosti, 1980, no. 10, pp. 31-39.
- Troshchenko V.T., Pokrovskiy V.V., Prokopenko A.V. Treshchinostoykost metallov pri tsiklicheskom nagruzhenii [Crack Toughness of Metals Under Cyclic Loading]. Kiev, Nauk. dumka Publ., 1987. 256 p.
- Troshchenko V.T., Pokrovskiy V.V. Tsiklicheskaya vyazkost razrusheniya metallov i splavov [Cyclic Viscosity of Metals and Alloys Cracks]. Problemy prochnosti, 2003, no. 1, pp. 5-23
- Yarema S.Ya. O korrelyatsii parametrov uravneniya Perisa i kharakteristikakh tsiklicheskoy treshchinostoykosti materialov [On the Correlation of Paris Curve Parameters and the Characteristics of Cyclic Crack Toughness of Materials]. Problemy prochnosti, 1981, no. 9, pp. 20-24.
- Bakhracheva Yu.S. Fracture Toughness Prediction by Means of Indentation Test. International Journal for Computational Civil and Structural Engineering, 2013, Vol. 9, no. 3, pp. 21-24.
