The Performance of Discret Bandelet Transform Coupled by SPIHT Coder to Improve the Visuel Quality of Biomedical Color Image Compression

Author: Beladgham Mohammed, Habchi Yassine, Moulay Lakhdar Abdelmouneim, Abdesselam Bassou, Taleb-Ahmed Abdelmalik
Journal: International Journal of Image, Graphics and Signal Processing(IJIGSP) @ijigsp
Article in issue: 5 vol.6, 2014.
Free access
The search for a good representation is a central problem of image processing, this paper explores a new transform type to solve this problem. Color Image compression is now essential for applications such as transmission and storage in data. In the field of medical diagnostics, interested parties have resorted increasingly to color medical imaging. It is well established that the accuracy and completeness of diagnosis are initially connected with the image quality. This paper introduces an algorithm for color medical image compression based on the bandelet transform coupled with SP?HT coding algorithm;bandelet transform is a new method based on capturing the complex geometric content in image. The goal of this paper is to examine the capacity of this transform proposed to offer an optimal representation for image geometric, In order to enhance the compression by our algorithm, we have compared the results obtained with bandelet transform application in satellite image field. For this reason, we evaluated two parameters known for their calculation speed. The first parameter is the PSNR; the second is MSSIM (structural similarity) to measure the quality of compressed image. We concluded that the results obtained are very satisfactory for color medical image domain.
Bandelet transform, Color image, Optical flow, Quadtree segmentation, SPIHT coder
Short address: https://sciup.org/15013297
IDR: 15013297
Text of the scientific article The Performance of Discret Bandelet Transform Coupled by SPIHT Coder to Improve the Visuel Quality of Biomedical Color Image Compression
Published Online April 2014 in MECS DOI: 10.5815/ijigsp.2014.05.08
Today, distance diagnostic medical system, digital library and Internet are applied popularly. One of the most important problems in such applications is how to store and transmit images [1]. The medical diagnostic field is interested by the researchers. It is well established that the accuracy and precision of diagnostic are initially related to the image quality.
Finding efficient geometric representations of images is a central issue in improving the efficiency of image compression. Many ideas have already been studied to find new bases can capture geometric regularity image. Image representations in separable orthonormal bases such as Fourier, local Cosine or Wavelets can not take advantage of the geometrical regularity of image structures. Standard wavelet bases are optimal to represent functions with piecewise singularities; however, they fail to capture the geometric regularity along the singularities of edges or contours because of their isotropic support. To exploit the anisotropic regularity along edges, the basis must include elongated functions that are nearly parallel to the edges. Multiscale geometric analysis (MGA) developed recently provides a group of new basis that has anisotropic supports such as Curvelets [2-7], A Curvelet frame is composed of multiscale elongated and related wavelet type functions, for this reason, In this paper, we introduce a new type of transform, called bandelet transform by E Le Pennec and Stéphane Mallat[8], this transform is more recently developed method of compression technique, which decompose the image along multiscale vectors that are elongated in the direction of a geometric flow. This geometric flow indicates directions in which the image gray levels have regular variations; bandelet bases can represent the geometric regular images efficiently.
-
II. THE BANDELET TRANSFORM
Bandelet transform, introduced by Le Pennec and Mallat [9] built a base adapted to the geometric content of an image. The bandelets are obtained from a local deformation of space to align the direction of regularity with a fixed direction (horizontal or vertical) and is reduced to a separable basis [10], [11].
L(.f. R. B) = |If-./r|2
+ X .T 2 X ( R jG + R jB ) j
X : Lagrangian.
T : Quantifiction step.
R : is the number of bits to code the optical flew in each square.
R : is the number of bits to code the quantized bandelet coefficients.
f : is the reconstructed 1D signal by thresholding the coefficients smaller than T . The optimal direction in each dyadic sub-region can be defined as
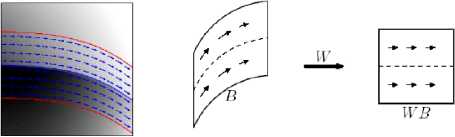
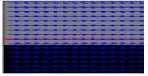
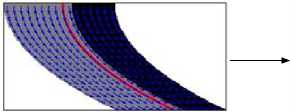
Figure 1. Deformation of horizontal field according to a geometric flow.
^opt = arge minL(f,0,T) (3)
Then the corresponding 1D wavelet coefficients to 0pi , is defined as bandelet coefficients and the optimal direction 0 t , is recorded for reconstructing image. [14]
2.2 Quadtree Segmentation
2.1 Flow-curve Relationship
There is a constant correspondence between the flow along the vertical direction and curves whose tangent is never vertical; the flow associated with this curve is given by flow:
т ( x ) =
1 (1 )
1+к'(x)
2 Iс'(x)J
Segmentation operation it is a division successive of image space that allows us to have a set of sub-blocks.
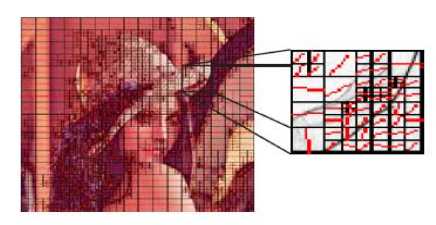
Figure 2. Example of quadtree segmentation The operating diagram of the quadtree segmentation is the following
c ( x ) : Slope of optical flow.
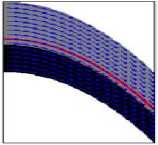
We can generate the basic test bandelet according to the flow and geometric regularity of each sub-block. If there is no flow geometry in the sub-blocks, this means that the sub-block is uniformly regular so that we can use the classical separable wavelet basis for treating this sub-block. If not, the sub-block must be processed by the bandelet.
Also, the variation along geometric flow defined in the sub-block means that we can deform the sub-block in horizontal or vertical direction; in this case we can say that the sub-block is uniformly regular. [12].
Calculates the Lagrangian allows us to determine subblock that contains the singularity [13].
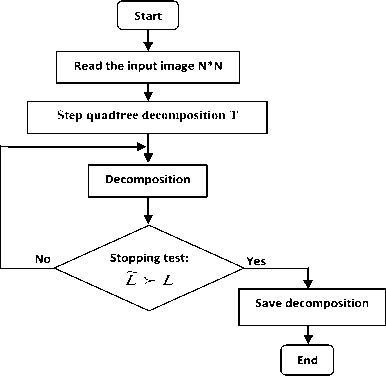
Figure 3. Segmentation quadtree diagram functional
The optimal segmentation is defined with [15]:
L о ( 5 ) = min { L о ( 5 ) ~ ( 5 ) } (4)
Where
~ ( 5 ) = L о ( 5 1 ) + L о ( 5 2 ) + L о ( 5 3 ) + L 0 ( 5 4 ) + L 0 ( 5 ) + X T 2
L o ( 5 ,) : Lagrangian of sub-blocks.
f Vl , n 1 ( X 1 ) V j , n 2 ( x 2 — c ( x 1 )) V j , n 1 ( x 1) ф j , n 2 ( x 2 — c ( x 1» vVj , n 1 ( x 1 ) V j , n 2 ( x 2 — c ( x 1 )) ,
V H =• V j , .
^D, n
j , l > n 1 , n 2
2.3 The Operator of Deformation
The deformation operation is a local operation on a block that contains a curve singularity to align or correct in a direction horizontal and vertical.
(a)
(b)
(c)
Figure 4. Example of model horizon and deformation of the field according to a geometric flow. Image distortion: (a) an image having a horizontal flow, (b) its image by the operator W, (c) an image having a vertical flow, (d) the image by the operator W.
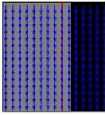
(d)
Deformation operation gives a wavelet orthonormal basis of L 2 ( Q ) :
III. OPERATIONAL DIAGRAM
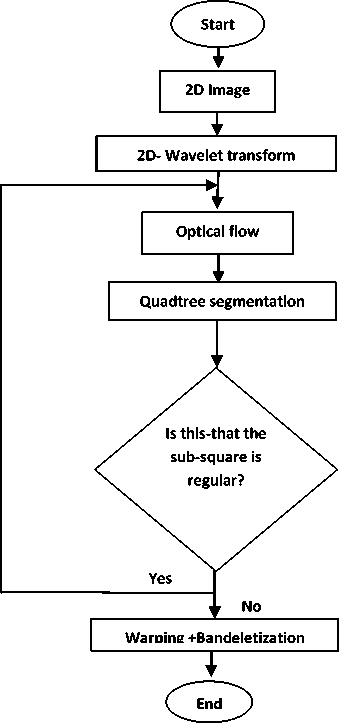
Figure 5. Bandelet transform operational diagram
ф , „( x 1 ) V j , n 2 ( x 2 — c ( x 1 )) • V j , n 1 ( x 1 ) Фj,n 2 ( x 2 — c ( x 1 )) ’
V j , n 1 ( x 1 ) V j , n 2 ( x 2 — c ( x 1 ))
The horizontal wavelet VH have not vanishing moments along contour, to be replaced by new functions:
V l , n 1 ( x 1 ) V j , n 2
( x 2
—
c ( x 1))
This is called bandeletization [16], [17]. The orthonormal basis of bandelet of field warping is defined by:
IV. EZW CODING SCHEME
The algorithm proposed by Shapiro [18], the design of this algorithm is based on two pass with a calculated threshold T, we determine the maximum value of the wavelet coefficients, so in the first dominant pass, if the coefficient absolute value is greater than the threshold, so we obtained a positive code or negative code according to the sign of coefficient, if the absolute value is less, we check the descendants coefficient, if you have a coefficient with absolute value above the threshold, we obtained IZ code, else we have a code ZT.
In the second pass, the comparison is made in the middle of the interval [Tn, 2Tn[, if this coefficient belongs to the first interval, so we are a transmission of the bit 1, if this coefficient belongs to the second interval, so there are a transmission of bit 0.
-
V. SPIHT CODING SCHEME
The SPIHT algorithm proposed by Said and Pearlman in 1996 [19], ameliorate progressive algorithm is compared to the EZW algorithm, based on the creation of three list SCL, ICL and ISL with a calculated threshold T, each time you make a scan on both lists SCL and ISL and that for the classified the significant coefficient in the list of significant coefficient.
-
VI. QUALITY EVALUATION PARAMETER
The Peak Signal to Noise Ratio (PSNR) is the most commonly used as a measure of quality of reconstruction in image compression. The PSNR were identified using the following formulate:
SSIM (x, y ) = l (x, y )c (x, y )s (x, y ) (11)
Finally the quality measurement can provide a spatial map of the local image quality, which provides more information on the image quality degradation, which is useful in medical imaging applications. For application, we require a single overall measurement of the whole image quality that is given by the following formula:
MSSIM (I, I) = ^ £ SSIM I, I) (12)
MSE =
M . N
M - 1 N - 1
A
. EZ i ( i , j ) - 1 ( i,j )
i = 0 j = 0
Where I and I are respectively the reference and degraded images, I and I are the contents of images at the i-th local window.
M : the total number of local windows in image. The MSSIM values exhibit greater consistency with the visual quality.
Mean Square Error (MSE) which requires two MxN gray scale images I and I where one of the images is considered as a compression of the other is defined as:
• The PSNR is defined as:
PSNR = 10.log10
( 2 R - 1 ) 2
MSE
[dB ]
Usually an image is encoded on 8 bits. It is represented by 256 gray levels, which vary between 0 and 255, the extent or dynamics of the image is 255.
PSNR of a color image (RGB) is defined by the equation:
VII. ALGORITHM
Before applying bandelet transform on the color image, the RGB color images are converts into YCbCr form, and then applying bandelet transform on each layer independently, this means each layer from YCbCr are compressed as a grayscale image. Figure-5 shows bandelet transform on each YCbCr layer. YCbCr refers to the color resolution of digital component video signals, which is based on sampling rates. In order to compress bandwidth, Cb and Cr are sampled at a lower rate than Y, which is technically known as "chroma subsampling."
PSNR = 10log10
__________ 255 2 x 3 __________
MSE ( R ) + MSE ( G ) + MSE ( B )

RGB color image
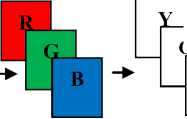
Cb
Cr
• The structural similarity index (SSIM):
The PSNR measurement gives a numerical value on the damage, but it does not describe its type. Moreover, as is often noted in [20], [21], it does not quite represent the quality perceived by human observers. For medical imaging applications where images are degraded must eventually be examined by experts, traditional evaluation remains insufficient. For this reason, objective approaches are needed to assess the medical imaging quality. We then evaluate a new paradigm to estimate the quality of medical images, specifically the ones compressed by wavelet transform, based on the assumption that the human visual system (HVS) is highly adapted to extract structural information. The similarity compares the brightness, contrast and structure between each pair of vectors, where the structural similarity index (SSIM) between two signals x and y is given by the following expression:
Apply SPIHT algorithm on each layer independently
RGB converted to YCbCr

Apply BWT algorithm on each layer independently
Figure 5. Complete steps image compression technique using bandelet transform (DBT) coupled with SPIHT
This means that some color information in the image is being discarded, but not brightness (luma) information. We obtain the best rate of compression using the rich less layer for the chromatic composante Cb and Cr.
Y = 0.2989 * R + 0.5866* G + 0.1145* B
Cr = 0.5* R - 0.4183* G - 0.0816* B
When the decomposition image is obtained, we try to find a way to code the bandelet transform into an efficient result, taking redundancy and storage space into consideration. After,we apply SPÏHT algorithm on each layer (y,Cr,Cb) independently .
-
VIII. RESULTS AND DISCUSSION
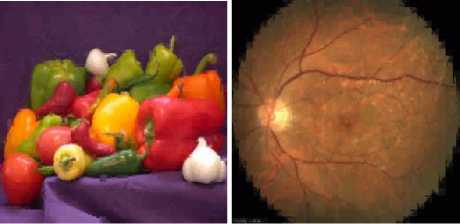
We are interested in this work to the medical images compression, that we applied algorithm (DBT+SPIHT), (DBT+EZW). For this, we chose sets of images (PEPPERS, MRI, RETINOGRAPHIC, SATELLITE) images gray level size 512x 512 (color) encoded on 8 bits per pixel. These images are taken from the GE Medical System (database) [22]. The importance of our work lies in the possibility of reducing the rates for which the image quality remains acceptable. Estimates and judgments of the compressed image quality are given by the PSNR evaluation parameters and the MSSIM similarity Index.
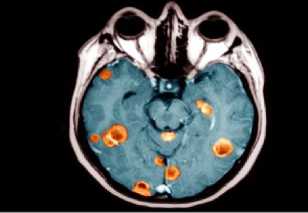
(a)
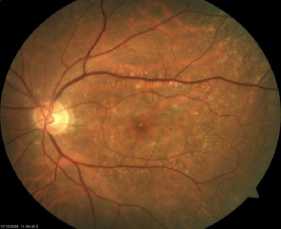
(b)
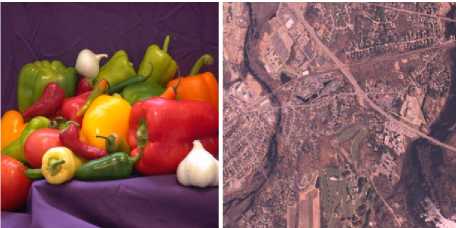
(c) (d)
Figure 6. (a). MRI, (b). RETINOGRAPHIC , (c). PEPPERS, (d). SATELLITE original images
We will in this section applied bandelet transform on these images contain a lot of data redundancy; we present the performance of different threshold using two incremental encoders to EZW and SPIHT image compression. The image is compressed for the different bits per pixel.
Our work is divided into two parts is to make a comparative study between different threshold values for MRI image and applying after threshold how permit us to have a important value of PSNR. For each application we vary rate of 0.25 to 2 values and calculate the PSNR and MSSIM.
To show the performance of the proposed method, we will now make a comparison between these different algorithm ((DBT (T=10)+CDF9/7+EZW), (DBT (T=20)+CDF9/7+EZW); (DBT (T=30)+CDF9/7+EZW); (DBT (T=10)+CDF9/7+SPIHT); (DBT (T=20)+CDF9/7+SPIHT); (DBT (T=30)+CDF9/7+SPIHT)). For each application we vary the bit-rate 0.25 to 2, and we calculate the PSNR and MSSIM. We chose MRI image gray level size 512x512 encoded on 8 bits per pixel. The results obtained are given in Table 1.
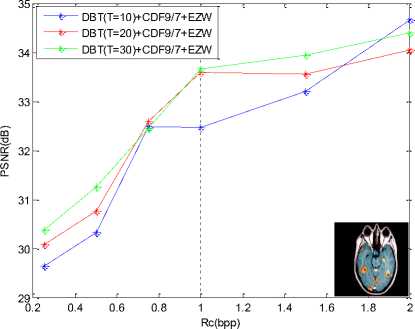
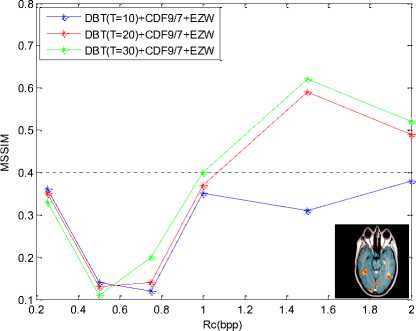
Table 1 PSNR and MSSIM variation using bandelet transform coupled by EZW coder (MRI)
|
Rc (bpp) |
DBT(T=10)+CDF9/7+ EZW |
DBT(T=20)+ DF9/7+ EZW |
DBT(T=30)+ CDF9/7+ EZW |
|||
|
PSNR(dB) |
MSSIM |
PSNR(dB) |
MSSIM |
PSNR(dB) |
MSSIM |
|
|
0.25 |
29.64 |
0.36 |
30.08 |
0.35 |
30.37 |
0.33 |
|
0.5 |
30.32 |
0.14 |
30.76 |
0.13 |
31.25 |
0.11 |
|
0.75 |
32.48 |
0.12 |
32.59 |
0.14 |
32.45 |
0.20 |
|
1 |
32.46 |
0.35 |
33.58 |
0.37 |
33.66 |
0.40 |
|
1.5 |
33.20 |
0.31 |
33.55 |
0.59 |
33.93 |
0.62 |
|
2 |
34.65 |
0.38 |
34.05 |
0.49 |
34.40 |
0.52 |
(a) (b)
Figure 7. Numerical results PSNR and MSSIM of compression MRI image by bandelet transform coupled with EZW coder : (a) PSNR results , (b) MSSIM results
Visually, from the curves, We note that the (DBT(T=30)+CDF9/7) coupled with EZW allow us to have better results (good image reconstruction) so a better image visual quality and this is proved by higher PSNR = 34.40 dB value for 2bpp, this means good quality image after reconstruction.
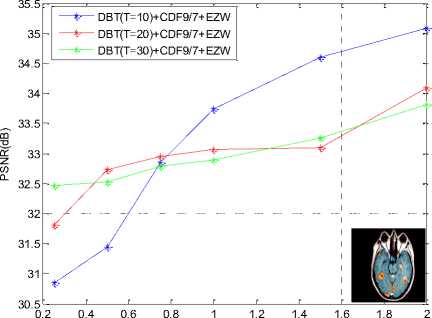
In order to evaluate PSNR results, we opted to other coder type named ‘SPIHT coder’, we use this type for compression MRI image gray level size 512x 512 encoded on 8 bits per pixel. This image is taken from the GE Medical System database [22]. The results are showed in figure 8.
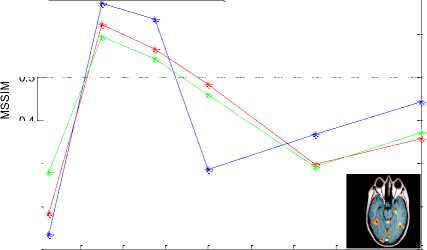
Table 2 PSNR and MSSIM variation using bandelet transform coupled by SPIHT (MRI)
|
Rc (bpp) |
DBT(T=10)+CDF9/7+SPIHT |
DBT(T=20)+ CDF9/7+SPIHT |
DBT(T=30)+ CDF9/7+SPIHT |
|||
|
PSNR(dB) |
MSSIM |
PSNR(dB) |
MSSIM |
PSNR(dB) |
MSSIM |
|
|
0.25 |
30.85 |
0.1329 |
31.81 |
0.18298 |
32.47 |
0.27943 |
|
0.5 |
31.44 |
0.67249 |
32.73 |
0.62357 |
32.52 |
0.59355 |
|
0.75 |
32.84 |
0.63486 |
32.95 |
0.5648 |
32.79 |
0.54327 |
|
1 |
33.74 |
0.28527 |
33.06 |
0.48378 |
32.89 |
0.45895 |
|
1.5 |
34.60 |
0.36788 |
33.09 |
0.29702 |
33.26 |
0.29201 |
|
2 |
35.09 |
0.44261 |
34.09 |
0.35614 |
33.81 |
0.37073 |
Rc(bpp)
(a)
Figure 8. Numerical results PSNR and MSSIM of compression MRI image by bandelet transform coupled with SPIHT coder : (a) PSNR results , (b) MSSIM results
0.8
0.7
0.6
DBT(T=10)+CDF9/7+EZW
DBT(T=20)+CDF9/7+EZW
DBT(T=30)+CDF9/7+EZW
0.4
0.3
0.2
Rc(bpp)
0.1
0.2 0.4 0.6 0.8
1.2 1.4 1.6 1.8 2
(b)
By comparing the different values of PSNR and MSSIM, we note that (DBT(T=10)+CDF9/7) coupled with SPIHT allow us to have better results compared to other threshold (T) and higher PSNR = 35.09 dB means good quality image after reconstruction. In the following, we present the compressed MRI images quality for different bit-rate values (number of bits per pixel) by (DBT(T) + SPIHT) and (DBT(T) + EZW) algorithm for different methods
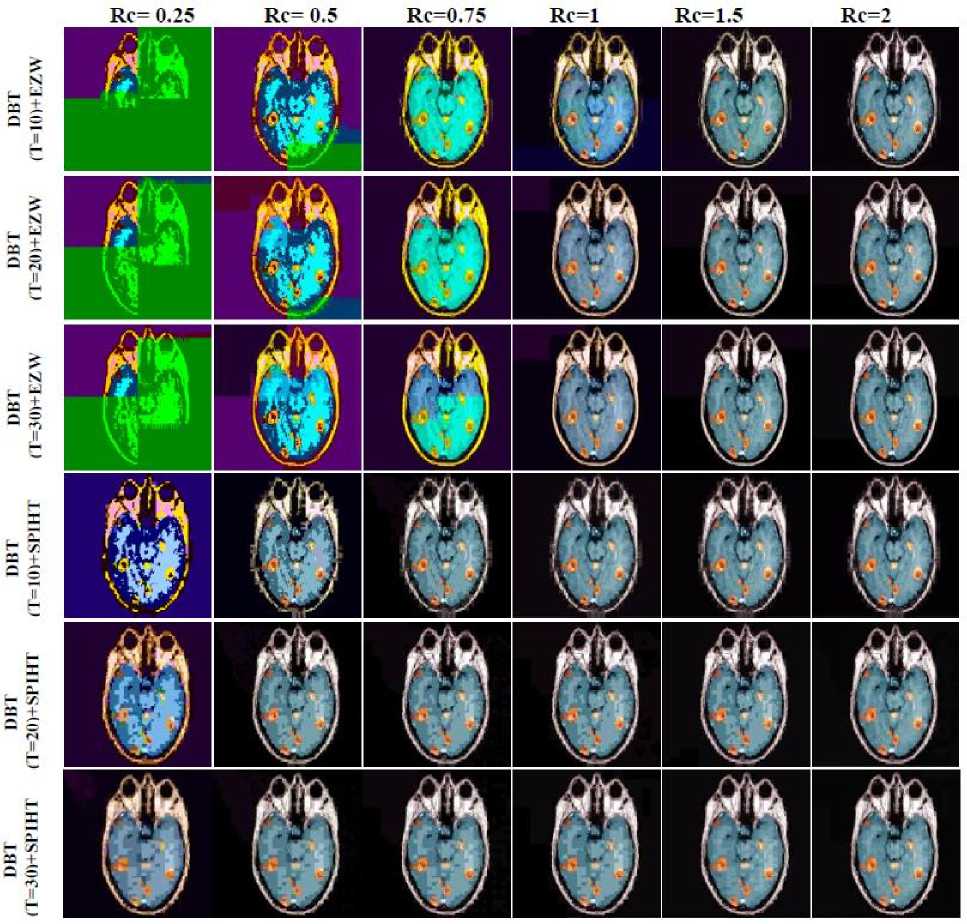
Figure 9. Compressed MRI images by DBT + SPIHT algorithm for different methods
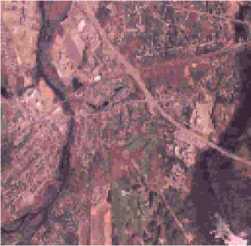
After showing the performance of the algorithm (DBT(T=10)+CDF9/7) coupled with SPIHT) for MRI image. Now in this study, we subsequently generalize and apply our algorithm to the sets of images of the GE Medical Systems database (PEPPERS, RETINOGRAPHIC and SATELLITE) in order to specify the type of image adapted to the algorithm. To investigate the influence of the choice of threshold and progressive encoder, we presents the results of compression images obtained after application of our algorithm. These results are obtained with a 2 bpp biterate and calculate the evaluation (PSNR, MSSIM) parameters. The results are given in figure10.
PSNR=35.91 PSNR=37.91
MSSIM=0.79153 MSSIM= 0.72741
PSNR=30.26 MSSIM=0.45616
Figure 10. Compressing of different images by bandelet transform (T=10) using CDF9/7 and SPIHT coding for 2bpp.
According to the PSNR and MSSIM values, we note that from (DBT(T=10)+CDF9/7+SPIHT), TOREX image reconstruction becomes almost perfect, and better than to the others images.
-
IX. CONCLUSION
In this paper, bandelet transform is used to capture effectively the complex geometric content in image. To arrive at this objective we combined this transform with EZW and SPIHT coder to compressed color image gray level size 512x 512 encoded on 8 bits per pixel. To have an elevated PSNR value we vary the threshold (T=10, T=20 and T=30).
Color medical image compression using the bandelet transform is still a vast research field. These transform provides a very compact representation for RETINOGRAPHIC image and for T=10, DBT (Discret Bandelet Transform) can capture more chaotic geometries and a major improvement compared to other transforms. However, research in this domain is still in its beginning and the current obtained results are difficult to evaluate.
References The Performance of Discret Bandelet Transform Coupled by SPIHT Coder to Improve the Visuel Quality of Biomedical Color Image Compression
- M. Nelson, “The data compression book“, 2nded., M&T books, New York, 1996.
- J. L. Starck, F. Murtagh, E. Candès, and D.L. Donoho, “Gray and Color Image Contrast Enhancement by the Curvelet Transform“, IEEE Transaction on Image Processing, Vol. 12, No. 6, pp 706-717, 2003.
- U E. J. Candès and D. L. Donoho, “New Tight Frames of Curvelets and Optimal Representations of Objects with Piecewise C2 Singularities, Comm. on Pure and Appl“. Math., Vol. 57, pp.219-266, 2004.
- M. N. Do and M. Vetterli, “Contourlets, in Beyond Wavelets“, J. Stoeckler and G. V. Welland, Eds. San Diego, CA: Academic Press, 2003.
- K. Romberg, M.B. Wakin, and R.G. Baraniuk, “Approximation and Compression of Piecewise Smooth Images Using a Wavelet/Wedgelet Geometric Model“, In IEEE 2003 International Conference on Image Processing -- ICIP-2003, Barcelona, Spain, September 2003.
- Borup. Lasse and Nielsen. Morten, “Approximation with brushlet systems, Journal of Approximation Theory“, Vol. 123, pp. 25-51, 2003.
- Vladan Velisavljevi′c, Baltasar Beferull-Lozano, Martin Vetterli and Pier Luigi Dragotti, “Directionlets: Anisotropic Multidirectional Representation with Separable Filtering“, IEEE Trans. Image Processing, Dec, 2004.
- E. Le. Pennec and S. Mallat, “Bandelet representation for image compression“, In Proc. Int. Conf. Image Processing, Oct. 2001.
- E. Le Pennec et S. Mallat, “Représentation d’images par bandelettes et application à la compression“, Dans GRETSI, Toulouse, Septembre 2001.
- E. Le Pennec, “Bandelettes et représentation géométrique des images”, Thèse de Doctorat, Ecole Polytechnique, 19 décembre 2002.
- V. Chappelier, “Codage progressif d'images par ondelettes orientées”, Thèse de Doctorat, Université Rennes 1, 15 décembre 2005.
- Jian-Jiun Ding, “Time Frequency Analysis Tutorial”, R99942057.
- Hong Han,Xing Wu, “Research of Method in Human Detection Based on Bandelet Transform”, Laboratory of Intelligent Perception and Image Understanding of Ministry of Education of China, Vol. 74951S,2009.
- Xiaokai Wang, Jinghuai Gao, “Image Denoising Method Based on Nonsubsampled Contourlet Transform and Bandelet Transform ,” The 1st International Conference on Information Science and Engineering (ICISE), Institute of Wave and Information, Xi’an Jiaotong University, Xi’an, China, 2009.
- Ruihua Liang, Lizhi Cheng, Zhicheng Zhu, Bo Chen, “ Image coding based on second generation bandelet transform”, Modern electronics technique, 61-65 (2007).
- E. Le Pennec, S. Mallat, “ Bandelettes et représentation géométrique des images,” CMAP / école Polytechnique 91128 PALAISEAU – France.
- E. Le Pennec, S. Mallat , “Bandelet Representations For Image Compression ,” 0-7803-6725-1/01. IEEE. 2001.
- J.SHAPIRO, "Embedded Image Coding using Zerotree of Wavelet Coefficients", IEEE trans. Signal processing. Vol. 41, pp. 3445-3462. Dec, 1993.
- A. Said and W. A. Pearlman (1996), “A new and efficient image codec based on set partitioning in hierarchical trees“, IEEE Transactions on Circuits and Systems for Video Tech., vol. 6, pp. 243–250.
- W.S. Geisler, M.S. Banks, “Visual Performance“, Handbook of Optics – Vol. 1, McGraw-Hill, NY, USA, 1995.
- A.B. Watson, L.B. Kreslake: “Measurement of Visual Impairment Scales for Digital Video“, Human Vision and Electronic Imaging Conference, San Jose, CA, USA, SPIE Vol. 4299, Jan. 2001, 2001, pp. 79 – 89.
- www.GE Medical System.com (database).
