The potential of tax impact on the economic inequality of citizens in Russia

Author: Pugachev A.A.
Journal: Economic and Social Changes: Facts, Trends, Forecast @volnc-esc-en
Section: Public finance
Article in issue: 1 т.17, 2024.
Free access
In Russia, the possibilities of smoothing inequality through taxes have not been implemented, despite the consistently high inequality, its acute perception by citizens and attention to the problem at the highest level of government. The aim of the study is to determine the possibilities for smoothing the economic inequality of citizens in Russia with the help of tax instruments. The hypothesis of the study is that the set of instruments of income, indirect and property taxation of citizens in Russia has a significant unrealized potential for smoothing economic inequality. To test the hypothesis, we use correlation and regression analysis and decomposition of tax instruments according to areas (income, property and indirect) and explore the dependence of inequality indicators on tax tools used for smoothing inequality. Based on the data from Rosstat, Federal Tax Service, World Bank, OECD, Credit Suisse and the World Inequality Database, a Data Set was formed which includes 2.6 thousand indicators. The calculations were performed using the Data Analysis Toolpak in MS Excel. The relevance of personal income tax deductions was assessed by using sociological survey dat. It was established that the current tax instruments do not help to smooth inequality in Russia, and sometimes, on the contrary, lead to its growth. It seems advisable to smooth inequality within the framework of income taxation by increasing the progression of personal income tax and introducing a tax-free minimum in conjunction with the minimum wage, increasing the share of social tax deductions. In the field of property taxes, it is advisable to increase the tax burden for owners of expensive or many objects of property, and provide the targeting of tax benefits. In terms of indirect taxes, it is expedient to reduce VAT on goods and services that make up the bulk of consumption expenses of the least well-off citizens, for example, housing and communal services, and to increase VAT on items that form the basis of consumption of the rich, for example, the return of the 20% rate on recreation, hotels, cafes and restaurants. The potential of tax administration in smoothing inequality is determined by the possibilities of ensuring the completeness of taxation of current income, capital and consumption of the most affluent citizens.
Economic inequality, income inequality, wealth inequality, consumption inequality, smoothing, personal income tax, tax deductions, vat, property taxes
Short address: https://sciup.org/147243326
IDR: 147243326 | UDC: 336.226:316.344.23 | DOI: 10.15838/esc.2024.1.91.8
Text of the scientific article The potential of tax impact on the economic inequality of citizens in Russia
The research was carried out at the expense of Russian Science Foundation grant 23-28-00365,
Overcoming inequality among citizens is one of the Sustainable Development Goals up to 2030, established by the UN General Assembly1. The World Economic Forum records that OECD countries are characterized by the highest inequality level in half a century2.
In Russia, citizens’ inequality has been at a consequently high level since the period of market reforms: since 1990s, the Gini coefficient has been between 0.36 and 0.42, as estimated by both Rosstat and the World Bank. According to Russian sociological studies, up to 70% of citizens suffer from income inequality, up to 50% – from inequality in access to medicine, up to 40% – from inequality in access to jobs, up to 36% – from inequality in housing conditions, and up to 26% – in children’s development opportunities (Mareeva, 2018, p. 105; Mareeva, et al., 2022, p. 54). “Inequality is manifested in various spheres of life and goes far beyond financial well-being” (Ilyin, 2017, p. 20). At the same time, the inequality of citizens’ income is determinant.
Sociological studies confirm that inequality in Russia is perceived rather acute, as well as the state’s efforts to mitigate it are assessed: 68% of Russians are convinced that “the state should be the leading actor in the fight against inequality”, while 48% of citizens believe that the state is failing in the task of reducing inequality (Belekhova, 2023, p. 175).
Despite the focused attention to the problem, there are still many debatable issues within it. If we talk about citizens’ economic inequality, do we mean income inequality, inequality of accumulated capital, or inequality of consumption? Is the income inequality the inequality of current or lifelong, disposable or market, individual or household income? (Kapeliushnikov, 2017, p. 119). The most significant question is concerning the inequality measurement. “The economic inequality is not a physical object, which can be measured with a ruler, in length, width and height, and multiplied to get a volume value. No assessment of the inequality scales can be considered an ‘objective fact’” (Kapeliushnikov, 2019, p. 95).
The main cause of citizens’ inequality in Russia “lies not in the lack of resources, but in the mechanisms of their distribution and redistribution” (Shevyakov, 2011, p. 72). On empirical data on citizens’ income inequality before and after taxation during the period of the flat personal income tax scale, it is proved that “the current system of distributive relations in Russia does not contribute to the reduction of socio-economic inequality, but strengthens the existing disparities in society”: the ratio of the average income of the richest 10% and the poorest 10% on income after taxation is higher by 0.4–1.3 (Kostyleva, 2011, p. 72). “Only such a tax system can be considered fair, in which after-tax reduction of inequality in the economic situation of taxpayers is achieved” (Panskov, 2020, p. 28). The fairness of tax policy should be assessed by its ability to reduce the inequality degree in the distribution of income and wealth (Shmelev, 2017, p. 120; Wilkinson, Hageman, 2023).
One of the debatable issues is also the definition of the perimeter of opportunities for the application of tax instruments to mitigate inequality. With its consistently high level and attention to the problem at the top level, Russia has not realized the possibilities of tax instruments. What is their potential?
Under the economic inequality of citizens, we understand the inequality of citizens’ welfare in a broad sense, which depending on the tax instruments of influence is classified into inequality of current income, inequality of accumulated capital (wealth inequality or monetary inequality) and inequality of consumption. Accordingly, we will distinguish the instruments of income, property and indirect taxation (Pugachev, 2023, p. 23).
Income taxation is a key tool for smoothing income inequality of citizens. In Russia, “the existing socio-economic differentiation is due to the shortcomings of the system of personal income taxation” (Pinskaya, 2015, p. 90). PIT does not contribute to the smoothing of social inequality in Russia, while there are models of income taxation aimed at leveling the differentiation of income levels of various strata of the population while maximizing the fiscal effect of PIT (Goncharenko et al., 2019). “Tax reform has not brought with it a solution to the problem” of inequality, since the current design of personal income tax, among other things, “lacks a non-taxable minimum of personal income as an instrument of social protection of the population” (Gromov, 2021, pp. 3–4). The system of tax deductions leads to hidden regression of personal income tax, as property and social tax deductions are not available to persons with low incomes (Melnikova, Tikhonova, 2018, p. 1105). The key argument of supporters of reducing the progressivity of income taxation is tax evasion when rates are raised. However, using the example of the increase in the marginal income tax rate in the United States in 2013, it was found that the behavioral response of tax evasion of the wealthiest taxpayers is shortterm: in 2015, the share of the highest incomes in the United States began growing again (Saez, 2017, p. 114).
The property taxation mechanisms in the area of inequality smoothing are also designed to help ensure control over the conformity of income and accumulated capital (control over the transfer of ownership of expensive property), as well as inheritance and donation. The control potential of property taxation to smooth inequality is significant in the current Russian context (Malis, 2023, p. 20). In Russia, “with regard to the richest citizens it is advisable to introduce increased property tax rates on expensive property, as it is done in OECD countries” (Vylkova, 2022, pp. 123–124). At the same time, for the European Union countries there is no significant impact of property taxes on the smoothing of inequality, as well as their negative impact on economic growth (Dianov et al., 2022, p. 16).
Indirect taxation, based on the differences in the consumption patterns of the rich and the poor, can be aimed at reducing inequality by differentiating tax rates. It is advisable to set lower rates for everyday goods and necessities (Giffen goods, which constitute a significant share in the consumer basket of low-income citizens) and higher rates for expensive goods (Veblen goods) (Maiburov, 2023, p. 112). Regarding the impact of indirect taxes on citizens’ inequality, researchers have not formed an unambiguous position. For example, for Latin American countries between 1990 and 2010, it is substantiated that an increase in the share of direct taxes compared to indirect taxes contributed to inequality reduction (Martorano et al., 2018). On the other hand, in OECD countries, indirect taxes had a significant impact on reducing inequality (between 1978 and 2012) (Ciminelli et al., 2017). The impact of indirect taxes on inequality remains debatable, as there are studies indicating that indirect taxation has an insignificant impact on inequality and that smoothing inequality cannot justify lower rates (Blasco et al., 2020).
The aim of the research is to determine the possibilities of smoothing citizens’ economic inequality in Russia with the help of tax instruments.
The research hypothesis is the following: the set of instruments of income, indirect and property taxation of citizens in Russia has a significant unrealized potential for smoothing the economic inequality of citizens. The use of tax instruments along with other state mechanisms of inequality smoothing can provide an effective impact on Russians’ economic inequality.
The scientific novelty of the study consists in substantiating the existence of unrealized potential and opportunities for smoothing the citizens’ economic inequality in Russia through the complex impact of income, property and indirect taxation instruments on income, wealth and consumption inequality, respectively.
The theoretical significance is determined by the deepening of scientific understanding of the potential of the integrated application of income, property and indirect taxation instruments in smoothing citizens’ inequality. The research results can serve as a starting point for specifying the parameters of promising tax instruments for smoothing Russians’ inequality: differentiation of tax rates, establishment of tax deductions and exemptions, development of tax administration.
The practical significance of the study lies in the possibility of using the results to develop a set of tax measures to smooth citizens’ economic inequality in Russia.
Methods and information base of the research
To test the hypothesis, we applied correlation and regression analysis of dependencies of indicators of citizens’ inequality on the following indicators:
– average per capita money income, average monthly wages and social payments to estimate the modified curve of S. Kuznets (Kuznets, 1955) in identifying the inequality determinants in Russia – income taxation and social transfers;
– social tax deductions for personal income tax;
– share of VAT in GDP and tax revenues of the budget, share of goods taxed at 10% VAT rate in the total volume of VAT to assess the impact of indirect taxes on inequality;
– share of individual taxes in GDP across OECD countries (due to the availability of statistics since 1965) to assess the impact of the tax burden structure on inequality.
We also carried out the structural and dynamic analysis of the tax deductions volume on personal income tax to assess their demand by taxpayers, tax revenues of budgets on individuals’ property taxes to assess their fiscal significance and potential in smoothing inequality.
We calculated the average effective VAT tax rate for the least and most affluent citizens, based on Rosstat data on the consumption structure of the first and tenth decile groups by expenditure items.
We made calculations using the Data Analysis package in MS Excel.
The information base of the research is the data on inequality from Rosstat, the World Bank, OECD, Credit Suisse and the World Inequality Database, tax data from OECD, the Federal Tax Service of the Russian Federation (reports 1-NM, 1-DDK, 5-NDFL, 5-TN, 5-MN) and data from a sociological survey. We conducted the survey in 2022 by a continuous questionnaire survey of 1,063 respondents from 45 constituent entities of the Russian Federation. The questionnaire was conducted indirectly using Google Forms. The respondents included 70% of women and 30% of men, 89% of urban residents and 11% of rural residents, 19% with secondary and 81% with higher education.
The sample is representative of the research task to assess the demand for personal income tax deductions by respondents of different income groups, since the range of the average monthly personal income level, the sample of respondents is subject to normal distribution and corresponds to the Rosstat data on the distribution of personal income (Fig. 1).
Eleven percent of respondents have incomes up to 15 thousand rubles, i.e. below the minimum wage and subsistence minimum in 2021, 40% – from 15 to 40 thousand rubles, i.e. below the level of average per capita cash income of the population (40.04 thousand rubles/month for 20213), 37% – from 40 to 100 thousand rubles, i.e. above average, 11% – from 100 to 400 thousand rubles, 1% of respondents (11 people) responded that they have incomes above
400 thousand rubles/month, the potential income of these citizens falls under the increased personal income tax rate of 15%.
Personal income tax and tax deductions in smoothing income inequality among citizens
In the framework of testing the modified curve of S. Kuznets for Russia on the data of Rosstat from 1998 to 2021 on inequality and income of citizens, we find that personal income tax does not have a significant impact on citizens’ inequality; if there is its reduction, it is only due to state social transfers (Tab. 1) .
Unlike real money income, wages and salaries include personal income tax and exclude nontaxable income and social benefits. To exclude the inflation factor, we carried out the transition to real indicators using the consumer price index (CPI). We used the Gini coefficient of income as the resulting indicator – according to Rosstat data.
Figure 1. Respondents’ distribution by level of average monthly personal income
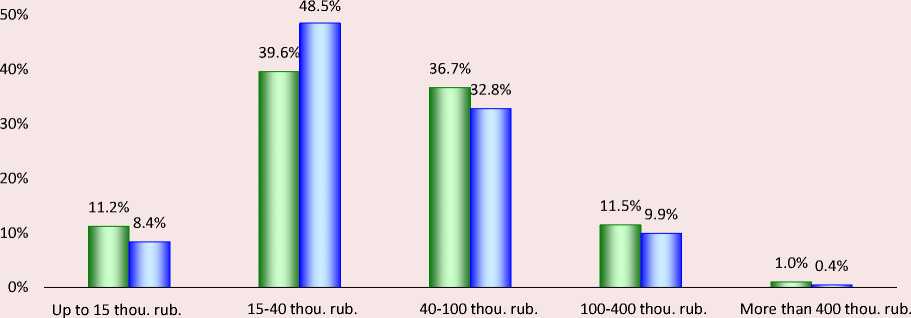
□ Distribution of sociological survey by personal income
□ Rosstat distribution of accrued wages and salaries
Note. Rosstat provides data on accrued wages in the following ranges: up to 16.65 thousand rubles, from 16.65 to 45 thousand rubles, from 45 to 100 thousand rubles, from 100 to 400 thousand rubles and over 400 thousand rubles.
Source: own compilation based on the results of the sociological survey and Rosstat data (Inequality and poverty. Rosstat. Available at: (accessed: February 11, 2024)).
3 Average and modal level of money incomes. Rosstat. Available at: (accessed: February 9, 2024).
Table 1. Results of correlation and regression analysis of the dependence of the inequality level on the income indicators of Russian citizens in 1998–2021
|
Indicator |
Correlation coefficient r |
Determination coefficient R2 |
|
Real average per capita cash income |
0.846 |
0.716 |
|
Average monthly real accrued wages and salaries |
0.774 |
0.599 |
|
Real average per capita cash income excluding social payments |
0.881 |
0.776 |
|
Note: significance level α by Fisher’s F-criterion 0.0001. Source: own compilation. |
||
The wage factor showed the least close relationship with the inequality level of the three income indicators studied; it means that the income inequality is determined not only by wages, including personal income tax, but also by other incomes. The dependence on the indicator of money income turned out to be closer, i.e. the income of the population as a whole after taxation determines inequality to a greater extent than only wages. When social payments were excluded from the population’s money incomes, the relationship became the closest. R2 amounted to 0.776, which means that the change in real average per capita cash income excluding social payments by 77.6% explains the dispersion of the income inequality level (according to the Gini coefficient of Rosstat).
Social transfers, in contrast to income taxation, determine the relationship between the income inequality level and the income itself, which occurs due to the emergence of additional cash income of the least well-off population segments.
The current dependence of inequality on citizens’ income in Russia is on the ascending branch of the curve S. Kuznets, i.e. inequality increases with growing wealth.
Tax deductions are provided within the framework of personal income tax to mitigate citizens’ inequality. Standard and social deductions on personal income tax are designed to help reduce citizens’ inequality, but their share in the structure of deductions and absolute amounts are insignificant (Tab. 2) .
Table 2. Structure of personal income tax deductions in 2021
|
Deductions |
Deductions provided |
Number of taxpayers |
||
|
billion rubles |
share, % |
thousand |
share, % |
|
|
Investment |
218.8 |
3.8 |
459.9 |
1.7 |
|
Social, including |
218.7 |
3.8 |
3 939.2 |
14.5 |
|
on training expenses |
42.5 |
0.7 |
956.1 |
3.5 |
|
on medical expenses |
128.2 |
2.3 |
2 049.9 |
7.6 |
|
Property, including |
4 929.5 |
86.5 |
7 216.2 |
26.7 |
|
on sales revenue |
2 463.0 |
43.2 |
1 153.4 |
4.3 |
|
on expenses, including |
2 466.5 |
43.3 |
6 062.8 |
22.4 |
|
for purchase |
2 086.6 |
36.6 |
4 552.7 |
16.8 |
|
on interest on loans and borrowings |
379.9 |
6.7 |
1 510.1 |
5.6 |
|
Standard |
329.9 |
5.8 |
15 461.3 |
57.1 |
|
Professional |
2 857.6 |
- |
178.9 |
- |
|
Deductions in the amount of expenses (losses) related to income from securities transactions |
36 070.8 |
- |
5 723.2 |
- |
|
Total amount, excluding professional and securities deductions |
5 696.9 |
100 |
27 076.6 |
100 |
|
Total amount of deductions |
44 625.3 |
- |
32 978.7 |
- |
Assumption: We calculated the data on the number of taxpayers by aggregating by individual types of deductions (ignoring the possibility of different types of deductions for the same taxpayer) to illustrate the demand for different deductions by taxpayers.
Source: own compilation based on the data of 1-DDK and 5-PIT of the Federal Tax Service.
In 2021, social deductions accounted for 3.8% and standard deductions for 5.8% of the total structure of PIT tax deductions, excluding deductions for securities transactions and professional deductions. At low volumes, social and standard deductions are available to taxpayers (e.g., standard deduction for children). For instance, standard deductions are used by more than 15 million taxpayers, i.e. almost every fourth taxpayer, and social deductions – about 4 million.
According to the results of correlation and regression analysis, we found that social deductions on personal income tax did not affect the citizens’ welfare, but could contribute to the smoothing of inequality. For the period from 2009 to 2021, we investigated the relationships between the amount of social tax deductions and the level of inequality and welfare of citizens. The indicator-factor was the share of social tax deductions reimbursed to taxpayers from the budget in the volume of personal income tax revenues to the budget, and the resulting indicators were the Gini coefficient and quintile coefficient, reflecting the income inequality level, and welfare indicators – the share of the population with cash incomes below the subsistence minimum, the ratio of average per capita cash income of the population to the subsistence minimum, real disposable income. We increased an inverse relationship between inequality indicators and the share of social tax deductions: the citizens’ inequality level decreases with the increase in the share of social deductions in the amount of personal income tax receipts. The coefficient of determination R2 amounted to 0.562 and 0.702 for the Gini coefficient and quintile coefficient, respectively, at the significance level α by Fisher’s criterion of 0.01. We found no statistically significant relationship with wealth indicators.
The main share of deductions (excluding professional and securities transactions) – 86.5% – is formed by property deductions. They are almost equally distributed between income from the sale of property and expenses for its purchase. At the same time, property deductions are hardly available for citizens of the lower income deciles, since they are not characterized by real estate transactions. Property deductions are mainly used by citizens with middle and high income, who have the means for real estate transactions and a real opportunity to improve their living conditions. This statement is confirmed by the fact that there are three times fewer taxpayers who claimed a deduction for interest expenses, i.e., using the loan to purchase a home, than taxpayers, claimed a deduction in the case of the real estate acquisition in general. It is important to remember that the interest deduction can be claimed during the entire term of the mortgage loan, i.e., up to 30 years, as well as taking into account the time lag due to the possibility of receiving an interest deduction after the home purchase deduction. Since trend is a multi-year steady one (2020 – 3.1 times, 2019 – 3.4 times, 2018 – 3.8 times), we can conclude that most taxpayers who claimed the deduction in recent years purchased a home with their own funds without taking out a loan. Otherwise, given the accumulated number of taxpayers who claimed the interest deduction in previous years and continue receiving it, their number should exceed the number of taxpayers who claimed the home purchase deduction.
Investment deductions are also inaccessible to low-wealth individuals due to the lack of funds for investment. Professional and securities deductions stand apart from inequality mitigation because they have a priori different objectives.
The use of the bulk of personal income tax deductions by citizens with medium and high incomes reduces the average effective rate for them, which may lead to a regressive nature of income taxation, when taxpayers with high incomes, taking into account deductions, pay personal income tax at a lower effective rate than taxpayers with low incomes.
Figure 2. Demand for personal income tax deductions by income groups of respondents
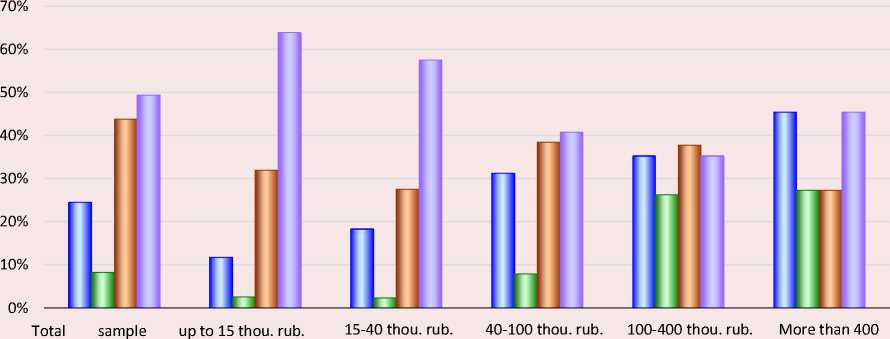
thou. rub.
□ Property □ Investment □ Social □ I do not use withholdings
Source: own compilation according to the sociological survey results.
The thesis about the lack of demand for investment and property deductions for personal income tax by the least well-off citizens is also confirmed by the sociological survey results (Fig. 2) .
With growing respondents’ income the demand for property and investment deductions for personal income tax increases, while social deductions are more evenly distributed across income groups of respondents.
In general, the current preponderance of property deductions on personal income tax to the detriment of social and standard deductions does not allow realizing their potential in reducing inequality and poverty.
The introduction of a progressive personal income tax scale in Russia from 2021 with a rate of 15% for incomes over 5 million rubles per year is generally not able to significantly affect the smoothing of inequality because it requires, first, a significantly higher rate of progression to “cut the spire of excess income”, and second, a nontaxable minimum, linked to the level of the minimum wage, to increase the disposable income of the least well-off citizens, which is currently absent. I.A. Maiburov in 2015, long before the introduction of progression, suggested that “the income tax reform may not meet the expectations of the poor and the stratification of Russian society by income will not be reduced, as the use of too soft progression scale is proposed” (Maiburov, 2015, p. 174). Nevertheless, the introduction of a progressive scale becomes the first necessary but insufficient step toward ensuring the smoothing of Russians’ inequality through personal income tax.
Income tax in other countries is a significant tool for smoothing the citizens’ inequality. For example, in the United States, with a fixed increase in income inequality from 1980 to 2014, the share of disposable income after tax received by the richest 10% of citizens increased from 30 to 40%, while before taxation – from 35 to 47%, i.e. even more significantly (Piketty et al., 2018). We should note that when criticizing the research results of T. Piketty’s team, specialists from the U.S.
Department of the Treasury and the Committee on Taxation of the U.S. Congress found that taxes in the United States further reduce the citizens’ inequality level (Auten, Splinter, 2023). In OECD countries, income tax also has a smoothing effect on income inequality (Guillaud et al., 2017).
Possibilities of smoothing citizens’ wealth inequality through property taxes
Rosstat does not estimate wealth inequality in Russia (Pugachev, 2023, p. 155), nevertheless we can judge it from the data of Credit Suisse and World Inequality Database, which indicate excessively high inequality in wealth distribution.
According to the World Inequality Database, the richest 1% of Russians have half of the wealth, their share from 1995 to 2021 increased 2.2 times, from 21.5 to 47.6%. In contrast, the share of wealth of the 50% of the least wealthy citizens decreased from 8.5 to 3.1%, i.e. 2.7-fold4. Credit Suisse estimates the concentration of wealth in Russia to be even higher: for the richest 1%, 5% and 10% of Russian citizens it reaches 58%, 77% and 83% respectively. The wealth Gini coefficient is 0.88 in 20215.
The instruments of property taxation are supposed to contribute to the smoothing of such high inequality in wealth distribution. However, in Russia there are few such specialized instruments implemented in the system of inequality smoothing:
– increasing coefficient of individuals’ transportation tax for expensive cars (from 2022 – coefficient 3 for cars worth 10 million rubles or more);
– reduction of the tax base by the cadastral value of 20 m2 for apartments and 50 m2 for houses under personal property tax;
– tax benefits of a social nature.
An increasing coefficient of transportation tax6 for expensive cars was introduced in 2014. From 2022, only coefficient 3 is applied for cars costing from 10 million rubles not older than 10 years and from 15 million rubles from 10 to 20 years. Currently, in Russia, it is the only one among property taxes that directly contributes to smoothing citizens’ inequality. However, the number of such expensive cars is small – 12.78 thousand in 2022, which is 0.027% of the total number of cars subject to taxation (Tab. 3) . Tax revenues of the “luxury tax” in 2022 amounted to 1.26% of the total amount, or 2.13 billion rubles. In the case of insignificance, the very fact of such a tax and its dynamics is positive for the Russian
Table 3. Budget revenues from transportation tax of individuals with the application of an increasing coefficient for expensive cars
|
Indicator |
2020 |
2022 |
|
Total cars subject to taxation thousand units, including |
41 594.7 |
47 091.66 |
|
with application of increasing coefficient 3, thousand units |
6.3 |
12.78 |
|
Share, % |
0.015 |
0.027 |
|
Amount of citizens’ transportation tax payable, billion rubles |
158.37 |
167.24 |
|
with the application of increasing coefficient 3, billion rubles |
0.95 |
2.13 |
|
Share, % |
0.6 |
1.26 |
|
Source: own compilation based on the data of the FTS tax returns 5-TN. |
||
4 Russian Federation. World Inequality Database. Available at: (accessed: January 8, 2024).
5 Global Wealth Report 2022. Credit Suisse. Available at: (accessed: January 8, 2024).
6 It is the so-called “luxury tax”.
practice – in relation to 2020, tax revenues and the number of cars subject to the increased coefficient more than doubled in 2022.
Reduction of the property tax base by the cadastral value of 20 m2 for apartments and 50 m2 for houses and tax exemptions for certain categories of taxpayers for property, transportation and land taxes can only conditionally be considered as contributing to the smoothing of inequality. For small properties, due to the exclusion of part of the area, the effective tax rate will be lower than for large properties. This measure indeed contributes to the smoothing of inequality. However, the cadastral value of real estate is not taken into account, which results in a higher amount of tax for inexpensive but spacious apartments compared to elite real estate.
Tax exemptions for certain categories of citizens are also intended to improve the welfare of low-income citizens, for instance, pensioners, but the lack of targeting of tax exemptions can lead to the opposite effect if, for example, the pensioner is rich. There is a situation when benefits are distributed evenly among taxpayers of different levels of wealth or shifted toward wealthier owners of property that the poor do not have. The abundance of tax benefits and their high prevalence are also noteworthy (Tab. 4). In 2022, 38.5% of taxpayers used benefits, and the amount of tax not paid due to the application of benefits reached 76.5 billion rubles, or 22%. Thus, for land tax every second taxpayer receives a privilege, and for property tax the amount not paid in connection with the provision of privileges amounted to 36.6% of the tax amount.
To provide the smoothing of money inequality through property taxes, it is necessary, on the one hand, to ensure an increase in the tax burden for owners of expensive or multiple properties, on the other hand, to ensure the targeting of tax benefits, when not only the category of the taxpayer is taken into account, but also their actual ability to pay, similar to the way it is implemented today, for example, for social benefits for children from 3 to 7 years old with the introduction of neediness criteria that take into account not only the income (average income), but also the actual ability to pay.
It is interesting to mention the experience of other states. For example, in Belarus, until 2022, a double property tax rate was established for citizens owning more than one property. In the UK, USA, Germany, Austria, China, progressive rates of property taxes are applied, which contributes to the redistribution of the tax burden from the least wealthy to wealthier citizens.
Most developed countries have inheritance and gift taxes and capital taxes; they also contribute to reducing wealth inequality, especially since property received free of charge by inheritance or gift is nonlabor income. In Russia, inheritance and gift tax was in force until 2005. It was progressive: the rate depended on the value of the property and the
Table 4. Property tax relief for citizens in 2022
Property taxes in Russia have a serious potential for smoothing the monetary inequality of citizens, given that the tax burden on property taxes of individuals is lower relative to developed countries. For example, in Russia the share of property taxes of individuals in the total amount of tax revenues of the consolidated budget is about 1%, while in developed OECD countries it can reach 5–8% (Tab. 5) .
In Russia, with a low level of property taxes in the total tax revenues of the budget, the wealth inequality level is higher: in Russia, the Gini coefficient on accumulated capital amounted to 0.88 in 2021 (reaching 0.9), while in OECD countries it is 0.65–0.79.
Indirect taxes and consumption inequality among Russians
The consumption economy predetermines the most vivid manifestation of citizens’ consumption inequality at the everyday level, which actualizes the need to activate the instruments of indirect taxation to influence the inequality. The possibility of smoothing consumption inequality using the VAT is conditioned by the difference in the consumption structure of the least and most affluent citizens. Rosstat records the volume and structure of citizens’ consumption by decile groups, which is presented in Table 6 as the example of 2022.
The main share of expenditures of the least well-off citizens is spent on household food and housing
Table 5. Fiscal importance of citizens’ property taxes and inequality level in wealth distribution in different countries
|
Country |
Share of property taxes of citizens in total tax revenues, % |
Gini coefficient on wealth, 2022 |
||||
|
2010 |
2015 |
2019 |
2020 |
2021 |
||
|
Canada |
9.18 |
8.80 |
8.32 |
8.59 |
7.92 |
0.726 |
|
United Kingdom |
5.55 |
5.53 |
5.75 |
6.26 |
5.91 |
0.706 |
|
Switzerland |
4.63 |
4.88 |
5.24 |
5.56 |
5.49 |
0.772 |
|
France |
5.75 |
6.13 |
5.42 |
5.31 |
5.07 |
0.702 |
|
Norway |
1.62 |
1.56 |
1.70 |
1.83 |
1.46 |
0.769 |
|
Japan |
0.94 |
1.20 |
1.31 |
1.31 |
1.47 |
0.649 |
|
Germany |
0.98 |
1.03 |
0.95 |
1.13 |
1.11 |
0.788 |
|
Russia |
1.14 |
1.28 |
1.15 |
1.32 |
1.00 |
0.88 |
|
Turkey |
1.00 |
1.08 |
1.08 |
1.04 |
0.96 |
н/д |
|
Poland |
1.07 |
1.16 |
0.96 |
0.97 |
0.90 |
н/д |
|
Latvia |
0.06 |
0.42 |
0.54 |
0.54 |
0.53 |
н/д |
Source: own compilation based on the data of OECD and Credit Suisse (Tax Revenue Buoyancy in OECD Countries. Revenue Statistics 2023. Available at: (accessed: January 10, 2024); Global Wealth Report 2022. Credit Suisse. Available at: (accessed: January 8, 2024)).
Table 6. Structure of final consumption expenditures of the first and tenth decile groups of the Russian population in 2022, %
Item of expenditure First group Tenth group Ratio of the tenth group to the first, times Household food 51.7 20.4 0.39 Clothes and shoes 7.5 6.3 0.83 Housing and utilities 13.0 9.6 0.74 Home appliances 0.3 1.0 3.08 Transport 5.7 26.9 4.76 Communication 5.3 3.0 0.57 Healthcare 2.8 3.8 1.34 Education 1.1 1.3 1.20 Vacation 1.9 6.8 3.60 Hotels, cafes, restaurants 0.7 4.4 6.62 Financial and insurance services 0.4 1.8 4.26 Source: own compilation according to Rosstat data (Inequality and poverty. Rosstat. Available at: (accessed: January 12, 2024)). and utilities – 65%, while the most well-off spend 30% on these items. The most significant excess of the expenditure structure of the tenth decile group over the first decile group was formed for transportation, vacation, hotels, cafes, restaurants and financial and insurance services. Total expenditures for final consumption in 2022 amounted to 7,985 rubles for the first decile group and 63,400 rubles for the tenth decile group, the ratio is 7.94 times. The caloric content of the daily diet for the tenth group averaged 2,937 Kcal, and for the first group – 1,972 Kcal, i.e. 1.5 times less.
The ratio of the cost structure of the most and least well-off citizens can serve as an indicator of the application of differentiated VAT rates to smooth consumption inequality. Russia currently has a reduced VAT rate of 10% on food products, which helps to reduce the tax burden on the least well-off citizens. At the same time, as part of anti-crisis measures of tax support for business in 2022, the VAT rate was set at 0% for hotels, cafes, restaurants and tourism, which form a more significant share in the expenditures of the most affluent citizens with a low share in the expenditures of the poor. Accordingly, this lowers the tax burden for the richest.
To compare the average effective VAT rate for the first and tenth decile groups, we calculated as a weighted average of the share in the cost structure according to Table 6. We assume that the following VAT rates are applied to cost items in general: healthcare, vacation, hotels, cafes, restaurants, financial insurance services – 0%, home catering – 10%, all other items – 20%. As a result, the average effective rate for the first decile group was 13.21%, and for the tenth decile group –14.0% (0.79 p.p. higher).
To reduce the level of inequality, it seems reasonable to lower the VAT rate for housing and utilities to 10%, similar to food products, and to return the rate to 20% for vacation, hotels, cafes and restaurants. In this case, the average effective VAT rates for the first and tenth decile groups will be 12.45% (-0.76 p.p.) and 15.82% (+1.82 p.p.), and the difference in rates will increase from 0.79 to 3.37 p.p., i.e. 4.3 times.
Differentiation of VAT rates, in addition to ensuring the smoothing of consumption inequality, is logically built into the concept of controlling the comparability of expenditures and taxpayer’s income level.
To assess the impact of indirect taxation on citizens’ inequality in Russia, we choose the Gini coefficient and the decile coefficient on consumption expenditures as the resulting indicators within the framework of correlation and regression analysis, and the share of VAT in GDP and tax revenues of the consolidated budget, as well as the share of VAT paid at the rate of 10% in the total volume of VAT – as the indicator-factors. The analysis is based on the data of Rosstat and the Federal Tax Service of the Russian Federation for 1992–2021 (Tab. 7) .
The relationship between VAT and inequality indicators is inverse: the higher the share of VAT, the lower the inequality. The relationship between the Gini coefficient and the share of VAT in GDP and in total tax revenues is strong, while the relationship between the share of VAT at the rate of 10% in total VAT and inequality indicators is weak. Accordingly, the expansion of the study period becomes the reason for increasing the closeness of the relationship, as for the factors of the share of VAT in GDP and in the total amount of tax revenues of the budget includes the period of the 1990s, when Russia had a progressive income tax, and the share of VAT in tax revenues was lower than now. As a whole, this aspect indicates that VAT in Russia does not have a significant impact on inequality, and the higher R2 in some years with lower inequality is a consequence of other factors.
Assessing the impact of the tax burden structure on citizen inequality
We carried out the assessment by means of correlation and regression analysis of the impact of the tax burden structure on individual taxes on citizens’ inequality. As an indicator of inequality, we chose the Gini coefficient. We calculated their shares in GDP to decompose the tax burden structure by individual taxes. We carried out the estimates for OECD countries for 2000 and 2020 on the basis of OECD and World Bank data (Tab. 8).
The closest of the analyzed correlation with the inequality level is characteristic of the share of all taxes in GDP, and since this indicator takes into account the severity of the tax burden rather than its structure, the level of tax burden, rather than its structure, has a decisive impact on inequality. In OECD countries, a 58-74% trend in the share of taxes in GDP explains the change in the inequality level. The share of income tax in GDP of OECD countries consistently has a marked relationship with the Gini coefficient, R2 = 0.33. The impact on inequality of indirect taxes decreased in OECD countries in 2020 compared to 2000. This occurred against the background of a decrease in the share of indirect taxes in total tax revenues from 32.6 to 30.6%. The dynamics of the share of the tax in the tax burden structure coincides with the change in the impact of this tax on the inequality level.
Table 7. Results of correlation and regression analysis of the impact of indirect taxation on citizen inequality in Russia
|
Result |
Factor – share of VAT |
Period |
Correlation coefficient r |
Determination coefficient R2 |
|
Gini coefficient |
In total tax revenues of the consolidated budget |
1992– 2021 |
-0.855 |
0.731 |
|
In GDP |
1995– 2021 |
-0.893 |
0.797 |
|
|
Paid at the rate of 10% in the total volume of VAT |
2010– 2021 |
-0.613 |
0.3757 |
|
|
Decile coefficient by consumption expenditure |
2012– 2021 |
-0.1129 |
0.0011 |
Note: significance level α by Fisher’s F-criterion 0.01.
Source: own compilation based on Rosstat data and tax reports1-NM of the Federal Tax Services.
Table 8. Results of correlation and regression analysis of the dependence of the inequality level (according to the Gini coefficient) on the tax burden structure in OECD countries
Share of taxes in GDP Period Correlation coefficient r Determination coefficient R2 Income 2000 -0.573 0.329 2020 -0.569 0.324 Direct 2000 -0.595 0.354 Indirect 2000 -0.530 0.283 All taxes 2000 -0.862 0.743 2020 -0.765 0.585 Note: significance level α by Fisher’s F-criterion 0.01. We give the data only for significant and close relationships. Source: own compilation based on the World Bank and OECD data. (Income share held by highest 10%. World Bank. Available at: (accessed: January 14, 2024); Revenue Statistics. Available at: (accessed: January 14, 2024)).
Inequality in OECD countries in 2020 relative to 2000 has been smoothened by an increase in the share of income taxes and a reduction in indirect taxes due to income tax progression and the fact that consumption taxation has a greater impact on poor citizens who spend most of their income on current consumption.
Development of tax administration to smooth citizens’ inequalities
Tax administration has the potential to smooth inequality, primarily by ensuring the completeness of taxation of current income, capital and consumption of the wealthiest citizens. Currently, the directions of development of tax administration, contributing to the smoothing of citizens’ inequality, can be promising directions of technology development in terms of:
– administration of digital assets and revenues from digital assets, transactions in digital assets, goods and services;
– the completeness of taxation of citizens’ investment income;
– parsing real estate rental advertisement sites and developing information exchange between the Federal Tax Service and advertisement platforms;
– identification of unregistered properties using geospatial analytics services.
Discussion
The study confirms the hypothesis that the set of instruments of income, indirect and property taxation of citizens in Russia has a significant unrealized potential for smoothing the economic inequality of citizens. By means of decomposition of tax instruments by areas – income, property and indirect taxation – and application of correlation and regression analysis it is possible to prove that in each of the areas there are no effective measures for smoothing inequality; at the same time there is a potential for reducing inequality. In this respect, the results of the study correlate with the conclusions obtained earlier by other researchers about the possibility of overcoming inequality by improving distribution and redistributive instruments (Shevyakov, 2011, p. 72), that the current system of distributive relations in Russia does not contribute to the reduction of inequality and sometimes even increases the existing disparities (Kostyleva, 2011, p. 72), that the “soft” progression of personal income tax will not have a significant impact on inequality (Maiburov, 2015, p. 174).
The results obtained do not claim to be a complete assessment of all tax instruments that could contribute to the smoothing of economic inequality of citizens. The presented instruments can be supplemented, especially concerning the transformation of inequality over time. It is of interest, for example, to study the impact of excise taxes on citizens’ inequality, but today there are no statistics on the consumption of excisable goods by income groups.
The prospects for further research include the specification of the parameters of promising tax instruments to mitigate citizens’ inequality in Russia: differentiation of tax rates of personal income tax, VAT, property taxes, the establishment of the tax minimum and tax deductions, as well as tax benefits for property taxes, the development of tax administration. The results obtained can become a starting point for assessing the impact of these instruments both on citizens’ inequality level and on budget security.
Conclusion
The research results contribute to the deepening of scientific understanding of the potential of the integrated application of income, property and indirect taxation instruments to smooth citizens’ inequality. For Russia today this potential is significant, it has not been realized.
PIT does not ensure the reduction of inequality. The introduction of a progressive personal income tax rate of 15% is a necessary but insufficient first step to reduce inequality. The progression should be strengthened and a non-taxable minimum should be introduced. The current preponderance of property tax deductions on personal income tax (86.5% of total deductions) to the detriment of social and standard deductions does not allow realizing their potential. Social deductions can contribute to the smoothing of inequalities: not only by increasing the limits, but also, for example, by diversifying the limits of deductions depending on taxpayer’s income. The use of the bulk of tax deductions by citizens with middle and high incomes can lead to regressive nature of income taxation.
Property taxes have a significant potential for smoothing monetary inequality of Russians, given that their tax burden is 5–8 times lower than in developed countries. There are prospects for increasing the tax burden for the owners of expensive or multiple properties, luxury goods and ensuring the targeting of tax benefits, when not only the category of the taxpayer, but also their wealth is taken into account.
The possibility of smoothing consumption inequality with the help of VAT is conditioned by the difference in the consumption structure of the least and most affluent citizens. It is advisable to set lower VAT rates for goods and services that form the bulk of consumption expenditures of the least well-off citizens, for example, housing and utilities sector, and increase VAT rates for expenditures that form the basis of consumption of the most well-off citizens with a low share in the consumption structure of the poor, for example, return of the rate of 20% for vacations, hotels, cafes and restaurants. In this scenario, the average effective VAT rates for the first decile group decrease, while for the tenth decile group they increase.
The decisive influence on inequality is the tax burden level, but not its structure. The complex of instruments of income, indirect and property taxation of citizens has a significant unrealized potential for smoothing the Russians’ economic inequality.
References The potential of tax impact on the economic inequality of citizens in Russia
- Auten G., Splinter D. (2023). Income inequality in the United States: Using tax data to measure long-term trends. Journal of Political Economy, 11, 44. Available at: https://doi/epdf/10.1086/728741
- Belekhova G.V. (2023). The scale of inequality specifics of its perception in modern Russia. Ekonomicheskie i sotsial’nye peremeny: fakty, tendentsii, prognoz=Economic and Social Changes: Facts, Trends, Forecast, 16(1), 164–185. DOI: 10.15838/esc.2023.1.85.9 (in Russian).
- Blasco J., Guillaud E., Zemmour М. (2020). Consumption taxes and income inequality an international perspective with microsimulation. Luxembourg Income Study Working Papers Series, 785, 1–35.
- Ciminelli G., Ernst E., Giuliodori M., Meriola R. (2017). The composition effects of tax-based consolidations on income inequality. European Journal of Political Economy, 57(С), 107–124.
- Dianov S., Koroleva L., Pokrovskaia N. et al. (2022). The influence of taxation on income inequality: Analysis of the practice in the EU countries. Sustainability, 14(15), 9066. DOI: 10.3390/su14159066
- Goncharenko L.I. et al. (2019). Vliyanie podokhodnogo nalogooblozheniya na sotsial’noe neravenstvo v Rossii [Impact of Income Taxation on Social Inequality in Russia]. Moscow: Knorus.
- Gromov V.V. (2021). Non-taxable minimum in personal income tax design: Experience and prospects. Nalogi, 2, 3–8. DOI: 10.18572/1999-4796-2021-2-3-8 (in Russian).
- Guillaud E., Olckers M., Zemmour M. (2017). Four levers of redistribution: The impact of tax and transfer systems on inequality reduction. Luxembourg Income Study Working Papers Series, 695, 1–38. Available at: https://hal.archives-ouvertes.fr/hal-02735326/document
- Ilyin V.A. (2017). “Crony capitalism” – a source of social inequality in modern Russia. Ekonomicheskie i sotsial’nye peremeny: fakty, tendentsii, prognoz=Economic and Social Changes: Facts, Trends, Forecast, 10(6), 9–23. DOI: 10.15838/esc.2017.6.54.1 (in Russian).
- Kapeliushnikov R.I. (2017). Inequality: How not to primitivize the problem. Voprosy ekonomiki, 4, 117–139. DOI: 10.32609/0042-8736-2017-4-117-139 (in Russian).
- Kapeliushnikov R.I. (2019). Is economic inequality a universal evil? Voprosy ekonomiki, 4, 91–106. DOI: 10.32609/0042-8736-2019-4-91-106 (in Russian).
- Kostyleva L.V. (2011). Taxation as a mechanism for regulating population inequality. Ekonomicheskie i sotsial’nye peremeny: fakty, tendentsii, prognoz=Economic and Social Changes: Facts, Trends, Forecast, 3(15), 66–77 (in Russian).
- Kuznets S. (1955). Economic growth and income inequality. The American Economic Review, 45(1), 1–28.
- Malis N.I. (2023). New tasks of tax policy are aimed at balancing budgets at all levels. Finansy, 7, 15–20 (in Russian).
- Mareeva S.V. (2018). Social inequalities and the social structure of modern Russia as perceived by the population. Vestnik Instituta sotsiologii, 9(3), 101–120. DOI: 10.19181/vis.2018.26.3.527 (in Russian).
- Mareeva S.V., Slobodenyuk E.D., Anikin V.A. (2022). Public tolerance for social inequalities in turbulent Russia: Reassessing the role of subjective mobility. Monitoring obshchestvennogo mneniya: Ekonomicheskie i sotsial’nye peremeny=Monitoring of Public Opinion: Economic and Social Changes Journal, 1, 39–60. DOI: 10.14515/monitoring.2022.1.1982 (in Russian).
- Martorano B. (2018). Taxation and inequality in developing countries: Lessons from the recent experience of Latin America. Journal of International Development, 30(2), 256–273. Available at: https://doi.org/10.1002/jid.3350
- Mayburov I.A. (2015). Marking the centenary of income tax in Russia: Theoretical analysis of key stages of the reform. Journal of Tax Reform, 1(2-3), 161–176. DOI: 10.15826/jtr.2015.1.2.010 (in Russian).
- Mayburov I.A. (2023). Nalogovaya politika i tseli ustoichivogo razvitiya. Mirovoi opyt sopryazheniya [Tax Policy and Sustainable Development Goals. World Experience of Interfacing]. Moscow: Yuniti-Dana.
- Mel’nikova N.P., Tikhonova A.V. (2018). Property tax deductions and fairness of personal income taxation. Mezhdunarodnyi bukhgalterskii uchet=International Accounting, 21(9), 1100–1112. DOI: https://doi.org/10.24891/ia.21.9.1100 (in Russian).
- Panskov V.G. (2020). On the new personal income tax rate. Finansy, 8, 25–29 (in Russian).
- Piketty T., Saez E., Zucman G. (2018). Distributional national accounts: Methods and estimates for the United States. The Quarterly Journal of Economics, 133(2), 586–587.
- Pinskaya M.R. (2015). Approaches to understanding the tax equality. Journal of Tax Reform, 1(1), 90–99. DOI: 10.15826/jtr.2015.1.1.006 (in Russian).
- Pugachev A.A. (2023). Economic inequality of citizens beyond averages: Assessment in the conditions of its transformation. Ekonomicheskie i sotsial’nye peremeny: fakty, tendentsii, prognoz=Economic and Social Changes: Facts, Trends, Forecast, 16(3), 141–158. DOI: 10.15838/esc.2023.3.87.7 (in Russian).
- Pugachev A.A. (2023). The impact of indirect taxation on inequality in Russia. Journal of Tax Reform, 9(1), 19–33. Available at: https://doi.org/10.15826/jtr.2023.9.1.126
- Saez E. (2017). Taxing the rich more: Preliminary evidence from the 2013 tax increase. Tax Policy and the Economy, 31(1), 71–120. DOI: 10.1086/691084
- Shevyakov A.Yu. (2011). Mify i realii sotsial’noi politiki [Myths and Realities of Social Policy]. Moscow: M-Studio.
- Shmelev Yu.D. (2017). On criteria for assessing the effectiveness and fairness of the state tax policy. Ekonomika. Nalogi. Pravo=Economics, Taxes & Law, 2, 113–120 (in Russian).
- Vylkova E.S. (2022). Improving the taxation of the property of individuals in the Russian Federation as a tool to reduce social inequality. Ekonomika. Nalogi. Pravo=Economics, Taxes & Law, 15(3), 118–126. DOI: 10.26794/1999-849X 2022-15-3-118-126 (in Russian).
- Wilkinson B.R., Hageman A.M. (2023). The role of political elites in income tax system design and tax fairness. The British Accounting Review, 55(3), 101172. Available at: https://doi.org/10.1016/j.bar.2022.101172
