The Pre-Processing Techniques for Breast Cancer Detection in Mammography Images

Author: R. Ramani, N.Suthanthira Vanitha, S. Valarmathy
Journal: International Journal of Image, Graphics and Signal Processing(IJIGSP) @ijigsp
Article in issue: 5 vol.5, 2013.
Free access
Presently breast cancer detection is a very important role for worldwide women to save the life. Doctors and radio logistic can miss the abnormality due to inexperience in the field of cancer detection. The pre-processing is the most important step in the mammogram analysis due to poor captured mammogram image quality. Pre-processing is very important to correct and adjust the mammogram image for further study and processing. There are Different types of filtering techniques are available for pre-processing. This filters used to improve image quality, remove the noise, preserves the edges within an image, enhance and smoothen the image. In this paper, we have performed various filters namely, average filter, adaptive median filter, average or mean filter, and wiener filter.
Mammogram, Pre-processing, Median filter, Adaptive median filter, Mean filters and wiener filter
Short address: https://sciup.org/15012708
IDR: 15012708
Text of the scientific article The Pre-Processing Techniques for Breast Cancer Detection in Mammography Images
-
I. INTRODUCTION
Presently breast cancer is a leading cause of death among women and second main cause of death after lung cancer [1-7]. Breast cancer is the one of the important factors of mortality in women over the world. In 2010, 2, 10,203 women’s in the United States diagnosed with breast cancer, and 40,589 women’s in the United States died from breast cancer. In 2011, 2, 30,480 cases of non-invasive cancer and 56,650 cases of invasive cancer have been diagnosed in the year 2011. Occurrence and death counts cover approximately 100% of the U.S. population. In the year of 2012, about 2, 27,000 women’s in the United States may diagnose with
breast cancer [6]. According to the international agency for research on cancer, around 79,000 women’s per year affected by breast cancer in India [4]. The National Cancer Institute estimates that one of the eight women in the United States breast cancer will develop at some point during her lifetime [9]. The mortality rates of 30% in the U.S. and 45% in Europe have been demonstrated by the repeated, randomized, and controlled trials [10]. Mammography is one of the effective tools in early detection of breast cancer [8]. Mammography is a low dose x-ray procedure for the visualization of internal structure of breast. Mammography has been proven the most reliable method and it is the key screening tool for the early detection of breast cancer. Mammography is highly accurate, but like most medical tests, it is not perfect. On average, mammography will detect about 80–90% of the breast cancers in women without symptoms.
The common characteristics of the medical images like as unknown noise, poor image contrast, in homogeneity, weak boundaries and unrelated parts will affect the content of the medical images. This problem rectified by pre-processing techniques. The preprocessing are fundamental steps in the medical image processing to produce better image quality for segmentation and feature extractions. The preprocessing steps deal with image enhancement, noise and special mark removal. The image segmentation stages several method existed for automatic and semiautomatic medical image segmentation.
The noise, poor image contrast, in homogeneity, weak boundaries and special mark existing in the medical image segmentation process extremely difficult to remove the noise and special markings that exist in medical images [11],[12].
In [13], the preprocessing method including cutting out background area and normalization for CT brain images. In the proposed approach, an elliptical structure constructed based on skull contour and then the inclineimaging angles corrected.
In [14], the proposed method of the histogram of the intensity in CT images down sampled. Therefore, the low contrast and blurring regions in CT images enhanced. A Markov Random Field model, which is consider the geometrical constraints of the processed image used to develop the accuracy resulting from the down-sampling procedure.
In [15], Median filtering open morphological operation and contrast enhancement used to reduce noise and image enhancement. The contrast of each region calculated with respect to its individual background [16]. Background noise removing while preserving the edge information of suspicious areas can enhance a digital mammogram. This approach investigated in [17], who used four selective averaging schemes and a modification of median filtering called selective median filtering. The Pre-processing technique used in medical images to remove special markings and unwanted noises.
-
II. PREPROCESSING
The main goal of the pre-processing is to improve the image quality to make it ready to further processing by removing or reducing the unrelated and surplus parts in the background of the mammogram images Mammograms are medical images that complicated to interpret. Hence pre-processing is essential to improve the quality. It will prepare the mammogram for the next two-process segmentation and feature extraction. The noise and high frequency components removed by filters.
-
A. Mean filter or average filter
The goal of the mean filters used to improve the image quality for human viewers. In this, filter replaced each pixel with the average value of the intensities in the neighborhood. It locally reduced the variance, and easy to carry out [18]. Limitations of average filter I) Averaging operations lead to the blurring of an image, blurring affect features localization. II) If the averaging operations applied to an image corrupted by impulse noise, the impulse noise attenuated and diffused but not removed. III) A single pixel with a very unrepresentative value affected the mean value of all the pixels in neighborhood significantly.
-
B. Median filtering
A median filter is a nonlinear filter is efficient in removing salt and pepper noise median tends to keep the sharpness of image edges while removing noise. The several of median filter is I) Centre-weighted median filter II) weighted median filter III) Max-median filter, the effect of the size of the window increases in median filtering noise removed effectively.
-
C. Adaptive median filter
Adaptive median filter works on a rectangular region Sxy. It changes the size of Sxy during the filtering operation depending on certain conditions as listed below. Each output pixel contains the median value in the 3-by-3 neighborhood around the corresponding pixel in the input images. Zeros however, replace the edges of the images [19]. The output of the filter is a single value, which replaces the current pixel value at (x, y), the point on which S is centered at the time. The following notation is used:
Zmin = minimum pixel value in Sxy
Zmax = maximum pixel value in Sxy
Zmed = median pixel value in Sxy
Zxy= pixel value at coordinates (x, y)
Smax = maximum allowed size of Sxy
Adaptive Median filtering used to smooth the non-repulsive noise from two-dimensional signals without blurring edges and preserved images. This makes, it particularly suitable for enhancing mammogram images. The preprocessing techniques used in mammogram, orientation, label, artifact removal, enhancement and segmentations. The preprocessing involved in creating masks for pixels with highest intensity, to reduce resolutions and to segment the breast [20].
-
D. Wiener filter
The wiener filter tries to build an optimal estimate of the original image by enforcing a minimum mean square error constraint between estimate and original image. The wiener filter is an optimum filter. The objective of a wiener filter is to minimize the mean square error. A wiener filter has the capability of handling both the degradation function as well as noise. From the degradation model, the error between the input signal f(m, n) and the estimated signal f(m, n) is given by
E (M, N) = F (M, N) - F (M, N)(1)
The square error is given by
[F (M, N) - F (M, N)]2(2)
The mean square error is given by
E {[F (M, N)-F(M, N)] 2 }(3)
-
III. PARAMETER EVALUATION
The objective measures of picture quality that are based on computable distortion measures like mean square error, peak signal to noise ratio, average distance, maximum difference, normalized correlation, mean absolute error, normalized error, structural correlation are considered for study in this work on the original image f(i, j) and on the decompressed image f(i, j) [21],[22].
-
A. Mean Square Error
The Mean Square Error is most common form of image quality for any images. The simplest of distortion measurement is Mean Square Error (MSE), defined as,
MS = ∑ "1 ∙∑ j=l ( f (i, i )- f ′ ( i, i )) 2 (4)
The original image f (i, j) and the segmented or reconstructed image f’(i,j). The higher of MSE value refers to the lower image quality.
-
B. Peak Signal – to – Noise-Ratio
Bigger SNR and PSNR point out a smaller difference between the original (without noise) and reconstructed or segmented image. This is the most widely used objective image quality/ distortion measure. The most important advantage of this measure is ease of calculation but it does not reflect perceptual quality. The small value of Peak Signal to Noise Ratio (PSNR) means that image is poor quality. PSNR is defined as follow
PSNR =20log10 (RMSE ) db (5)
-
C. Structural content
The large value of Structural Content (SC) means that image is poor quality. SC is defined as follow:
∑1=1 ∑ 7=i x ( i , 7 ) 2
∑ ∑7=i x ( "i , "j )2
-
D. Normalized Absolute Error (NAE)
The Normalized absolute error can be calculated by
Eq. (7).
∑ 1=1 ∑ M [| f_ ( i ,7). f_ ( i ,7)]| NAE = ∑&∑ [| | ,( i , j ) |,
Normalized absolute error is a measure of how far is the reconstructed image from the original image with the value of zero being the perfect fit. Large value of Normalised absolute error indicates poor quality of the image, small value of Normalised absolute error gives good quality image.
IV RESULT AND DISCUSSIONS
The UK research group has generated a MIAS database of digital mammograms. The database contains left and right breast images of 161 patients. Its quantity consists of 322 images, which belongs to three types such as Normal, benign and malignant. The database has been reduced to 200-micron pixel edge, so that all images are 1024 x 1024. There are 208 normal, 63 benign and 51 malignant (abnormal) images. It also includes radiologists ‘truth’ marking on the locations of any abnormalities that may be present. The database is concluding of four different kinds of abnormalities namely: architectural distortions, suspicious lesions, Circumscribed masses and calcifications. The preprocessing step is very important for medical image processing to analysis the breast cancer in mammography images.
In the paper four types of filtering are used for preprocessing, mainly concentrate the means square error (MSE), peak signal to noise ratio (PSNR), Structural (SC) and normalized absolute error (AE). These parameters are calculated and tabulated as shown in the table I, II, III, IV. The Mean Square error value is small for adaptive median filter while compare with other three methods, MSE value for adaptive median filter is 6.7584 (mdb001) as shown in table II. The image quality is good for adaptive median filter. The small value of Peak Signal to Noise Ratio (PSNR) means that image is poor quality. The PSNR for adaptive median filter is 39.8323 (mdb001) shown in table I, which is very high while compare with other filters. Large value of Normalised absolute error indicates poor quality of the image, small value of Normalised absolute error gives good quality image. Normalised absolute error is 0.0809 (mdb001) for wiener filter while compare with other filters. From the above observation the adaptive median filter is better while compare with the other filter. The corresponding parameter tabulated as show in the tableI, II, III, IV.
Median filter
Mdb01
a) b) c) d)
Parameter Evolution Table-I: Median Filter for Mammography Images
|
Filter Name |
Noise |
Image |
MSE |
PSNR |
SC |
NAE |
|
Median Filter |
Salt & pepper |
Mdb001 |
65.8468 |
30.5837 |
0.9905 |
0.0134 |
|
Mdb155 |
63.1807 |
30.1250 |
0.9945 |
0.0127 |
||
|
Mdb322 |
52.2811 |
30.9474 |
0.9963 |
0.0088 |
||
|
Gaussian |
Mdb001 |
14.7559 |
36.4411 |
0.9960 |
0.0703 |
|
|
Mdb155 |
19.9849 |
35.1238 |
0.9977 |
0.0601 |
||
|
Mdb322 |
16.2589 |
36.0199 |
0.9976 |
0.0505 |
||
|
Speckle |
Mdb001 |
29.6909 |
33.4046 |
0.9958 |
0.0606 |
|
|
Mdb155 |
42.9881 |
31.7973 |
0.9970 |
0.0611 |
||
|
Mdb322 |
53.1396 |
30.8766 |
0.9964 |
0.0604 |
Reconstructed salts pepper Image Reconstructed gaussian Noise Image Reconstructed speckle Noise Image
e) f) g)
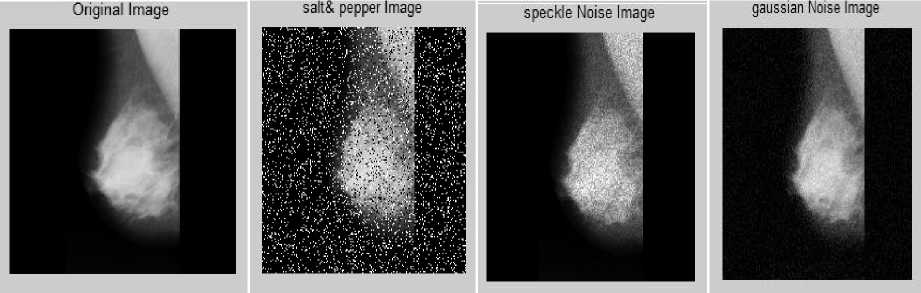
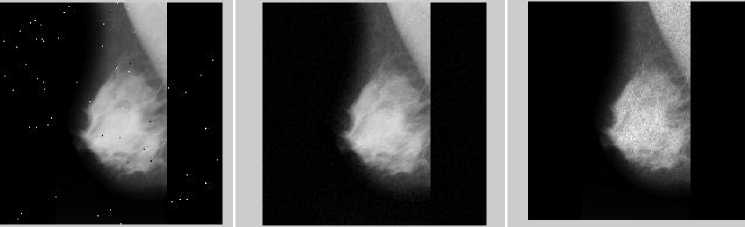
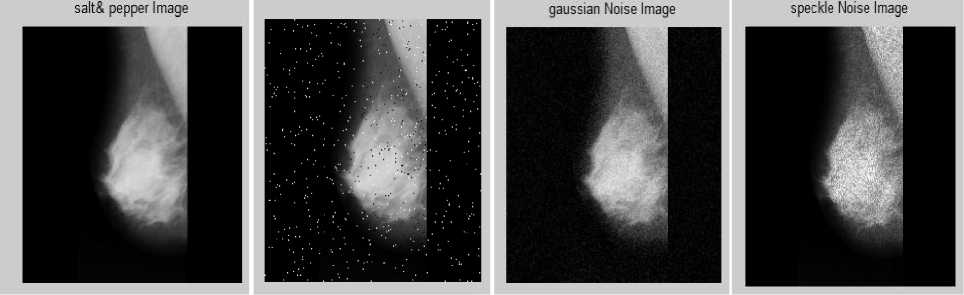
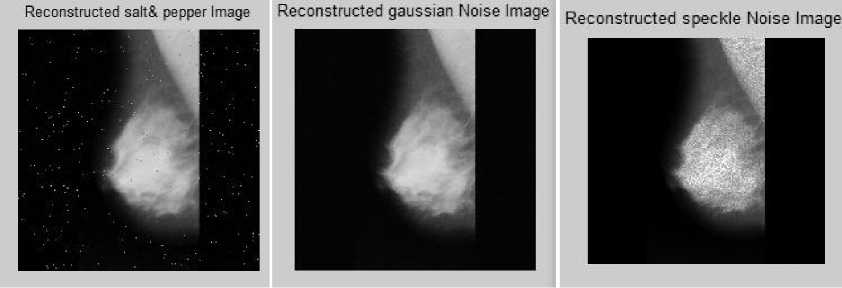
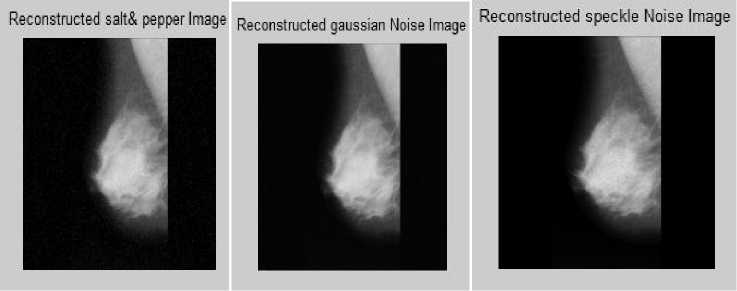
Fig.1 Median Filter for mammogram images and simulation results for mdb001.jpg [(a), (b), (c), (d), (e), (f), and (g)] input images, salt and pepper noise image, Gaussian noise image, speckle noise image, reconstructed salt and pepper image, reconstructed Gaussian image, reconstructed speckle image, respectively.
Adaptive Median Filter Mdb001
a)
b)
c)
d)
e) f) g)
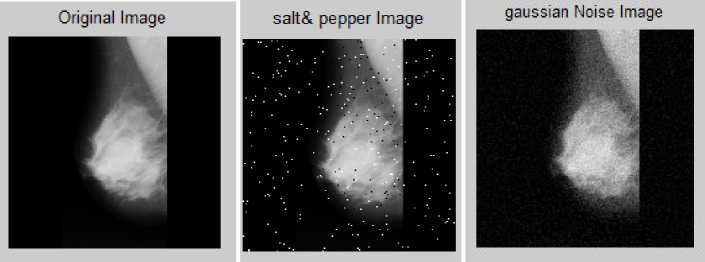
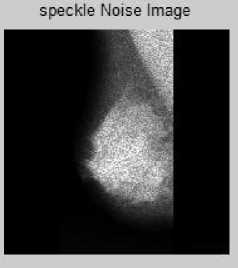
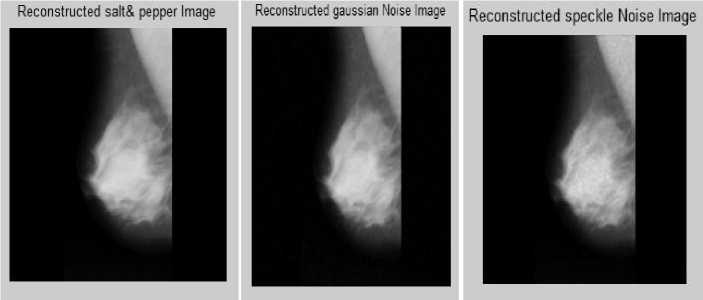
Fig.2. Adaptive Median Filter for mammogram images and simulation results for mdb001.jpg [(a), (b), (c), (d), (e), (f), and (g)] input images, salt and pepper noise image, Gaussian noise image, speckle noise image, reconstructed salt and pepper image, reconstructed Gaussian image, reconstructed speckle image, respectively.
Parameter Evolution Table-II: Adaptive Median Filter for Mammography Images
|
Filter Name |
Noise |
Image |
MSE |
PSNR |
SC |
NAE |
|
Adaptive Median Filter |
Salt & pepper |
Mdb001 |
6.7584 |
39.8323 |
1.0016 |
0.0174 |
|
Mdb155 |
16.4629 |
35.9657 |
1.0026 |
0.0162 |
||
|
Mdb322 |
15.9076 |
36.1147 |
1.0015 |
0.0132 |
||
|
Gaussian |
Mdb001 |
8.4131 |
38.8812 |
0.9995 |
0.0366 |
|
|
Mdb155 |
16.9375 |
35.8423 |
1.0011 |
0.0329 |
||
|
Mdb322 |
13.3343 |
36.8811 |
1.0006 |
0.0261 |
||
|
Speckle |
Mdb001 |
11.2664 |
37.6126 |
1.0068 |
0.0300 |
|
|
Mdb155 |
22.6281 |
34.5843 |
1.0066 |
0.0299 |
||
|
Mdb322 |
16.3338 |
35.9999 |
1.0053 |
0.0269 |
Weiner filter
Mdb001
a)
b)
c)
d)
e) f) g)
Fig.3. Weiner filters for mammogram images and simulation results for mdb001.jpg [(a), (b), (c), (d), (e), (f), and (g)] input images, salt and pepper noise image, Gaussian noise image, speckle noise image, reconstructed salt and pepper image, reconstructed Gaussian image, reconstructed speckle image, respectively.
Parameter Evolution Table-III: Weiner Filter for Mammography Images
|
Filter Name |
Noise |
Image |
MSE |
PSNR |
SC |
NAE |
|
Weiner Filter |
Salt & pepper |
Mdb001 |
70.4403 |
29.6526 |
0.9974 |
0.0809 |
|
Mdb155 |
63.5433 |
30.1001 |
1.0027 |
0.0705 |
||
|
Mdb322 |
59.1744 |
30.4095 |
1.0114 |
0.0517 |
||
|
Gaussian |
Mdb001 |
18.7543 |
35.3998 |
0.9969 |
0.1049 |
|
|
Mdb155 |
19.7755 |
35.1695 |
0.9969 |
0.0971 |
||
|
Mdb322 |
16.5229 |
35.9499 |
1.0006 |
0.0621 |
||
|
Speckle |
Mdb001 |
54.3876 |
30.7758 |
0.9917 |
0.0794 |
|
|
Mdb155 |
54.7316 |
30.7484 |
0.9999 |
0.0736 |
||
|
Mdb322 |
64.8562 |
30.0113 |
1.0022 |
0.0672 |
Mean filter mdb001
a) b) c) d)
e) f) g)
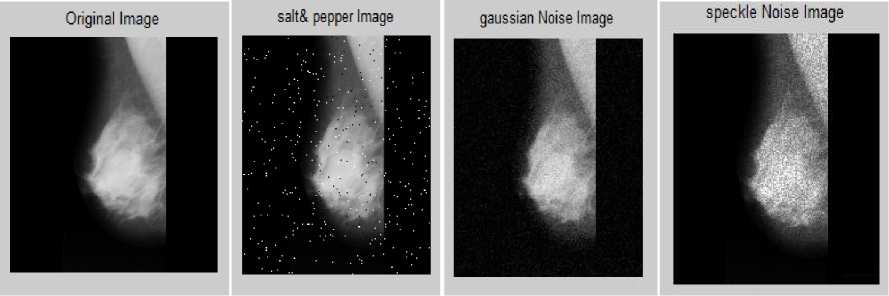
Fig.4. Mean Filter for mammogram images and simulation results for mdb001.jpg [(a), (b), (c), (d), (e), (f), and (g)] input images, salt and pepper noise image, Gaussian noise image, speckle noise image, reconstructed salt and pepper image, reconstructed Gaussian image, reconstructed speckle image, respectively.
Parameter Evolution Table-IV: Mean Filter for Mammography Images
|
Filter Name |
Noise |
Image |
MSE |
PSNR |
SC |
NAE |
|
Mean Filter |
Salt & pepper |
Mdb001 |
30.8829 |
33.2336 |
1.0055 |
0.0784 |
|
Mdb155 |
41.0400 |
31.9987 |
1.0118 |
0.0706 |
||
|
Mdb322 |
38.3390 |
32.2944 |
1.0149 |
0.0530 |
||
|
Gaussian |
Mdb001 |
24.7854 |
34.1888 |
0.9995 |
0.1031 |
|
|
Mdb155 |
36.4494 |
32.5136 |
1.0023 |
0.0981 |
||
|
Mdb322 |
31.3787 |
33.1645 |
1.0024 |
0.0634 |
||
|
Speckle |
Mdb001 |
12.9778 |
36.9988 |
1.0056 |
0.0285 |
|
|
Mdb155 |
24.7021 |
34.2035 |
1.0080 |
0.0300 |
||
|
Mdb322 |
23.8321 |
34.3592 |
1.0104 |
0.0269 |
V. CONCLUSION
Pre-processing stage is an application dependent technique for enhancing the content of medical image based on removal of special markings and speckle noise. Removal of special markings and speckle noise existing in medical images will increase the quality of image segmentation. On the other hand, it will improve the accuracy and efficiency of content based medical image classification and retrieval systems. In this paper, we have considered four types of filtering techniques for pre-processing of mammography images. We have compared the simulated output parameters such as image quality, mean square error, Peak signal to noise ratio, structural content and normalized absolute error. The comparison of four types of filters are tested for 322 mammogram images(MIAS), from the output observation, we concluded the adaptive median filter is more appropriate method while compared with other filters, because image quality of adaptive median filter is better than other. In our future research, further we would also like to improve image quality in adaptive median filter to detect the breast cancer.
References The Pre-Processing Techniques for Breast Cancer Detection in Mammography Images
- T.C.Wang, N.B. Karayiannis, "Detection of microcalcifications in digital mammograms using wavelets, Medical Imaging," IEEE Transactions, 17, 498 -509, 1998.
- R.Mata, E.Nava,F. Sendra, "Microcalcifications detection using multi resolution methods, pattern Recognition,"2000,proceeings,15th International Conference.4,344-347,2000.
- X.P.Zhang, "Multiscale tumor detection and segmentation in mammograms," in Proc. IEEE Int. Symp. Biomed. Imag., pp. 213–216, Jul. 2002.
- G.Bharatha Sreeja, Dr. P. Rathika, Dr. D. Devaraj'' Detection of Tumours in Digital Mammograms Using Wavelet Based Adaptive Windowing Method''international journal modern education and computer science 2012,3,57-65
- S.Saheb Basha, Dr.K.Satya Prasad'' automatic detection of breast cancer mass in Mammograms using morphological operators And fuzzy c –means clustering'' journal of theoretical and applied information technology
- http://www.cancer.gov/ ,The American College of Radiology (ACR),http://www.acr.org/.
- C. C. Boring, T. S. Squires, T. Tong and M. Montgomery, "Cancer Statistics 1994", CA-Cancer J. Clinicians, 44, pp.7-26, 1994.
- H. D. Cheng and Muyi Cu, "Mass Lesion Detection with a Fuzzy Neural Network", J. Pattern Recognition, 37, pp.1189-1200, 2004.
- L..M. Wun, R. M. Merrill, and E. J. Feuer, "Estimating lifetime and age-conditional probabilities of developing cancer," Lifetime Data Anal.,vol. 4, pp. 169–186, 1998.
- D. B. Kopans, "The 2009 U.S. preventive services task force guidelines ignore important scientific evidence and should be revised or withdrawn," Radiology, vol. 256, pp. 15–20, 2010.
- Muller H, Michoux N, Bandon D, Geissbuhler A. A Review of Content-based Medical Image Retrieval Systems in Medical Application - Clinical Benefits and Future Directions. International Journal of Medical Informatics, 2004, 73(1):1-23.
- Smeulders A, Worring M, Santini S, Gupta A, Jain R. Content-Based Image Retrieval at the End of the Early Years. IEEE Transaction on Pattern Analysis and Machine Intelligence, 2000, 22(12):1380-1394.
- Peng F, Yuan K, Feng S, Chen W. Pre-processing of CT Brain Images for Content-Based Image Retrieval. In: Proceedings of International Conference on BioMedical Engineering and Informatics, 2008, 208-212.
- Cervinka T, Provazník I. Pre-processing for Segmentation of Computer Tomography Images. In: Proceedings of RADIOELEKTRONIKA,2005, 167-170.
- Hussein ZR, Rahmat RW, Nurliyana L, Saripan MI, Dimon MZ. Pre-processing Importance for Extracting Contours from Noisy Echocardiographic Images. International Journal of Computer Science and Network Security (IJCSNS),2009, 9 (3): 134-137.
- W.Morrow, R.Paranjape, R.Rangayyan, and J.Desautels, 1992. "Regionbased contrastenhancement of mammograms", IEEE Trans. Med. Imag., vol. 11, pp. 392–406.
- S.Lai, X.Li W.Bischof, 1989. "On techniques for detecting circumscribed masses in mammograms", IEEE Trans. Med. Imag., vol. 8, pp. 377-386.
- Junn shan wen ju,yanhui, guoa, ling zhang, h.d.cheng. automated breast cancer detection and classification using ultrasound images-a survey. Pattern recognition 43,(2010) 299-317
- Jwad Nagi Automated Breast Profile Segmentation for ROI Detection Using Digital Mammograms,IEEE EMBS Conference on Biomedical Engineering & Sciences (IECBES 2010), Kuala Lumpur
- Maciej A. Mazurowski , Joseph Y. Lo, Brian P. Harrawood, Georgia D. Tourassi, Mutual information-based template matching scheme for detection of breast masses: From mammography to digital breast tomosynthesis, Journal of Biomedical Informatics (2011).
- Ratchakit Sakuldee and Somkait Udomhunsakul (2007) 'Objective Performance of Compressed Image Quality Assessments', PWASET, Vol. 26, pp. 434-443.
- Sumathi poobal, g.ravindran,"the performance of fractal image compression on different imaging modalities using objective quality measures," International Journal of Engineering Science and Technology (IJEST) ISSN : 0975-5462 Vol. 3 No. 1 Jan 2011.
