The rationale for comparative effectiveness of tourist potential realization (case study of the Volga region)
")
Author: Polukhina Anna Nikolaevna, Sheresheva Marina Yurevna, Rukomoinikova Vera Pavlovna, Napolskikh Dmitrii Leonidovich
Journal: Economic and Social Changes: Facts, Trends, Forecast @volnc-esc-en
Section: Regional economy
Article in issue: 5 (47) т.9, 2016.
Free access
The article presents the analysis of long-term tourism development programs of the Volga Region. Great attention is given to the sector's financing measures set out in development programs. Domestic and foreign tourist potential assessment methods are analyzed. Tourist potential dynamics of the Volga Region is studied based on expert opinion. Using econometric approach the authors study the correlation between tourism investments and incomes of the Volga Region for the past six years - from 2009 to 2014. The analysis was carried out using statistics provided by the Russian Tourism Association and the Federal State Statistics Service of the Russian Federation by category of profitability from paid tourist services and from hospitality and catering services. The conducted analysis helped construct the figures showing the differentiation of the Volga regions by tourism investment efficiency and tourist potential realization. It is shown that tourist potential of the territories and its realization are highly differentiated...
Tourist potential, long-term tourism development program, tourism infrastructure, efficiency of investments, efficiency indicators
Short address: https://sciup.org/147223867
IDR: 147223867 | UDC: 332.14 | DOI: 10.15838/esc.2016.5.47.7
Text of the scientific article The rationale for comparative effectiveness of tourist potential realization (case study of the Volga region)
Introduction. The current situation in the Russian economy influenced by international events of 2014–2015 has raised the urgent issue of import substitution. At first sight, this important strategy of the Russian economy does not include tourism and recreation. The authors, however, believe that this is a false statement. Tourism theoreticians and practitioners have for a long time spoken about the need to develop domestic, inbound and regional tourism, but any initiative in this sphere conflicted with the real state of affairs in the market of tourist services. Outbound tourism, especially recreational, to countries such as Turkey and Egypt, has been the leading direction of Russian tourism for the past 10–15 years. But the events of 2015 have dramatically changed the situation: according to the experts, the main trend of the last year was the shift towards domestic tourism1. In these circumstances, the development of domestic tourism in Russia is the greatest challenge which in the short term will necessitate the revision of the existing programs of tourism development in the Russian regions and raise the issue of adequate assessment of their tourist resources.
Research methodology. The tourist potential of any territory is composed of natural and man-made objects and phenomena, as well as the conditions, opportunities and resources necessary and suitable for the formation of a tourism product. Therefore, scientific concepts put forward as a framework for assessing tourist potential, offer a comprehensive consideration of a number of factors. These include natural and climate resources (climate; landscape; water and mineral resources; flora; fauna; separate natural monuments, etc.), historical and cultural resources (tangible and intangible cultural heritage of the region) and socioeconomic resources (infrastructure of the tourist sector; management, personnel and education, material, financial and information resources and conditions) [5]. Accordingly, the problem of developing uniform methodology for assessing tourist potential of the territory attracts the attention of specialists in different knowledge domains: geography, architecture, tourism, etc. [4]. The well-known methods of assessing tourist-recreational potential of territories developed by A.Y. Alexandrova [1], A.V. Drozdov [2], B.V. Robinson [8], models of comprehensive assessment of tourist resources offered by E.O. Ushakov [11], I.A. Selivanov [10], an integrated assessment model of M.A. Sarancha [9] are of particular interest. The author’s method of assessing tourist potential based on the index method [7] may also be noted: based on calculations in the Vologda Oblast V.S. Orlova and E.G. Leonidova identify groups of territories (municipalities) by level of their tourist potential. This methodology helps identify the problems constraining the development and realization of tourist potential.
When considering the processes of tourist potential implementation in the Russian regions from the point of view of system approach, the authors determined that the adaptation of regional economic systems to the new format of tourist service provision in connection with foreign economic instability will require dynamic creation of new adaptive mechanisms. The mechanism of adaptation to a new type of tourist business development amid the import substitution policy, which is based on the implementation of investments as a long-term capital outlay is considered by the authors as a set of consistently implemented changes with a strategic focus on achieving a balance between economic interests of the business community and the state’s social responsibility [21]. A combination of infrastructural, institutional, organizational and educational factors the driver which generates the processes of adaptation of a regional economic system to the new conditions of tourism activities. A set of investment, financial, external-economic, social and cultural factors is an “adaptalizator” which increases the adaptive capacity of the Russian tourist business. Managerial and entrepreneurial factors underlie the effective adaptation technologies, while the informal “shadow” mechanisms constitute a “blockade units” which hamper constructive adaptation.
When studying tourist potential realization, the researchers mainly focus on economic assessment methods: increasing cash receipts from tourism, raising employment rates, increasing income of the local population and other economic consequences. Marketing factors are also used for assessing tourist potential: raising the awareness concerning the destination [16], the increasing number of positive tourist responses [15], the degree of the destination’s attractiveness [18], and the number of images of brands in the minds of potential tourists [20]. Some foreign studies [17; 22] focus their attention on the fact that the assessment of tourist potential of the regions, the basis of attraction of which is the beauty of the landscapes must include the assessment of attributes of a natural resource and environmental requirements for soil conservation, protection of forests and wildlife. In particular, the New Zealand method of assessment of recreational and tourist resources [17] implies complex analysis of landscape attractiveness and related tourist activities. This is done with the use of the natural resource delimitation method based on the definition of vegetation borders using aerial photography and field examinations. When defining the quality of landscape views, the authors applied a subjective index with high, medium or low resource quality options. The study uses a scale of five points which reflect the overall suitability of a specific resource for recreation- and tourism-based activities, as well as its importance in terms of recreational and tourist potential at the national level.
J. Priskin [22] proposed a method for assessing the potential of coastal Australian regions based on comprehensive analysis of four assessment units: attractiveness of the region’s natural resources, availability, supporting infrastructure, the degree of environment deterioration. Such an approach provides decision makers and people developing and implementing regional programs with a tool for assessing both positive and negative consequences of tourist potential development. It is important to understand that the balance of potential benefits and costs is the basis for success of regional tourism development programs. In particular, environmental load should be taken into account in those regions which do not place the territory’s natural attractiveness at the forefront. This is because local communities are, according to the modern approach of managing tourist destinations, the key stakeholders [14; 19], therefore, the system of indicators of effectiveness should include indicators such as water and energy2 consumption growth rate, garbage disposal by the tourists of the recreation area, etc.
Analysis of regional and municipal Russian tourism legislation shows that regional tourism development programs contain plan indicators of the implementation of programs such as: the number of copies of published promotional materials about tourist potential; the number of Russian and international specialized exhibitions; the number advertising and information tours held for the Russian and foreign media and tour operators; the number of purchased tourist information terminals; the number of tourists visiting the region; the range of tourist services provided; investments attracted in the framework of state financial support in the form of compensation of interest rates for loans of commercial banks for the development of tourism. However, none of the regional laws clearly outline the assessment methodology. Thus, the problem of tourist potential realization effectiveness assessment remains acute at this level as well.
Research methods. In order to provide a scientific rationale for the possibility of applying the proposed indicators used in the study for assessing the comparative effectiveness of tourist potential implementation, the authors in 2014 conducted a correlation analysis of tourist business development indicators in the Russian regions based on the official statistics of the Federal Agency for Tourism [21]. The correlation analysis was carried out on the basis of Microsoft Excel analytical tools. A Subject of the Russian Federation serves as a basic research unit as it is the lowest-scale administrative-territorial unit by which relatively comprehensive and homogeneous statistics of tourism industry is gathered. Correlation-regression analysis was conducted in all 85 Subjects of the Russian Federation, including the Republic of Crimea and the Federal city of Sevastopol. As the main resultants of tourist potential realization effectiveness, the authors consider the following: “the range of paid tourist services”, “investments in fixed capital aimed at the development of collective accommodation facilities (CAF), the range of paid CAF services”, since these indicators are crucial for the formation of development potential of tourism clusters and for determining the vector of development of the region’s territory in current economic conditions.
Expert evaluations of the territory’s potential in tourism, as well as statistics presented at regional and national levels may serve as the the initial data for the analysis of comparative efficiency of tourist potential. In particular, the Russian rating agency “Expert-RA” is the most recognized rating agency at the national level, which has kept records of regional tourist potential for the past ten years [3]. The regions under study are ranked by annual (monthly) indicators which take into account revenues and costs. The ranking results can be used for constructing various graphs, for example graphs showing the results of ranking of regions according to their tourist potential, as well as graphs describing revenues from paid tourism services and tourist destinations in the regions. At the same time, the x-axis reflects the values characterizing the regional ranking results by investment in tourism. The y-axis reflects the indicators corresponding to target characteristics of the above graphs. Border performance indicators of each graph can be indicators characterizing correspondence between investment ranks and ranks of profitable or potential component of the economic efficiency of tourism in the region. This characteristic can be checked by plotting a line in the graph which divides all the ranking results in two categories; the first, located above the line, is characterized by achieving expected results appropriate to their potential by the objects which fell into this category, and the second category located below the described line does not correspond to the expected indicators. The groups identified according to analysis results can be defined as the leading, average and outsider regions. For each group there are specific ways of improving efficiency.
Research results. Statistical indicators which, according to the authors’ opinion, form the region’s tourist potential have been chosen from the list of tourism development indicators in the subjects of the Russian Federation. Table 1 presents statistical characteristics of the researched sample of statistical indicators of efficiency of formation and realization of tourist potential of the Russian regions.
For the purpose of in-depth study of determinants of tourist potential realization in the Russian regions in the framework of correlation analysis the differentiation between the indicators characterizing the operation of hotels and similar accommodation facilities and the operation of other CAF has been carried out. The permissibility of such separation of collective accommodation facilities into groups is also due to the specific nature of summary indicators by RF subjects formed by the Federal Agency for Tourism. The first block of indicators consists of the following tourism industry performance indicators: “number of hotels and similar accommodations”, “bed capacity in hotels and similar accommodation”, “number of residents in hotels and similar accommodations”.
The second block consists of regional tourism operation parameters such as: “number of CAF”, “bed capacity in CAF”, “number of residents in CAF”. The third block is formed by the indicators of staffing sufficiency of tourist potential realization processes
Table 1. Statistical characteristics of the sample of statistical indicators of efficiency of formation and realization of tourist potential of the Russian regions*
Indicators Average Median Standard deviation Kurtosis Noncentrality Interval Minimum Maximum Number of hotels and similar accommodations 129.01 96 144.47 28.20 4.44 1135 3 1138 Bed capacity in hotels and similar accommodations 9758.16 4874 16748.11 25.13 4.63 118336 182 118518 Number of residents in hotels and similar accommodations, people 396646.11 197732 740218.18 30.16 5.04 5553232 6204 5559436 Number of CAF, units 186.55 129 211.52 29.60 4.53 1680 4 1684 Bed capacity in CAF 18700.91 9681 31523.33 39.63 5.62 257034 219 257253 Number of residents in CAF, people 527233.44 287663 859844.97 19.44 4.14 5610202 8584 5618786 Average CAF staff number 4745.31 2463 7810.46 24.30 4.42 56598 47 56645 Number of staff in tourist agencies 541.94 330 821.19 39.50 5.53 6754 6 6760 Range of paid tourist services, million rubles 1758.16 844 3081.28 25.15 4.53 22184 20 22204.6 Investments in fixed capital for CAF development, million rubles 2103.85 799 5768.63 32.96 5.63 39790 14 39804.5 Range of paid services of hotels and similar accommodations, million people 892.81 19 5834.66 82.46 9.02 53665 0 53664.9 * Compiled from: Russian Tourism: summary statistics by the subjects of the Russian Federation. Available at: http://www.russiatourism. ru/content/8/section/81/detail/4124/ in the RF regions, it consists of the following indicators: “number of staff in tourist agencies”, “range of paid tourist services”. Correlation analysis results are presented in Table 2.
Based on the results presented in the table the following conclusions may be drawn. In general, there is a strong statistical correlation between tourist potential formation and realization indicators of the RF subjects. Low values of the correlation coefficient characterize a weak interdependence between the “investment in fixed capital for CAF development” and indicators characterizing the number of residents in CAF during the reporting period. There is also no correlation dependence between investments in hotel business and the indicators characterizing tourist market: “number of staff in tourist agencies” and “range of paid tourist services”. It should be emphasized that the last two indicators are generally characterized by a weak correlation with the CAF performance indicators against the background of a strong connection with each other (correlation coefficient 0.9).
Table 2. The results of correlation analysis of tourist potential formation and realization indicators in the Russian regions*
|
;О о 03 ^ о 1 | 8 S о, й "° § S С ™ У « 8 £ £ со d 32 ^ -£« Е |
g |
E О E Ё О H 5 d • - О о 2 E * cc |
||||||||||
|
I ” £ Ё |
g |
|||||||||||
|
О 00 С go Е — — Е СС со сл |
g |
о CM CD |
co |
|||||||||
|
оз ч= .52 |
g |
CM co о |
co |
|||||||||
|
О |
CD |
|||||||||||
|
? 42 о Е с |
g |
CD |
CD |
LO CD |
||||||||
|
со |
g |
ю CD |
||||||||||
|
Е о Е |
О |
3 |
CD oq |
ГО CO |
CD |
CO |
||||||
|
Sy£°° ° Е £ - и О £ п сл о Е с с о о |
g |
ОО со |
ОО CD |
с^ |
LO CD |
5 о |
ГО CD |
|||||
|
^42 ^ ° т о о CD СО о Е со о О С |
g |
ОО ОО |
3 |
С^ CD |
CD oq |
CO |
2 |
CM CD |
||||
|
5 "о £ о |
g |
ОО ОО |
с^ ОО |
ГО |
co |
|||||||
|
5 |
то ° и £ о Е о о о , со 1 j |
О ■S с Е ” Е § Й со ■° Ё CD Е СО СЛ |
w S Е сл 00 О Е -о to 'о ^ "о - 32 Е 03 Е С о о |
< Е |
'о Ё оз § О 5 |
g 5 |
'o аз -E 11 |
££ £ и |
VD > -E to § ° CD = = ° Ё |
Ё Ё 00 СЛ O ^ £ -S e ™ = о 32 E оз 03 Q3 |
Thus, the conclusions about a close correlation between tourist potential formation and realization indicators in the Russian regions made during the correlation analysis substantiate the possibility of applying the method of expert estimations to comparative efficiency of tourist potential realization. It has been concluded that comprehensive methods of tourist potential assessment undertaken by the Agency “Expert-RA” does not conflict with correlation analysis results and even complements them. Methodological coherence of the considered approaches allows the use of graphs displaying the results of regions’ tourist potential ranking as well as graphs describing revenues from paid tourist services and tourist destinations in the regions.
The authors demonstrate the possibilities of the method of comparative efficiency of tourist potential realization 3 in the case of the Volga Federal District.
Over the past five years the Volga Federal District has ranked second, behind the Central Federal District by range of paid tourist services [6]. Thus, in 2013, the circulation of tourist services in the Volga Federal District amounted to 25 billion rubles, while the Central Federal District earned 44 billion rubles. High tourism profitability in the Volga Federal District is evidenced by the fact that eight regions of the Volga Federal District were among the top 20 Russian regions by tourism income over a billion rubles a year: the Nizhny Novgorod Oblast, republics of Bashkortostan and Tatarstan, Perm Krai, the Samara, Saratov, Ulyanovsk, Orenburg and Kirov oblasts.
Since 2005 tourist potential has been one of the nine types of private potential in the methodology of the “Expert-RA” Agency on the calculation of the regions’ investment potential. According to “Expert-RA” criteria, tourist potential ( Table 3 ) consists of four parameters: natural and recreational complex, historical and cultural complex, the degree of development of tourist accommodation and entertainment network. The first two parameters are the reasons for tourist visits to the region, the second two – the conditions which ensure that tourists stay in the region and spent the money saved up for this reason. The optimal combination and balanced development of these elements can make a tourist destination attractive for travellers and proportional development of these elements of tourism can.
According to “Expert-RA” rankings, the best regions’ indicators correspond to the lowest rank values. For over nine years of ranking, the number of RF subjects ranged from 88 in 2005 to 83 in 2015. However, the distribution of leading positions has been quite stable. Among the regions of the Volga Federal District the top ranking lines are constantly
Table 3. Tourist potential dynamics in the regions of the Volga Federal District
Region of the Volga Federal District Rank of tourist potential according to the “Expert-RA” assessment 2005 2006 2007 2008 2009 2010 2011 2012 2013 2014 2015 Republic of Tatarstan 7 6 5 6 7 6 5 6 6 5 6 Republic of Bashkortostan 6 7 6 8 6 7 7 7 7 8 8 Nizhny Novgorod Oblast 11 12 17 15 9 10 12 12 11 11 12 Perm Krai 10 9 13 12 12 11 11 11 12 12 14 Samara Oblast 15 21 26 29 23 21 17 16 15 15 16 Saratov Oblast 23 26 31 31 34 25 27 26 26 27 28 Orenburg Oblast 47 47 49 51 40 33 30 31 29 26 31 Kirov Oblast 21 25 28 27 37 34 40 41 41 41 41 Chuvash Republic 52 54 47 48 49 41 46 46 45 48 48 Udmurt Republic 51 49 48 44 51 49 52 47 50 50 52 Penza Oblast 36 38 40 43 62 55 55 54 54 57 58 Republic of Mordovia 62 64 59 60 60 62 60 61 62 62 67 Ulyanovsk Oblast 40 44 53 50 64 54 61 63 66 63 62 Mari El Republic 64 66 67 69 68 71 70 70 71 72 73 Compiled from: Expert-RA: rankings of the Russian regions. Available at: taken by the republics of Tatarstan and Bashkortostan, the Nizhny Novgorod and Samara oblasts and Perm Krai. The second group with medium tourist potential includes the Saratov, Orenburg and Kirov oblasts and the Chuvash Republic. The third group with low tourist potential consists of the Udmurt Republic, the Penza and Ulyanovsk oblasts, the republics of Mordovia and Mari El.
More attention should be given to financing the tourism industry laid down in the tourism development programs in the regions of the Volga Federal District. Funds laid down in tourism development programs, as well as annual tourism investment averages are presented in Table 4 . The amount of financing activities is laid down in the programs of the regions under study within the means from republican and federal budgets.
Timely access to statistical data in the tourism sector was until recently a serious problem for experts. The official website of the Federal Agency for Tourism currently posts accumulated data for the past five years by category: tourist reception and accommodation, range of paid tourist services. As shown in Table 5 , the Nizhny Novgorod and Samara oblasts, the republics of Bashkortostan and Tatarstan, Perm Krai are the leading in the Volga Federal District by range of paid tourist services.
Analysis of tourist service profitability dynamics over the last five years shows that the crisis of 2010–2011 was successful only for Perm Krai and the Republic of Tatarstan, while in other regions of the Volga Federal District tourism development rates declined. In 2012, profitability rates significantly rose in the Udmurt Republic
Table 4. Financial investment in tourism in the regions of the Volga Federal District
|
Region of the Volga Federal District |
Investment in tourism, million rubles |
|
|
Annual average |
Total |
|
|
Republic of Tatarstan |
5739 |
22956 |
|
Chuvash Republic |
902 |
7216 |
|
Perm Krai |
518 |
2591 |
|
Nizhny Novgorod Oblast |
421 |
2103 |
|
Republic of Bashkortostan |
397 |
1987 |
|
Penza Oblast |
220 |
1539 |
|
Samara Oblast |
210 |
1262 |
|
Ulyanovsk Oblast |
178 |
891 |
|
Republic of Mordovia |
152 |
764 |
|
Mari El Republic |
36 |
215 |
|
Kirov Oblast |
17 |
133 |
|
Orenburg Oblast |
11 |
68 |
|
Udmurt Republic |
10 |
70 |
|
Saratov Oblast |
10 |
34 |
|
Compiled from: strategic programs of tourism development in the regions of the Volga Federal District. |
||
Table 5. Range of paid tourist services in the regions of the Volga Federal District, million rubles
|
Region of the Volga Federal District |
2009 |
2010 |
2011 |
2012 |
2013 |
2014 |
|
Nizhny Novgorod Oblast |
2120 |
2620 |
2731 |
3866 |
5634 |
7243.8 |
|
Republic of Bashkortostan |
2351 |
2395 |
2572 |
2742 |
3366 |
3870.5 |
|
Perm Krai |
1411 |
1596 |
2229 |
2834 |
3335 |
3027.3 |
|
Republic of Tatarstan |
1137 |
1239 |
1509 |
1932 |
2313 |
2477.5 |
|
Samara Oblast |
1119 |
1322 |
1447 |
1624 |
1832 |
1608.7 |
|
Saratov Oblast |
970 |
1145 |
1474 |
1408 |
1453 |
1244.8 |
|
Ulyanovsk Oblast |
376 |
630 |
700 |
996 |
1305 |
1173.7 |
|
Orenburg Oblast |
625 |
661 |
963 |
1092 |
1191 |
1287.3 |
|
Kirov Oblast |
496 |
730 |
811 |
874 |
1052 |
1027.6 |
|
Penza Oblast |
409 |
460 |
446 |
590 |
719 |
836.7 |
|
Mari El Republic |
261 |
315 |
431 |
573 |
700 |
685.4 |
|
Chuvash Republic |
391 |
470 |
542 |
596 |
691 |
701.8 |
|
Udmurt Republic |
152 |
240 |
257 |
458 |
684 |
681.6 |
|
Republic of Mordovia |
229 |
297 |
369 |
382 |
542 |
522.6 |
Compiled from: Russian tourism: summary statistics for 6 years (from 2009 to 2014) for the subjects of the Russian Federation. Available at:
(by 78%), in the Nizhny Novgorod and Ulyanovsk oblasts and the Republic of Mordovia (by 42%), in the Penza oblast and the Mari El Republic of (by 33%), in Perm Krai and the Republic of Tatarstan (by 28%). In 2013–2014, good progress rates were preserved in the Udmurt Republic, the Nizhny Novgorod Oblast and in the Republic of Bashkortostan. The Republic of Tatarstan, the Orenburg and Penza oblasts also demonstrated a positive dynamics, yet insignificant.
Another tourism income item is the sector of hotel and catering services. According to the Federal State Statistics Service [12], the five leading regions of the Volga Federal District are as follows: the republics of Bashkortostan and Tatarstan, the Nizhny Novgorod and Samara oblasts, Perm Krai ( Table 6 ).
In order to determine tourism investment efficiency in the regions of the Volga Federal District, the indicators of investment and income in tourism for the past five years should be correlated ( Table 7 ). On the basis of tourism investment indicators in the regions of the Volga Federal District presented in Table 4, the rank of investment activity of the region (investment rank) is defined. Income rank is determined on the basis of summary statistics for the range of paid tourist services (see Table 5) and turnover on income from hotels and restaurants (see Table 6).
On the basis of the analysed correlation between the indicators of income and investment in tourism, a figure has been plotted, demonstrating the differentiation of regions by tourism investment efficiency ( Fig. 1 ). The numbers on the figure denote
Table 6. Turnover on income from hotels and restaurants in the Volga Federal District, billion rubles
|
Region of the Volga Federal District |
2009 |
2010 |
2011 |
2012 |
2013 |
2014 |
|
Republic of Bashkortostan |
7.7 |
12.3 |
12.2 |
26 |
37 |
30.3 |
|
Republic of Tatarstan |
10.2 |
16.8 |
18.8 |
19.7 |
22.8 |
22.4 |
|
Perm Krai |
7.7 |
5.8 |
6.5 |
6.8 |
25.8 |
21.7 |
|
Nizhny Novgorod Oblast |
5.9 |
8.7 |
12.4 |
14.5 |
17.4 |
20 |
|
Samara Oblast |
7.3 |
11.2 |
14 |
11.9 |
12.8 |
13.7 |
|
Udmurt Republic |
2.9 |
3.7 |
4.9 |
6.8 |
6.7 |
7.4 |
|
Kirov Oblast |
3.5 |
3.6 |
3.8 |
5.2 |
5.8 |
6.4 |
|
Chuvash Republic |
2.5 |
3.1 |
3 |
4.1 |
5.7 |
5.9 |
|
Saratov Oblast |
2.9 |
3.3 |
3.8 |
4.5 |
4.6 |
4.9 |
|
Orenburg Oblast |
3.1 |
3.1 |
3.2 |
4.5 |
4.9 |
4.9 |
|
Ulyanovsk Oblast |
1.4 |
2.1 |
3 |
2.6 |
3.2 |
3.2 |
|
Penza Oblast |
2.2 |
2.4 |
3.3 |
3 |
3 |
3.1 |
|
Mari El Republic |
1.5 |
1.7 |
2.1 |
2.3 |
2.5 |
2.8 |
|
Republic of Mordovia |
0.7 |
0.9 |
0.8 |
1.2 |
1.3 |
2.7 |
Compiled from: Turnover on income from hotels and restaurants in the Volga Federal District. Federal State Statistics Service.
Table 7. Tourism investment efficiency the regions of the Volga Federal District*
|
Region of the Volga Federal District |
Investment rank |
Income rank |
|
Republic of Bashkortostan |
10 |
14 |
|
Republic of Tatarstan |
14 |
13 |
|
Nizhny Novgorod Oblast |
11 |
12 |
|
Perm Krai |
12 |
11 |
|
Samara Oblast |
8 |
10 |
|
Udmurt Republic |
2 |
9 |
|
Kirov Oblast |
4 |
8 |
|
Chuvash Republic |
13 |
7 |
|
Orenburg Oblast |
3 |
6 |
|
Saratov Oblast |
1 |
5 |
|
Ulyanovsk Oblast |
7 |
4 |
|
Penza Oblast |
9 |
3 |
|
Mari El Republic |
5 |
2 |
|
Republic of Mordovia |
6 |
1 |
|
* were used for ranking summary statistics for 6 years (from 2009 to 2014) presented in tables 4–6. |
||
Figure 1. Efficiency of investment in tourism in the regions of the Volga region
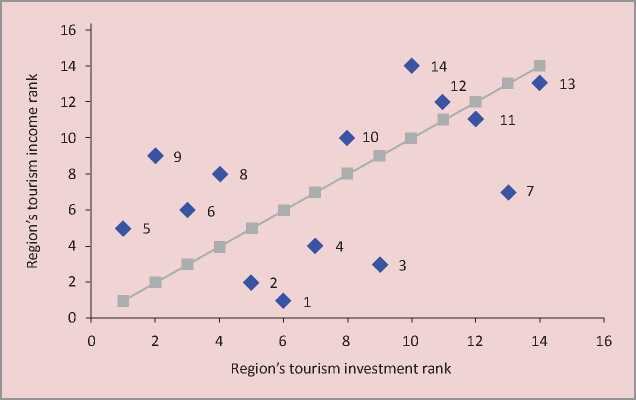
the regions of the Volga Federal District by tourism income rank: 1 – Republic of Mordovia; 2 – Mari El Republic; 3 – Penza Oblast; 4 – Ulyanovsk Oblast; 5 – Saratov Oblast; 6 – Orenburg Oblast;
-
7 – Chuvash Republic; 8 – Kirov Oblast;
-
9 – Udmurt Republic; 10 – Samara Oblast;
11 – Perm Krai; 12 – Nizhny Novgorod Oblast; 13 – Republic of Tatarstan; 14 – Republic of Bashkortostan.
Among the subjects of the Volga region located in the zone above the diagonal line, which generally demonstrated investment efficiency over the past five years, the Republic of Bashkortostan is worth noting, which became the leader by income, while it is on the 5th place in top five by tourism investment. It is noteworthy that the Republic of Tatarstan leads by a large margin from other regions of the Volga Federal District by tourism investment; however, even such a major event like the Universiade–2013 did not allow the region to be rated first by income rank in the District. There is a one-spot difference between tourism investment and income of the Republic of Tatarstan; the coordinates of this Republic are below the diagonal line together with the regions of the Volga Federal District considered as actors which have not fully lived up to their investment activity so far.
Apparently, for a more accurate assessment in this case a longer period of time is required. In the Chuvash Republic, the Penza Oblast and the Republic of Mordovia, the level of investment activity is much higher than the income level. Income rank is six spots behind investment rank in the Chuvash Republic and the Penza Oblast, five spots – in the Republic of Mordovia. The Ulyanovsk Oblast and the Mari El Republic are in the same group, the difference between income rank and investment rank is three spots.
After assessing tourist potential dynamics, the region’s financial activity in tourism and income dynamics, tourist potential realization efficiency in the regions of the Volga Federal District should be studied. Data on tourism income and expense presented above, as well as the information on tourist potential are summarized in Table 8 .
Table 8. Tourist potential realization efficiency in the regions of the Volga Federal District*
|
Region of the Volga Federal District |
Region’s tourism investment rank |
Region’s tourist potential rank |
|
Republic of Tatarstan |
14 |
14 |
|
Chuvash Republic |
13 |
6 |
|
Perm Krai |
12 |
11 |
|
Nizhny Novgorod Oblast |
11 |
12 |
|
Republic of Bashkortostan |
10 |
13 |
|
Penza Oblast |
9 |
4 |
|
Samara Oblast |
8 |
10 |
|
Ulyanovsk Oblast |
7 |
2 |
|
Republic of Mordovia |
6 |
3 |
|
Mari El Republic |
5 |
1 |
|
Kirov Oblast |
4 |
7 |
|
Orenburg Oblast |
3 |
8 |
|
Udmurt Republic |
2 |
5 |
|
Saratov Oblast |
1 |
9 |
|
* Indicators presented in tables 3–4 were used for ranking. |
||
The figure presented below ( Fig. 2 ) ranks the regions of the Volga Federal District on the basis of the ratio of region’s tourism investment and region’s tourist potential rank. The numbers on the figure denote the regions of the Volga Federal District by tourist potential rank: 1 – Mari El Republic; 2 – Ulyanovsk Oblast; 3 – Republic of Mordovia; 4 – Penza Oblast; 5 – Udmurt Republic; 6 – Chuvash Republic; 7 – Kirov Oblast; 8 – Orenburg Oblast; 9 – Saratov Oblast; 10 – Samara Oblast; 11 – Perm Krai; 12 – Nizhny Novgorod Oblast; 13 –Republic of Bashkortostan; 14 – Republic of Tatarstan.
The Republic of Tatarstan is located on the diagonal line, leading by both indicators in the district, which indicates good conditions prevailing in the region for investors and entrepreneurs, as well as great prospects for tourism development.
The regions coordinates of which are below the diagonal line (where the ranks correlate) can be considered as actors which do not fully use its tourist potential. The farthest from the diagonal line are Chuvash Republic, Penza and Ulyanovsk oblasts. The level of tourism financing in the Chuvash Republic is currently much higher than the income level. Here, tourism is relied upon as an innovative way of the Republic’s development, since it does not possess any other significant natural resource potential. Tourist potential of the Penza and Ulyanovsk oblasts is rated by experts much lower than that of the Chuvash Republic; however, by tourism investment rank these regions are in the middle of the ranking scale among the regions of the Volga Federal District. Here, the level of investment activity is significantly higher than the level of tourist
Figure 2. Tourist potential realization efficiency in the regions of the Volga Federal District
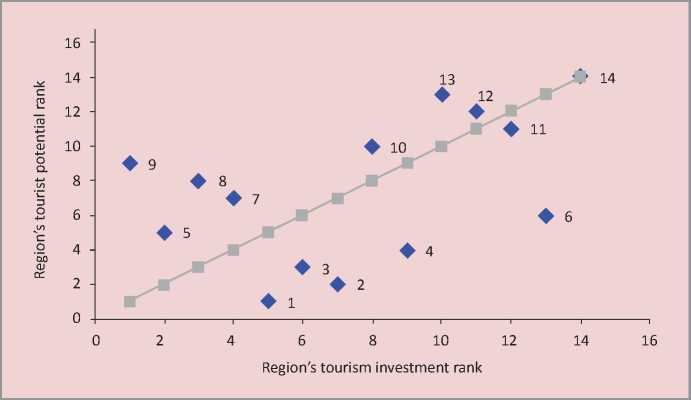
potential. It appears that the tourism of the Penza and Ulyanovsk oblasts, where the emphasis is put on historical, cultural and event tourism, is provided with good conditions for attracting investors and entrepreneurs.
Republics of Mari El and Mordovia, with low indicators of investment activity and tourist potential, are characterized by the difference between investment and tourist potential ranks in four and three spots respectively. Lack of a number of significant parameters of tourist attractiveness requires the authorities of these regions to make additional efforts in planning and conducting measures to improve the conditions for investors and entrepreneurs prevailing in the region.
Perm Krai, highly ranked in the Volga Federal District ranking by tourism investment and having high tourist potential, is located slightly below the diagonal line. There is a one-spot difference between investment rank and tourist potential, which indicates good opportunities for tourism development in this region.
When analysing the group of regions above the diagonal line, we should note the Republic of Bashkortostan, the Nizhny Novgorod and Samara oblasts, where investment ranks and tourist potential ranks are high enough. Tourist potential indicators currently exceed investment indicators, which indicates high efficiency of potential realization in these territories, as well as development prospects, especially in attracting investors. Good tourist potential indicators are observed in the Kirov, Orenburg and Saratov oblasts; however, tourism investment rates are quite low. The fact that these regions do not pay much attention to the financing of the tourism industry could turn against them as they may be replaced from the group of regions above the diagonal line by the competing regions which invest more in tourism development.
Conclusion. It is evident in the case of the regions of the Volga Federal District that tourist potential of the territories and its realization efficiency are quite different. The first five leaders of the Volga Federal District which have already established themselves as leading in both tourist potential and tourism income over the past five years have long-term program of tourism development. They include the republics of Tatarstan, Bashkortostan, Perm Krai, the Nizhny Novgorod and Samara oblasts. The five leaders have developed detailed programs with several sub-programs, elaborately researched the indicators of expected measure effectiveness, mechanisms and program effects. The aforementioned regions have detailed, across all budget items, the activities, developed programs to promote the region as a tourist destination, scheduled their participation in Russian and international exhibitions and tourist forums, festivals and contests, advertising tourist potential in Russian and foreign media, publicity and information tours for the Russian and foreign media and tour operators. Funds for Internet technology, website hosting, creation and support of tourism Internet portals, creation of interactive route planning maps, geographic information systems and virtual models of places of interest, as well as tourist information system creation and support have been used for tourist potential promotion of the regions mentioned above.
Tourism development programs in a number of regions (Chuvash Republic, Republic of Tatarstan and Bashkortostan, Nizhny Novgorod and Samara oblasts) include credit and financial mechanisms of state support for investors, rural and social tourism, grants for the development of tourism. However, tourism development programs in the Udmurt Republic, the Orenburg, Ulyanovsk and Penza oblasts little or no attention is given to scientific and research works on the creation of recreational areas, the development of technological and economic rationales for research projects of tourist clusters in order to include them in the Federal target program “Development of domestic and inbound tourism in the Russian Federation (2011–2018)”. In addition, the aforementioned directions little attention is paid to improving the system of training, retraining and advanced training in the sphere of tourism and academic support, training seminars including those with participation of foreign experts, publishing methodological literature, international internships of experience exchange, establishment of the international exchange system.
Data obtained from plotting the figure on tourist potential realization efficiency of the regions of the Volga federal District may be helpful in improving the existing tourism development programs in the regions and the country as a whole. The relevance of assessing tourist potential realization efficiency raises the acute issue of the development of unified indicators characterizing the expected outcomes of tourism development programs implementation in regional strategic programs, as well as monitoring the programs’ implementation. Transparency and immediate availability should become the most important principles of tourism development program monitoring; the results reports must be available to a wide range of users and posted on the websites of regional ministries for tourism. It is necessary to develop assessment tools which would allow considering both positive and negative impacts of tourist potential development, such as environmental load or deteriorating living conditions of local residents, as well as to create incentives for the development and implementation of regional, interregional and international tourism projects.
References The rationale for comparative effectiveness of tourist potential realization (case study of the Volga region)
- Aleksandrova A.Yu. Otsenochnye metody . Geografiya turizma , Moscow: Knorus, 2008, pp. 205-214..
- Drozdov A.V. Vyyavlenie, otsenka i ispol'zovanie turistskikh resursov Rossii: sovremennaya situatsiya, problemy i puti ikh resheniya . Aktual'nye problemy turizma: sbornik nauchnykh trudov Rossiiskoi mezhdunarodnoi akademii turizma , no. 1, 2007, pp. 228-250..
- Investitsionnye reitingi regionov Rossii . Available at: http://raexpert.ru/rankings/#r_1108..
- Orlova V.S., Leonidova E.G. Kompleksnaya otsenka turistskogo potentsiala munitsipal'nykh obrazovanii Vologodskoi oblasti: inform.-analit. zapiska o pervom etape NIR . Vologda, 2011. 86 p..
- Kuskov A.S. Turistskoe resursovedenie . Moscow: Akademiya, 2008. 208 p..
- Marchenko G., Machul'skaya E. Klondaik dlya investora. Turizm po polnomu pravu pretenduet na rol' natsional'nogo proekta . Available at: http://www.raexpert.ru/ratings/regions/2005/part5/..
- Orlova V.S., Leonidova E.G. Turistskii potentsial Vologodskoi oblasti . Problemy razvitiya territorii , issue 4 (56), 2011, pp. 51-57..
- Robinson B.V. Osobennosti otsenki potentsiala resursov razvitiya turizma . Sovremennaya nauka: aktual'nye problemy i puti ikh resheniya , 2013, issue 5, pp. 28-33..
- Sarancha M.A. Metodologicheskie problemy integral'noi otsenki turistsko-rekreatsionnogo potentsiala territorii //Vestnik Udmurtskogo universiteta , no. 1, 2011, pp. 118-127..
- Selivanov I.A. Razrabotka sistemnoi modeli kompleksnoi otsenki turistskikh resursov regiona . Rossiiskii ekonomicheskii internet-zhurnal , no. 1, 2006. Available at: http://www.e-rej.ru/publications/107..
- Ushakova E.O. Voprosy kompleksnoi otsenki turistskikh resursov regiona . Rossiiskoe predprinimatel'stvo , 2012, issue 8, pp. 132-137..
- Federal'naya sluzhba gosudarstvennoi statistiki. Oborot po dokhodam ot gostinits i restoranov Privolzhskogo okruga . Available at: http://maristat.mari.ru/scripts/dbdpfoInet/DBInet.cgi..
- Federal'noe agentstvo po turizmu . Available at: http://www.russiatourism.ru/contents/statistika/statisticheskie-dannye-po-rf/..
- Sheresheva M.Yu., Badzho R. Setevoi podkhod v izuchenii turistskikh destinatsii: novye tendentsii . Initsiativy 21 veka , 2014, no. 2, pp. 58-63..
- Ashouri P., Fariyadi Sh. Potential Assessment of Nature-Based Tourism Destinations Using MCA Techniques (Case Study: Lavasan-e Koochak). Journal of Environmental Studies, 2010, no. 36, pp. 55-76.
- Buhalis D. Marketing the Competitive Destination of the Future. Tourism Management, 2000, no. 21 (1), pp. 97-116.
- Cocklin C., Harte M., Hay J. Resource Assessment for Recreation and Tourism: A New Zealand Example. Landscape and Urban Planning, 1990, no. 19, pp. 291-303.
- Constantin M., Daniela-Luminia C. Tourism Potential and the Diminishing of Regional Disparities in Romania. Economy and Business Administration, 2009, no. 2, pp. 151-155.
- D'angella F., Go F. M. Tale of two cities' collaborative tourism marketing: Towards a theory of destination stakeholder assessment. Tourism Management, 2009, no. 30(3), pp. 429-440.
- Enright M. J., Newton J. Tourism Destination Competitiveness: a Quantitative Approach. Tourism Management, 2004, no. 25(6), pp. 777-788.
- Polukhina A.N., Rukomoinikova V.P. Development of cluster approach in tourism (Russia case study). Journal of Applied Engineering Science, 2016, volume 14, no. 1, pp. 61-67.
- Priskin J. Assessment of natural resources for nature-based tourism: the case of the Central Coast Region of Western Australia. Tourism Management, 2001, no. 22(6), pp. 637-648.
- Romero R., Homar V. Projections of the climate potential for tourism in Platja de Palma, Spain. International Journal of Tourism Research, 2012, no. 11, pp. 64-82.
