The reinforcement of particulate-filled polymer nanocomposites by nanoparticles aggregates

Author: Kozlov Georgiy Vladimirovich, Mikitaev Abdullah Kasbulatovich
Journal: НБИ технологии @nbi-technologies
Section: Технико-технологические инновации
Article in issue: 3 (22), 2016.
Free access
The applicability of irreversible aggregation model for theoretical description of nanofiller particles aggregation process in polymer nanocomposites has been shown. The main factors, influencing nanoparticles aggregation process, were revealed. It has been shown that strongly expressed particulate nanofiller particles aggregation results in sharp (in about 4 times) formed fractal aggregates real elasticity modulus reduction. Nanofiller particles aggregation is realized by cluster-cluster mechanism and results in the formed fractal aggregates density essential reduction, that is the cause of their elasticity modulus decrease. As distinct from microcomposites, nanocomposites require consideration of interfacial effects for elasticity modulus correct description in virtue of a well-known large fraction of phases division surfaces for them.
Nanocomposite, globular nanocarbon, calcium carbonate, aggregation, interfacial effects, reinforcement
Short address: https://sciup.org/14968431
IDR: 14968431 | UDC: 541.64 | DOI: 10.15688/jvolsu10.2016.3.3
Армирование дисперсно-наполненных полимерных нанокомпозитов агрегатами наночастиц
В работе была рассмотрена модель необратимой агрегации для теоретического описания процесса агрегации частиц нанонаполнителя в полимерных нанокомпозитах. Были выявлены основные факторы, влияющие на процесс агрегации наночастиц.
Text of the scientific article The reinforcement of particulate-filled polymer nanocomposites by nanoparticles aggregates
DOI:
In the course of technological process of particulate-filled polymer composites in general [19] and nanocomposites [1; 8] in particular, preparation of the initial filler powder particles aggregation in more or less large particles aggregates always occurs. The aggregation process exercises essential influence on composites (nanocomposites) macroscopic properties [1; 3; 8; 10; 15; 19]. For nanocomposites the aggregation process gains special significance, since its intensity can be such, that nanofiller particles aggregates size exceeds 100 nm – the value, which is assumed (although conditionally enough [6]) as upper dimensional limit for a nanoparticle. In other words, the aggregation process can result in the situation, when initially supposed nanocomposite ceases to be such. Therefore at present a number of methods exists, allowing to suppress nanoparticles aggregation process [13; 15].
Analytically this process is treated as follows.
The authors [5] obtain the relationship:
k ( r ) = 7.5 x 10 - 3 S u , (1)
where k ( r ) is aggregation parameter, Su is specific surface of nanofiller initial particles, which is given in m2/g.
In its turn, the value Su is determined as follows [7]:
Su TA 7 ρ n D p
where p n is nanofiller density, D p is diameter of its initial particles.
From the equations (1) and (2) it follows, that Dp reduction results in Su growth, that in its turn reflects in the aggregation intensification, characterized by the parameter k ( r ) increasing. Therefore in polymer nanocomposites strengthening (reinforcing) element are not nanofiller initial particles themselves, but their aggregates [2]. This results in essential changes of nanofiller elasticity modulus, the value of which is determined with the aid of the equation [2]:
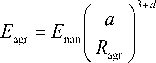
where E agr is nanofiller particles aggregate elasticity modulus, E nan is elasticity modulus of material, from which the nanofiller was obtained, a is an initial nanoparticles size, R agr is a nanoparticles aggregate radius, dl is chemical dimension of the indicated aggregate, which is equal to ~1.1 [2].
As it follows from the equation (3), the initial nanoparticles aggregation degree enhancement, expressed by R agr growth, results in E agr decrease (the rest of parameters in the equation (3) are constant) and, as consequence, in nanocomposite elasticity modulus reduction.
Very often the elasticity modulus (or reinforcement degree) of polymer composites (nanocomposites) is described within the frameworks of numerous micromechanical models, which proceed from elasticity modulus of matrix polymer and filler (nanofiller) and the latter volume contents [1]. Additionally it is supposed, that the indicated above characteristics of a filler are approximately equal to the corresponding parameters of compact material, from which a filler is prepared. This practice is inapplicable absolutely in case of polymer nanocomposites with fine-grained nanofiller, since in this case a polymer is reinforced by nanofiller fractal aggregates, whose elasticity modulus and density differ essentially from compact material characteristics (see the equation (3)) [17; 21]. Therefore the microcomposite models application, as a rule, gives a large error at polymer composites elasticity modulus evaluation, that in its turn results in the appearance of an indicated models modifications large number [12].
Proceeding from the said above, the present work purpose is the theoretical treatment of particulate nanofiller aggregation process and elasticity modulus (reinforcement degree) particulate-filled polymer nanocomposites with due regard for the indicated effect within the framework of irreversible aggregation models and fractal analysis.
Experimental
Polypropylene (PP) “Kaplen” of mark 01030 with average weight molecular mass of ~(2-3) x 103 and polydispersity index 4.5 was used as matrix polymer. Nanodimensional calcium carbonate (CaCO 3 ) in compound form of mark Nano-Cal P-1014 (production of China) with particles size of 80 nm and mass contents of 1-7 mass. % and globular nanocarbon (GNC) (production of corporations group “United Systems”, Moscow, Russian Federation) with particles size of 5-6 nm, specific surface of 1 400 m2/g and mass contents of 0.25-3.0 mass. % were applied as nanofiller.
Nanocomposites PP/CaCO 3 and PP/GNC were prepared by components mixing in melt on a twin screw extruder Thermo Haake, model Reomex RTW 25/42, production of German Federal Republic. Mixing was performed at temperature 463-503 K and screw speed of 50 rpm during 5 min. Testing samples were prepared by casting under pressure method on a casting machine Test Sample Molding Apparatus RR/TS MP of firm Ray-Ran (Taiwan) at temperature 483 K and pressure 43 MPa.
The nanocomposites melt viscosity was characterized by a melt flow index (MFI). MFI measurements were performed on an extrusion-type plastometer Noselab ATS A-MeP (production of Italy) with capillary diameter of 2.095 ± 0.005 mm at temperature 513 K and load of 2.16 kg. The sample was maintained at the indicated temperature during 4.5 ± 0.5 min.
Uniaxial tension mechanical tests have been performed on the samples in the shape of a two-sided spade with sizes according to GOST 112 62-80. The tests have been conducted on a universal testing apparatus Gotech Testing Machine CT-TCS 2000, production of German Federal Republic, at temperature 293 K and strain rate ~ 2 x 10 -3 s-1.
Results and Discussion
The particulate nanofiller aggregation degree can be evaluated and aggregates diameter D agr quantitative estimation can be performed within the framework of strength dispersive theory [9], where shear yield stress of nanocomposite т n is determined as follows:
G n b B
T n = Tm + ,
where т m is shear yield stress of polymer matrix, b B is Burgers vector, Gn is nanocomposite shear modulus, X is distance between nanofiller particles.
In case of nanofiller particles aggregation the equation (4) has the look [9]:
G n b B
T n T m + k ( r К (5)
where k ( r ) is aggregation parameter.
The parameters, included in the equations (4) and (5) are determined as follows. The general relationship between normal stress о and shear stress т has the look [4]:
p . = 188( D p )1/3, kg/m3, (9)
where Dp is given in nm.
The value of Burgers vector bB for polymeric materials is determined as follows [3]:
b B =

, Å,
where C „ is characteristic ratio, connected with nanocomposite structure dimension df by the equation [3]:
C" d (d-1)( d - df)+ 3, where d is dimension of Euclidean space, in which a fractal is considered (it is obvious, that in our case d = 3).
The value df can be calculated according to the equation [11]:
df = ( d - 1 )( 1 + v ), (12)
where v is Poisson’s ratio, estimated according to the mechanical tests results with the aid of the relationship [10]:
ar 1 - 2 v
ET. = ^h+ v ) • (13)
where о Y and E n are yield stress and elasticity modulus of nanocomposite, respectively.
Nanocomposite moduli En and Gn are connected between themselves by the relationship [1]:
σ
т = —i=. 3
En df'
The intercommunication of matrix polymer т m and nanocomposite polymer matrix т т shear yield stresses is given as follows [5]:
And at last, the distance X between nanofiller nonaggregated particles is determined according to the equation [19]:
T m = T m (1 -ф . /' I, С 7 )
where ф n is nanofiller volume content, which can be determined according to the well-known formula [5]:
D p
W ф . = —, ρ n
where W n is nanofiller mass contents, p n is its density, which for nanoparticles is determined according to the equation [5]:
From the equations (5) and (15) k(r) growth from 5.65 up to 43.70 within the range of Wn= 0.253.0 mass. % for nanocomposites PP/GNC and from 1.0 up to 2.87 within the range of Wn= 1-7 mass. % for nanocomposites PP/CaCO3 follows. Let us note, that the indicated variation k(r) for the considered nanocomposites corresponds completely to the equations (1) and (2). Let us consider, how such k(r) growth is reflected on nanofiller particles aggregates diameter Dagr. The equations (8), (9) and (15) combination gives the following relationship:
k (r)X = f 0.251nD ,
I W n

- 2
D agr 2,
allowing at Dp replacement on D ag to determine real, i. e. with accounting of nanofiller particles aggregation, nanoparticles aggregates diameter of the used nanofiller. Calculation according to the equation (16) shows D ag increasing (corresponding to k ( r ) growth) from 25 up to 125 nm within the range of Wn = 0.25-3.0 mass. % for GNC and from 80 up to 190 nm within the range of 1-7 mass. % for CaCO 3 . Further nanofiller particles aggregates density can be calculated according to the equation (9) at the condition of Dp replacement by D agr .
Within the framework of irreversible aggregation model D agr value is given by the following relationship [20]:
D ~ agr
1/ d a f gr
4 cokT | 1/ d agr
I t f к 3П m о )
where c 0 is nanoparticles initial concentration, k is Boltzmann constant, T is temperature, n is medium viscosity, m 0 is mass of initial nanoparticle, d a f gr is fractal dimension of particles aggregate, t is aggregation process duration.
Let us consider estimation methods of the parameters, included in the relationship (17). In the simplest case it can be accepted that all particles of nanofiller initial powder have the same size and mass. In this case c 0 ~ф n , where ф n value is determined according to the equation (8) with using nanofiller particles aggregates diameter D agr . П value is accepted equal to reciprocal of MFI value and m 0 magnitude was calculated as follows. In supposition of nanofiller initial particles spherical shape the nanoparticle volume was calculated according to the known values of their diameter D p and then, using p n value, calculated according to the equation (8), their mass m 0 can be estimated. T value is accepted as constant and equal to nanocomposites processing duration, i. e. 300 s.
The fractal dimension of nanofiller particles aggregates structure d a f gr was calculated with the aid of the equation [17]:
г D a d " - d
P n = P dens ^g" I , (18) к 2 a )
where p dens is density of compact material of nanofiller particles, a is self-similarity (fractality) lower scale of nanofiller particles aggregates.
p dens value for carbon is accepted equal to 2700 kg/m2, for CaCO 3 – 2000 kg/m2 [17] and a value is accepted equal to the initial GNC particle radius, i. e. 2.5 nm. d a f gr values, calculated according to the equation (18), are equal to 2.092.67 and 2.47-2.75 for GNC and CaCO 3 nanoparticles aggregates, respectively.
In Fig. 1 the dependences D agr ( Wn ), plotted according to the equations (16) and (17), comparison is adduced. As one can see, the good enough correspondence of estimations according to both indicated methods was obtained (the average discrepancy of D agr values, calculated with the usage of these relationships, makes up ~16 %). This circumstance indicates, that irreversible aggregation models can be used for the theoretical description of particulate nanofiller particles aggregation processes. Besides, the equation (17) analysis demonstrates various factors influence on nanofiller particles aggregates size (or their aggregation degree). So, c 0 , T and t increasing results in aggregation processes intensification and П , m о and d f 81 enhancement - to their weakening.
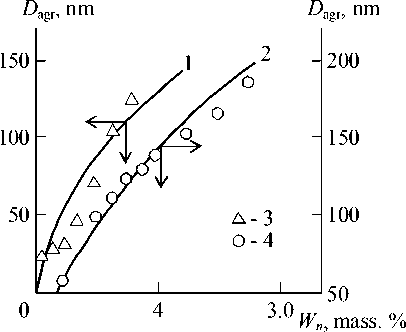
Fig. 1. The dependences of nanofiller particles aggregates diameter D agr on nanofiller mass contents Wn for nanocomposites PP/GNC (1, 3) and PP/CaCO3 (2, 4):
1 , 2 – calculation according to the equation (16);
3 , 4 – calculation according to therelationship (17)
Let us note in conclusion, that proportionality coefficient in the relationship (17)
for GNC and CaCO ( c and c ,
3 GNC CaCO3
respectively) can be approximated by the following relationship:
c CaCO3 c GNC
1/ d av
CaCO f m
4 m GNC J
,
where m 0CaCO3 and m 0CNC are masses of the initial particles of CaCO3 and GNC, respectively, d a f v is average fractal dimension of the indicated nanoparticles aggregates.
Further elasticity modulus E agr of nanofiller particles aggregates according to the equation (3) can be determined. Let us consider the concrete conditions of this equation usage in reference to nanocomposites PP/GNC. Two possible variants exist at parameter a choice in the indicated equation. The first implies, that the value a is equal to GNC initial particles diameter [21], i. e. 5.5 nm. Such supposition means, that GNC nanoparticles aggregates are formed by particle-cluster (P-Cl) mechanism, i. e. by separate particles GNC joining a growing aggregate [18]. However, such supposition gives unreally high E agr values of order of 5 x 10⁵ GPa. The other variant assumes, that nanofiller aggregation is realized by a clustercluster (Cl-Cl) mechanism, i. e. small clusters association in larger ones [18]. In such model aggregate radius R a - 1 on the previous ( i -1) aggregation stage is accepted as a and then the equation (3) can be rewritten as follows:
E

The elasticity modulus E agr real values within the range of 21.3-5.0 GPa were obtained at such calculation method. Further the simplest microcomposite models can be used for nanocomposite elasticity modulus En estimation. For the case of uniform strain in nanocomposite phases the theoretical value En ( EnT ) is given by a parallel model [1]:
ET = E agr Ф n + Em ( 1 -Ф n )> (21)
where Em is elasticity modulus of matrix polymer.
For the case of uniform stress in nanocomposite phases the lower theoretical boundary EnT is determined according to the serial model [1]:
E T = E agr Em
" E agr ( 1 - Ф n ) + Em Ф,
In Fig. 2 the comparison of the received experimentally En and calculated according to the equations (21) and (22) EnT elasticity modulus values of the considered nanocomposites PP/GNC is adduced. As one can see, the experimental data correspond better to the determined according to the equation (21) EnT upper boundary (in this case average discrepancy of En and EnT makes up ~8 %). The indicated discrepancy is due to objective causes. As it is known [1], at the equations (21) and (22) derivation the equality of Poisson’s ratio for nanocomposite both phases was supposed. In practice this condition non-fulfillment defines discrepancy between experimental and theoretical data.
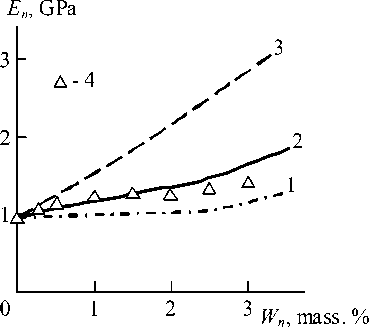
Fig. 2. The dependences of elasticity modulus En on nanofiller mass contents Wn for nanocomposites PP/GNC:
1 – calculation according to the equation (22);
2 – according to the equation (21) at E agr = variant;
3 – according to the equation (21)
at E agr = const = 21.3 GPa; 4 – experimental data
In Fig. 2 the dependence EnT ( Wn ), calculated according to the equation (21) in supposition E agr = const = 21.3 GPa, is also adduced. As one can see, in this case the theoretical values of elasticity modulus EnT exceed essentially experimentally received ones En . Hence, the good correspondence of experiment and calculation according to the equation (21) is due to real values E agr usage only.
It is obvious, that nanoparticles aggregates elasticity modulus reduction is due to the indicated aggregates diameter growth and, as consequence, their density pn reduction, which can be calculated according to the equation (18). In Fig. 3 the dependence Eagr(pn) is adduced, which, as was expected, proves to be linear, passing through coordinates origin and is described analytically by the following empirical equation:
E agr = 12.6 x 10 - 3p „ , GPa, (23)
where p n is given in kg/m3.
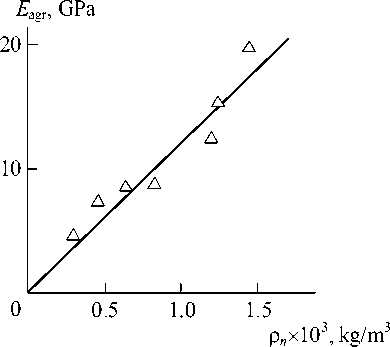
Fig. 3. The dependence of GNC nanoparticles fractal aggregates elasticity modulus E agr on their density p n for nanocomposites Pp/GNC
The limiting magnitude p n = p dens allows to obtain the greatest value E agr « 34 GPa for GNC aggregates, that is the real value of this parameter [12].
The authors [9] proposed to use for nanocomposites elasticity modulus En determination a modified mixtures rule, which in original variant gives upper limiting value of composites elasticity modulus [1]:
n m\ ф n/ nanTn, v where b < 1 is coefficient, reflecting nanofiller properties realization degree in polymer nanocomposite. In the present work the parameter bEnan as a matter of fact presents nanofiller effective modulus or, more precisely, its aggregates modulus Eagr (compare with the equation (21)).
In Fig. 4 the dependence of parameter b in the equation (24) on nanofiller particles aggregates diameter Dagr, calculated according to the equation (16), for the studied nanocomposites is adduced. As one can see, this dependence disintegrates on two linear parts: at small Dagr fast decay of b at Dagr growth is observed and at large enough Dagr the value b » const ~ 0.175. Let us note that dimensional interval of the indicated transition, shown in Fig. 4 by a shaded area, makes up Dagr ~ 70-100 nm, i. e. it coincides approximately with upper dimensional boundary of nanoparticles interval (although a conditional one [6]), which is equal to about 100 nm. As a matter of fact, the indicated dimensional interval defines the transition from nanocomposites to microcomposites, the dependence b(Dagr) for which differs actually qualitatively. The adduced in Fig. 4 dependence b(Dagr) can be described analytically by the following integrated equation:
b = 0.67 - 6.7 x 10 - 3 D agr , for D agr < 70 nm, b = const = 0.175, for D agr > 70 nm.
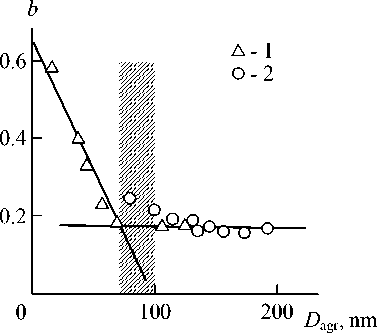
Fig. 4. The dependence of parameter b on nanofiller particles aggregates diameter D agr for nanocomposites PP/GNC ( 1 ) and PP/CaCO3 ( 2 ). The shaded area indicates transition of nanofiller particles aggregates from nano- to microbehavior
In Fig. 5 the comparison of experimentally obtained and calculated according to the equation (25) dependences E n ( ф n ) is adduced for the studied nanocomposites. In this case the parameter b value was estimated according to the equation (25) and values E nan were accepted equal to 30 GPa for GNC and 15 GPa for CaCO 3 . As one can see, the good correspondence of theory and experiment is obtained (their mean discrepancy makes up 3 %, that approximately equal to the experimental error of En determination). Higher values En for nanocomposites PP/GNC in comparison with PP/
CaCO 3 even at D agr > 100 nm are due to two factors: the initial nanoparticles of smaller size, that give higher values ф n at the same W n values (see the equations (8) and (9)) and higher value E nan . It is important to note close values E agr for nanocomposites PP/GNC, determined according to the equation (20) and as bE nan .
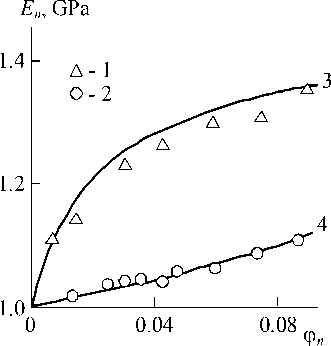
Fig. 5. The comparison of experimentally received (1, 2) and calculated according to the equations (24) and (25) (3, 4) dependences of elasticity modulus En on nanofiller volume contents фn for nanocomposites PP/GNC (1, 3) and PP/CaCO3 (2, 4)
The authors [4] proposed the following percolation relationship for polymer microcomposites reinforcement degree Ec / Em description:
Ec- =i+ и(ф „ ) 1/7, E m
where Ec is elasticity modulus of microcomposite.
Later the relationship (26) was modified in reference to the polymer nanocomposites case [16]:
E = 1 + 11(ф n +ф^ p, (27) Em where ф^ is relative fraction of interfacial regions.
It is easy to see, that the modified relationship (27) takes into consideration a factor of sharp increase of division surfaces polymer matrix-nanofiller [2]. In Fig. 6 the comparison of experimentally obtained and calculated according to the equation (26) dependences En(фn) for the considered nanocomposites is adduced. As it follows from this figure data, the equation (26) describes well the experimental data for nanocomposites PP/ CaCO3, but the corresponding data for nanocomposites PP/GNC set essentially higher than theoretical curve. This discrepancy cause is obvious from the equations (26) and (27) comparison – for nanocomposites PP/GNC interfacial effects accounting is necessary, i. e. parameter ф(z accounting. Hence, in the considered case only compositions PP/GNC are true nanocomposites.
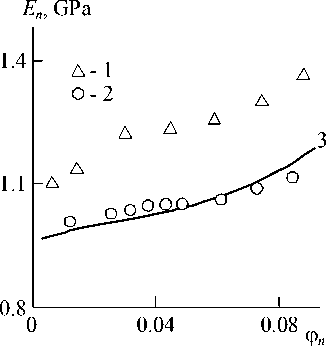
Fig. 6. The comparison of experimentally received ( 1 , 2 ) and calculated according to the equations (26) ( 3 ) dependences of elasticity modulus En on nanofiller volume contents ф n for nanocomposites PP/GNC (1, 3) and PP/CaCO3 (2, 4)
Conclusions
The applicability of irreversible aggregation models for theoretical description of particulate nanofiller particles aggregation processes in polymer nanocomposites has been shown. Analysis within the framework of the indicated models allows to reveal the influence of factors on aggregation degree.
Strongly expressed aggregation of particulate nanofiller particles results in sharp (in about 4 times) formed fractal aggregates real elasticity modulus reduction. In its turn, this process defines nanocomposites as the whole elasticity modulus reduction. Nanofiller particles aggregation is realized by a cluster-cluster mechanism and results in the formed fractal aggregates density essential reduction, that is the cause of their elasticity modulus decreasing.
A nanofiller elastic properties realization degree is defined by the aggregation of its initial particles level. Unlike microcomposites, nanocomposites require interfacial effects accounting for elasticity modulus correct description in virtue of well-known large fraction of phases division surfaces for them.
References The reinforcement of particulate-filled polymer nanocomposites by nanoparticles aggregates
- Ahmed S., Jones F.R. Reinforcement of Rubber by Fractal Aggregates. J. Mater. Sci., 1990, vol. 25, no. 12, pp. 4933-4942.
- Andrievsky R.A. Nanomaterialy: Kontseptsiya i Sovremennye Problemy. Russian Chemical Journal, 2002, vol. 46, no. 5, pp. 50-56.
- Balankin A.S. Synergetics of Deformable Body. Moscow, Publishers of Ministry Defence SSSR, 1991. 404 p.
- Bobryshev A.N., Kozomazov V.N., Babin L.O., Solomatov V.I. Synergetics of Composite Materials. Lipetsk, NPO ORIUS Publ., 1994. 154 p.
- Brady L.M., Ball R.C. Fractal Growth of Copper Electr odeposits. Nature, 1984, vol. 309, no. 5965, pp. 225-229.
- Buchachenko A.L. Nanochemistry: a Direct Route to High Technologies of the New Century. Achievements of Chemistry, 2003, vol. 72, no. 5, pp. 419-437.
- Edwards D.C. Polymer-filler Interaction in Rubber Reinforcement. J. Mater. Dci., 1990, vol. 25, no. 12, pp. 4175-4185.
- Hon eycom be R. W. K. The Plastic Deformation of Metals. Cambridge, Edwards Arnold Publ., 1968. 402 p.
- Komarov B.A., Dzhavadyan E.A., Irzhak V.I., Ryaben ko A.G., Lesn ichaya V.A., Zvereva G.I., Krestinin A.V. Polymer Science, Series A, 2001, vol. 53, no. 6, pp. 897-905.
- Kozlov G.V., Sanditov D.S. Anharmonic Effects and Physical-Mechanical Properties of Polymers. Novosibirsk, Nauka Publ., 1994. 261 p.
- Kozlov G.V., Yanovskii Yu.G., Zaikov G.E. Particulate-Filled Polymer Nanocomposites. Structure, Properties, Perspectives. New York, Nova Science Publ., Inc., 2014. 273 p.
- Kozlov G.V., Yanovskiy Yu.G., Zaikov G.E. Structure and Properties of Particulate-Filled Polymer Composites: The Farctal Analysis. New York, Nova Science Publ., Inc., 2010. 282 p.
- Kozlov G.V., Yanovskiy Yu.G., Zaikov G.E. Synergetics and Fractal Analysis of Polymer Composites Filled with Short Fibers. New York, Nova Science Publ., Inc., 2011. 223 p.
- Kozlov G.V., Zaikov G.E. Structure and Properties of Particulate-Filled Polymer Nanocomposites. Saarbrücken, Lambert Academic Publ., 2012. 112 p.
- Kozlov G.V., Zaikov G.E. Structure of the Polymer Amorphous State. Utrecht, Boston, Brill Academic Publ., 2004. 465 p.
- Malamatov A.Kh., Kozlov G.V., Mikitaev M.A. Reinforcement Mechanisms of Polymer Nanocomposites. Moscow, Publishers of D.I. Mendeleev RKhTU, 2006. 240 p.
- Mikitaev A.K., Kozlov G.V., Zaikov G.E. Polymer Nanocomposites: Variety of Structural Forms and Applications. New York, Nova Science Publ., Inc., 2008. 319 p.
- Shogenov V.N., Kozlov G.V. Fractal Clusters in Physics-Chemistry of Polymers. Nalchik, Polygraphservice and T, 2002. 268 p.
- Sumita M., Tsukumo Y., Miyasaka K., Ishikawa K. Tensile Yield Stress of Polypropylene Composites Filled with Ultrafine Particles. J. Mater. Sci., 1983, vol. 18, no. 5, pp. 1758-1764.
- Weitz D.A., Huang J.S., Lin M.Y., Sung J. Dynamics of Diffusion-limited Kinetic Aggregation. Phys. Rev. Lett., 1984, vol. 53, no. 17, pp. 1657-1660.
- Witten T.A., Rubinstein M., Colby R.H. Rein forcemen t of Rubber by Fr actal Aggregates. J. Phys. II France, 1993, vol. 3, no. 3, pp. 367-383.
