The research of Raman spectra in CoxMn1-x solid solutions

Author: Aplesnin S.S., Romanova O.B., Krylov A.S., Hsiang-Lin Liu, Aldashev I.V.
Journal: Сибирский аэрокосмический журнал @vestnik-sibsau
Section: Математика, механика, информатика
Article in issue: 2 (35), 2011.
Free access
Temperature dependence of Raman spectra in the frequency interval 100... 1 200 cm1 in the 100...300 K range temperature has been investigated in the substance of CoxMn1-xS solid solutions. A Raman spectra study has uncovered evidence of strong orbital fluctuations that manifest itself in kind of composite line shape at ω2 273...298 cm-1, arisen from splitting of phonon modes with different temperature dependences of the intensity below the orbital ordering transition.
Magnetically ordered materials, raman spectra, spin-orbit effects, orbital fluctuations, sulfides
Short address: https://sciup.org/148176573
IDR: 148176573 | UDC: 539.21:537.86
Исследование рамановских спектров в твердых растворах CoxMn1-x
На твердых растворах СохМп1-хS проведены исследования температурных зависимостей рамановских спектров в интервале частот 100... 1 200 см-1 и температур 100... 300 К. Изучение рамановских спектров позволило установить наличие сильных орбитальных флуктуаций в виде сложной формы линии на ω2 = 273...298 см-1, возникающих в результате расщепления фононной моды с различными температурными зависимостями интенсивности ниже перехода орбитального упорядочения.
Text of the scientific article The research of Raman spectra in CoxMn1-x solid solutions
An active role of orbital degree of freedom in the lattice [1] and the electronic response can be most typically seen in manganese oxide compounds with perovskite structure [2–4]. A more transparent example is the case of RTiO 3 [5] and RVO 3 [6; 7] with 3 d 1 and 3 d 2 electron configuration, respectively, both retaining the orbital degree of freedom in the t 2 g state. The actual orbital order pattern in these t 2 g electron systems is not straightforwardly visible from the crystal structure alone because of the relatively weak Jahn–Teller (JT) distortion of the t2 g electron. An example of dynamical orbital correlation is seen in the spin-state transition in LaCoO 3 with 3 d 6 configuration of Co [8]. In fact, the correlated local lattice distortion clearly shows up in the infrared phonon spectra in accord with the spin-state crossover [9], although the average lattice structure appears to be undistorted from that of the ground state. However,
LaCoO 3 undergoes the insulator-to-metal transition by warming above 500 K. As predicted by the LDA calculation [8], this phenomenon may be interpreted as the loss of the orbital (short-range) order.
Charge-orbital order can arise from to redistribution of electron density between orbitales and as a results of electron-lattice interaction induces an anomalous change in the phonons frequency and the linewidth. The Raman background can give information of the electronic excitations. The change of the diffusive Raman scattering in the paramagnetic phase has been attributed to the change of the lattice vibrations and their correlation to the electron structure. A detailed investigation of the electronic and lattice excitations is therefore crucial for the understanding of origin of strong coupling between charge, lattice and spin degrees of freedom of the Co х Mn 1– х S solid solutions.
The occupancy of the orbitals and the orbital order can cause to change in the static and dynamic properties of structure. Raman spectroscopy proved to be a useful tool for the study of structural phase transitions. Materials presenting perovskite crystal structure, with a large number of structural changes, have been extensively studied by this technique [10]. A broadening of the phonon peaks, associated to the lattice disorder and the presence of a central mode near and above the transition temperature is observed at the order-disorder transitions. Raman-scattering studies are used for study of the JT transition in LaMnO3 [11] and for polycrystalline α-MnSe samples [12]. α-MnSe has a NaCl-type structure with O h symmetry and only one infrared (IR) active mode of F 1 u symmetry. The rock salt structure has no Raman active modes, but there are three irreducible components A 1 g , T 2 g and E g of a second-rank tensor. All combinations of modes can be observed in unpolarized measurements on the polycrystalline samples, i. e., summation bands, difference bands (at low temperatures) and overtones [13]. Transition energy 6A 1 -4 T 2 depends on spin and orbital ordering and on spin and phonon dynamics. The measurements were made with a Horiba Jobin Yvon T64000 Raman spectrometer. The Raman spectra taken in the temperature range 140…300 K at the frequencies 100…750 cm–1 are given in fig. 1. At room temperature, the spectra are obtained in the wider frequency band 100…1 200 cm–1. At the frequencies ω 1 = 115 cm–1, ω 2 = 273…298 cm–1, and ω 3 = 840 cm–1 the active Raman modes are observed. According to the literature data [12], positioning two peaks at the frequencies ω 1 = 115 cm–1 and ω 2 = 260 cm–1 for MnS is related to transverse optical mode TO(X) and the combination of optical and acoustic phonon modes TO + LA(X). The Debye temperature for MnS is T D = 230 K and the corresponding frequency is ω D = 165 cm–1. In the MnS the third peak at the frequency ω 3 = 840 cm–1 is absent and this hump may be attributed to polaron, a collision-dominated response, or a plasmalike excitation. A similar broad peak around 1 200 cm–1 is observed in La 1- x Sr x MnO 3 and was explained by a polaron excitation [14].
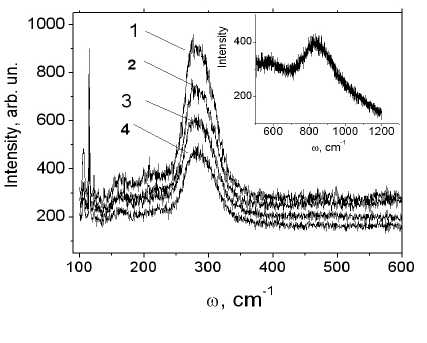
Fig. 1. Raman spectra versus frequency at temperatures of 160 K (1), 210 K (2), 230 K (3), and 250 K (4) for the Co0.05Mn0.95S sample. The inset presents the Raman spectra taken at T = 300 K for the same sample
The weak feature in I (ω) is observed at frequency 163 cm–1 to be temperature dependent, but the quality of spectra did not allow a quantitative analysis. Because isomorphic crystals MnS have the values of exchange energies, dipolar anisotropy and acoustic magnon [15] in the same range as α-MnSe, the mode frequency 163 cm–1 could be a combination of TO mode and acoustic one-magnon as α-MnSe: ω LTO (Γ) + ω1Mac = = 138 cm–1 + 18 cm–1 = 156 cm–1.
With a decrease in temperature below T < 240 K, the peak at ω 2 becomes asymmetric and may be presented as a two peaks at the frequencies ω 2,1 ≈ 273 cm–1, ω2,2 ≈ 296 cm–1 that is illustrated in fig. 2. The temperature dependence of Co x Mn 1– x S Raman spectra is similar to spectra observed in CaMnO 3 [16]. The linewidth for the 260 cm–1 modes in CaMnO 3 could not be measured above 520 K, due to the large overlapping of both peaks. This compound presents the orthorhombic P nma perovskite crystal structure with Mn+4 ions and a Jahn–Teller distortion of oxygen octahedral is not observed.
The composite form of Raman spectra at ω 2 = 273…298 cm–1, T < 240 K can be attributed to lift of degeneration of phonon modes along X direction in the Brillouin zone as a results of deformation of cubic cell. A distinct character of change in modes intensity at lowering of temperature is shown in fig. 2 by dotted lines.
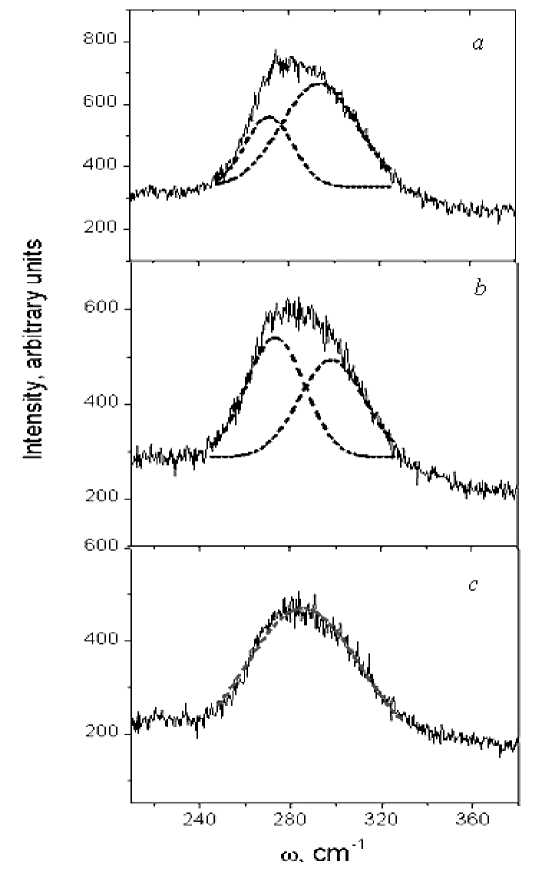
Fig. 2. Raman spectra versus frequency at temperatures of 210 K ( a ), 230 K ( b ), 250 K ( c ) and fitting function for two modes with frequency ω2,1 ≈ 272 cm–1 and ω2,2 ≈ 296 cm–1
Distinction of temperatures, at which feature of characteristic start to manifest by Raman spectra T or = 240K, also exists in the doped manganites.
As T approaches T JT , the structural fluctuations are large enough to break the cooperativeness of the orbital ordering, leading to an average cubic crystal structure at the JT transition [17]. It is interesting to mention that the measured values of the phonon linewidths and intensity for LaMnO 3 , in particular for the bending and stretching modes, are of the order of those found in amorphous materials, suggesting the existence of a high level of structural disorder at T > T or [17].
Change in the shape of line of Raman spectra is attributed to deformation of cubic structure and lifting degeneration of transverse phonon modes along X direction in the Brillouin zone at T ≤ 240 K at which is observed the maximum the magnetoelectric effect [18] arisen from formation of orbital order. For Co x Mn 1– x S solid solution the average crystal structure is not reveal cooperative distortion of the MnS 6 octahedron at T > 240 K. However, above this temperature the short-range orbital ordering may still persist. Below temperature 240 K the degeneration of t2 g orbitals is lifted as results of small deformation of octahedron, that leads to splitting phonon modes in the points Brillouin zone. At frequency ω 1 , the line is very narrow and its shape and frequency are temperature-independent, while the mode intensity decreases by 20 % and becomes temperature-independent at T > 230 K.
