The scale of inequality and the specifics of its perception in modern Russia

Author: Belekhova Galina V.
Journal: Economic and Social Changes: Facts, Trends, Forecast @volnc-esc-en
Section: Social and economic development
Article in issue: 1 т.16, 2023.
Free access
Inequality is a key socio-economic development challenge for the world as a whole and for individual countries. In Russia, the problem of inequality is particularly acute, since the scale and depth of differences in the population’s income greatly exceed the “conditional levels” of normal inequality. In this regard, it is important to prevent the development of negative socio-political processes and the deterioration of public sentiments. The article’s purpose is to determine the peculiarities of the Russian population’s perception of the existing inequality and its manifestations in the country. Using the data from Rosstat and the Organization for Economic Cooperation and Development, we prove that inequality in Russia is large in scale and persists throughout the post-reform period of the country’s development without a clear focus on reducing the depth of polarization of the extreme income groups. We use the data of a cross-country representative study under the program ISSP, conducted in 2019, to examine the perception of inequality by the population of Russia and some foreign countries, specifically the subjective assessment of the depth of inequality, its fairness, the role of the state in reducing income disparities, the features of the redistribution system (role of taxes), accessibility of health and education services, the degree of conflict (dislike) between the poor and the rich. We show that the perception of inequality by Russians differs from the perception of other countries’ residents with a more expressed critical assessment of the depth, injustice, social conflict and ineffectiveness of government actions to reduce income disparities. We find that the population does not show tolerance to non-monetary dimensions of inequality, considering unfair the opportunity of rich people to purchase high quality medical and educational services. We reveal that there are no significant differences in the perception of inequality in different socio-demographic and socio-economic groups of the population. Attention is drawn to the fact that the subjective perception of inequality lies to a greater extent in the field of ideas about a fair social order than it is unambiguously determined by the level of income.
Inequality, income inequality, subjective evaluation, social justice, public demand for redistribution, gini coefficient
Short address: https://sciup.org/147240252
IDR: 147240252 | UDC: 330.59 | DOI: 10.15838/esc.2023.1.85.9
Text of the scientific article The scale of inequality and the specifics of its perception in modern Russia
Socio-economic inequality is a characteristic feature of any modern society, a significant and socially important problem. It is unanimously recognized as “the fact of the principal irremovability and wide social prevalence of this phenomenon” (Gorshkov, 2014, p. 21).
Russian experts and civil servants have been emphasizing for decades that “poverty and inequality are the main “pain points” of modern (post-Soviet) Russian society” (Ilyin, Morev, 2021, p. 12). As RAS Academician M.K. Gorshkov noted, “the problem of social injustice and inequality in Russia occupies the first place in the ranking of social contradictions. For 25 years of reforms it has penetrated into all pores of society and has become a characteristic feature of relations in almost all strata of the population. This is especially true of distribution relations”1. According to official statistics, “the number of Russians living below the poverty line has not actually changed over the past 8 years” (Ilyin, Morev, 2021, p. 13), nor has the excessive scale of differentiation, characterized by R/P 10% ratio and the Gini coefficient, which have remained virtually unchanged over the past decade (Rossoshanskii, Belekhova, 2020, p. 38). Alternative international studies show that in Russia over the past 30 years (1989–2016), the aggregate income of the 50% of the population with the lowest incomes decreased by 20%, while the aggregate income of the top 10% almost doubled (by 171%), and the income of the wealthiest 1% increased by 429%, almost 4.5-fold (Novokmet et al., 2017, pp. 78–79).
The results of numerous foreign studies and analytical reports indicate that in most countries with developed and developing economies, income and property inequality have been increasing since the 1980s, although very unevenly (Alvaredo et al., 2017; Piketty, Saez, 2014; Nolan, Valenzuela, 2019). In particular, relatively low growth in inequality and concentration of wealth is recorded in continental Europe and China, while it is more rapid in the United States, the UK, and India2. Significant differences in inequality can be seen by region: in Europe, the income of the richest 10% is 36% of the entire population, in East Asia 43%, in Latin America 55%, and in the MENA states (Middle East and North Africa) it reaches 58%3. That is why the issue of inequality runs through all 17 Sustainable Development Goals for 20304, developed by the UN and approved by 193 countries. These goals are not only about reducing inequality within and between countries, but also about reducing differentiation of the population in access to vital benefits (health, education, environment, infrastructure) and ensuring equal opportunities for all citizens.
Inequality is a multidimensional phenomenon, combining different characteristics (inequality of income, property, opportunities, wealth, etc.), different levels (inequality in the upper, middle and lower part of the income distribution), different dimensions (objective and subjective indicators of inequality), different consequences for the individual, the public and the economic life of the country. Recognizing the impossibility of completely freeing ourselves from monetary and nonmonetary inequalities, it is important to understand their scale and legitimacy, as well as the way in which they are perceived by society. The latter aspect against the background of relatively stable indicators of inequality and a long period of economic and foreign policy shocks in the 2010s and early 2020s acquires particular importance. Subjective evaluation provides an operative picture of how the population assesses the depth and fairness of the differences between the rich and the poor, how great is the dislike between polar income groups, and how successfully the state (government) copes with the task of reducing the differentiation of the population.
In this connection the purpose of our research is to study the Russian population’s perception of the existing inequality and its manifestations in the country. To achieve the purpose we set and implemented the following tasks: we reviewed theoretical and methodological aspects of the study of subjective perception of inequality; we assessed the current situation in the field of population inequality, i.e. we analyzed the dynamics, scale and interregional differentiation of the actual level of monetary inequality in Russia in 2010– 2021; we revealed the features of subjective perception of monetary inequality in Russia, including in comparison with foreign countries, and in population groups with different socialdemographic and socio-economic characteristics.
The problematics of inequality: A brief review
In the most general form inequality should be considered as “a specific form of social differentiation, which predetermines the differences in living conditions of individuals ..., their unequal access to economic, social, political, informational and other resources, ... different opportunities to meet ... needs and interests” (Gorshkov, 2014, p. 20). There are many factors that cause the emergence of inequality, but the main cause and consequence of this process is the unequal and unfair distribution of resources. Therefore, “excessive” inequality is fraught with a variety of problems: “economic, because it forms a powerful pressure in favor of redistribution, thereby undermining economic growth; social, because it entails the deterioration of the social and psychological state of the population and destroys social cohesion; political, because it can generate social tensions, threaten democratic foundations and contribute to the formation of a request to change the social contract with the state” (Gimpelson, Monusova, 2014, p. 217; Mareeva, 2018, p. 104).
Foreign and domestic science actively discusses the scale, drivers and consequences of monetary and nonmonetary inequalities. Economists, sociologists and political scientists mainly rely on objective statistical indicators and methods of mathematical modeling, which allows them to assess the degree of acuteness of resource distribution between extreme income groups, predict the consequences of observed differentiation, identify factors and causes of increasing differences (Piketty, 2015; Stiglitz, 2015; Anikin, Tikhonova, 2016; Ovcharova et al, 2016; Kapelyushnikov, 2017; Rossoshanskii, 2019; Salmina, 2021; Chernysh, 2021; Novokmet et al., 2017).
A separate layer of research is devoted to the issues of subjective perception of inequality by the population (Salmina, 2007; Gimpelson, Monusova, 2014; Ovcharova et al. 2014; Mareeva, 2021; Mareeva et al., 2022). Among the works at the intersection of economics and sociology, the works of V.E. Gimpelson and S.V. Mareeva and their co-authors, who have been monitoring subjective perception of inequality in Russian society for many years, relying on international and national surveys (Gimpelson, Monusova, 2014; Mareeva et al., 2022), should be mentioned. They trace the dynamics of perceptions of inequality, identifying the grounds for differentiation of opinions, paying particular attention to the factor such as social mobility. In a recent paper the authors conclude that the perception of monetary and nonmonetary inequalities, and the demand for their reduction “are shaped more by normative perceptions of the “proper” structure of society and the assessment of its correspondence to observed reality than by the specifics of the individual situation, including expected or actual mobility” (Mareeva et al., 2022, p. 41).
Most authors agree that the population’s perceptions of the real inequality level and their position in the income hierarchy do not always coincide with statistically measured indicators (Gimpelson, Chernina, 2020, p. 34; Mareeva et al., 2022, p. 43; Knell, Stix, 2020). However, there have been proven links between “the population’s perceptions of relative well-being and life satisfaction” (Clark, d’Ambrosio, 2015), social trust (Barone, Mocetti, 2016; Hu, 2017), and protest activity (Diaz, 2017; Schoene, Allaway, 2019). According to conducted studies, the perception of income inequality as high is manifested in marked differences in life satisfaction between population groups with different income levels, and life satisfaction inequality itself has a significant negative impact on social trust (Graafland, Lous,
2019). Higher levels of income and wealth inequality correlate with lower levels of interpersonal trust and trust to political institutions, with weakened support for the institutional structure as a whole5 (Krieckhaus et al., 2014; Gould, Hijzen, 2016). As shown in (Goubin, Hooghe, 2020), the relationship between macro-level perceptions of inequality and public trust in state institutions also depends on people’s socio-economic status.
In view of the above, we can rightfully agree with the statement of some researchers that people’s perception of inequality is more important “for predicting the behavior of individuals than the actual indicators of inequality” (Gimpelson, Chernina, 2020, p. 31; Gimpelson, Treisman, 2018; Kuhn, 2015). “In modern Russia, mass reactions to social inequality come from the basic value and worldview positions of Russians, acquiring the character of dissatisfaction with socio-economic relations formed in the country during the years of reforms, including the distribution of property and income” (Gorshkov, 2020, p. 238). Therefore, according to some Russian scholars, the demand from the population “to reduce inequality is primarily related to the subjective assessment of inequality rather than its actual depth” (Mareeva et al., 2022, p. 43; Gimpelson, Treisman, 2018). Since for the Russian sociocultural model the key ideational basis is the concept of justice (Russian society ..., 2017, pp. 108, 143–144; Mareeva, 2015, pp. 110–111; Lapin et al., 2020, p. 8), then “Russians’ normative ideas about the principles of a just society related to certain inequalities” (Mareeva et al., 2022, p. 55) come to the fore. According to surveys of the Institute of Sociology FCTAS RAS, on the one hand, only about one-third of Russians call small differences in income as a necessary element of a just society, only 10% attribute a small share of the rich to such elements, which indicates “the population’s tolerance for income inequality as such if it occurs in conditions of equal opportunities – equal access to medicine, labor market, and education” (Mareeva et al., 2022, pp. 55–56). On the other hand, it is income differentiation and access to social services that Russians find most painful: thus, when assessing their position in a multidimensional social space, they often note that they personally suffer from income inequality (47% in 2013, 69% in 2018, 67% in 2020), inequality in access to medical care (38, 51 and 46% respectively) and good jobs (28, 38 and 38% respectively), housing inequality (28, 36 and 32% respectively) and inequality in opportunities for children from different social backgrounds (21, 19 and 26% respectively)6.
The given data “testifies that the current situation in Russian society does not meet the normative principles of justice in the perceptions of the population and does not provide the required equality of opportunities” (Mareeva et al., 2022, p. 55). “The perception of existing inequality in society and patterns of distribution of property rights as unfair can contribute to delegitimization in the eyes of the population of the entire institutional structure of society, opportunistic behavior in relation to the “unfair” system of established rules in society” (Mareeva, 2015, p. 110). Such situation actualizes the request to study the subjective perception of inequality in modern Russia, which for several years has been under uncertainty due to the consequences of decisions in foreign policy. At the same time, it is important not only to analyze the population’s opinion about inequality in terms of the scale, degree of justice and the role of the state, but also to assess the differentiation of the perception of inequality in different social (socioeconomic and socio-demographic) groups.
Research design and information base
Inequality as a socio-economic phenomenon is multifaceted and manifests itself not only in differentiation of income and/or wealth, but also in nonmonetary aspects in the form of unequal opportunities in access to socially important benefits and resources. In this study, speaking of inequality, we are referring primarily to its income (monetary) dimension, concerning the differences in the level of income received. At the same time, we expand the analysis by considering nonmonetary manifestations of inequality related to opportunities to ensure a higher level and quality of life, namely the payment for higher-quality educational and medical services.
During the work, we used a set of general and special methods of scientific knowledge in accordance with the tasks set and the available empirical material. In particular, we used general scientific methods – generalization, comparison, analysis and synthesis of scientific literature and open sources for the systematization of theoretical and methodological aspects of the study of subjective perception of inequality. To implement analytical tasks to identify trends in the actual level of inequality and features of its subjective perception of the population, we used methods of statistical and sociological analysis (dynamic analysis, calculation and analysis of differentiation indicators, descriptive analysis, analysis of multidimensional frequency distribution using combination tables).
In Russian and international practice a set of different indicators is used to measure the actual level of inequality, the basis of which are indicators of income differentiation and concentration (R/P 10% ratio, Gini coefficient, Theil index, Atkinson index, etc.) and indicators of income distribution (decile differentiation ratio, quintile ratio, Palm coefficient, etc.). Often the analysis is supplemented by volumetric indicators (level of per capita/median income, poverty level, etc.) and the calculation of indicators of interregional differentiation (range of variation, polar value gap coefficient, variation coefficient, dispersion, oscillation coefficient, etc.). In our work the estimation of the actual level of monetary inequality of the population was carried out according to such statistical indicators as average per capita income, decile coefficient, Gini coefficient.
Assessment of subjective perception of inequality was carried out according to the international methodology of The International Social Survey Programme (ISSP) on the module “Social Inequality”7. It includes the following indicators: the depth and fairness of inequality, the role of the state in reducing income disparities, the features of the redistribution system (the role of taxes), the availability of health care and education, the degree of conflict (dislike) between the poor and the rich. The measurement of the population’s perception is built on normative questions, which allow assessing the degree of agreement of the respondents with the statements about income differences, about the fairness of differences, etc. The data obtained are not a direct assessment of the respondent’s position in the income hierarchy, but they can be used as an indirect indicator of the actual distribution of income and wealth in society.
The empirical basis for the study is official statistical data from Rosstat and the Organization for Economic Cooperation and Development (OECD), and the results of the 2019 sociological survey in the countries participating in the International Social Survey Program (ISSP–2019) with the “Social Inequality” module. The available database includes 35127 individual observations from 22 countries8. For comparative analysis with Russia (1,567 observations) 16 states were chosen which differed most in the level of economic development, the specifics of the institutional structure, and the degree of actual inequality (according to the Gini coefficient): Bulgaria, the United Kingdom, Germany, Denmark, Israel, Italy, Lithuania, New Zealand, Slovenia, Finland, Croatia, the Czech Republic, Chile, Switzerland, South Africa, Japan9. As explanatory variables a number of socio-demographic and economic characteristics of individuals available in ISSP are used: gender, age, marital status (marriage status), presence of children, employment in the labor market, level of education, self-assessment of social status, territory of residence.
The main conclusions of the article are drawn as for 2019, the year of the ISSP international sociological survey. In accordance with this, and taking into account the availability of information in the databases of Rosstat and OECD, the analysis of objective indicators of inequality covers the period 2010–2019/2020.
Assessment of the actual level of monetary inequality
One of the indicators of inequality, widely used for international comparisons, is the Gini index (coefficient). It “characterizes the differentiation of population’s monetary income by measuring the degree of deviation of the actual distribution of income from their absolutely equal distribution” (Gorshkov, 2014, p. 23). Unlike other indicators (decile coefficient, Palm coefficient, Theil index, etc.) the Gini coefficient is “more sensitive to changes in the middle part of the distribution” (Salmina, 2021, p. 82; Gastwirth, 2017).
We emphasize that comparing countries by the Gini coefficient “is rather conditional, since country size, GDP, and population size significantly affect the level of inequality” (Rossoshanskii, 2019, p. 113), but it helps to get a general idea of the scale of inequality across countries of the world.
According to OECD data ( Tab. 1 ), among the examined states, the highest level of population inequality according to the Gini coefficient is annually observed in Russia (above 0.4). In other countries, the level of the index is noticeably lower; at the same time, in many of them the income differentiation is slightly increasing. Despite positive changes in Russia as a whole over the period under consideration, its level in recent years has been relatively stable and exceeds the “conventional mark” of excessive inequality of 0.40010.
In terms of Russian territories, the expected high degree of income differentiation is observed in more developed subjects, namely in exportresource regions and regions with developed industrial and trade-transport activity (Tyumen, Sakhalin, Sverdlovsk Oblasts, Chukotka Autonomous Okrug, Krasnodar Krai), and in the largest agglomerations (Moscow, Saint Petersburg; Tab. 2 ). The value of the index is a little lower in the regions with problems in terms of socioeconomic development. However, the values of the Gini coefficient in the majority of Russian regions are very close, which is confirmed by the calculated coefficients of variation and oscillation. In other words, Russian regions are quite homogeneous in terms of the Gini coefficient and the differences between them are not increasing.
Table 1. Gini coefficient worldwide*
Country 2010 2014 2015 2016 2017 2018 2019 Russia 0.421 0.415 0.412 0.412 0.411 0.414 0.412 Bulgaria 0.329 0.369 0.377 0.402 0.395 0.408 0.402 United Kingdom 0.351 0.356 0.360 0.351 0.357 0.366 0.366 Lithuania 0.329 0.380 0.372 0.378 0.374 0.361 0.357 Israel 0.371 0.360 0.346 0.344 0.348 0.342 no data Japan no data no data no data no data no data 0.334 no data Italy 0.327 0.326 0.333 0.327 0.334 0.330 no data New Zealand 0.335 0.341 0.325 0.333 0.335 0.330 0.326 Switzerland 0.298 0.297 0.296 0.302 0.299 0.311 0.316 Germany no data 0.289 0.293 0.294 0.289 0.289 no data Finland 0.264 0.257 0.260 0.259 0.266 0.269 no data Denmark no data 0.256 0.263 0.261 0.264 0.263 no data Slovenia 0.245 0.251 0.250 0.244 0.243 0.249 0.246 Czech Republic 0.260 0.257 0.258 0.253 0.249 0.249 0.248 Croatia no data no data no data no data no data no data no data Chile no data no data 0.454 no data 0.460 no data no data South Africa no data no data 0.626 no data 0.618 no data no data * Ranked by 2018. According to: Income inequality. Available at:
Table 2. Gini coefficient by Russian regions
|
Region* |
2010 |
2014 |
2015 |
2017 |
2018 |
2019 |
2020 |
Rank** |
|
Jewish Autonomous Oblast |
0.378 |
0.369 |
0.355 |
0.347 |
0.349 |
0.34 |
0.327 |
1 |
|
Republic of Ingushetia |
0.359 |
0.368 |
0.358 |
0.356 |
0.342 |
0.334 |
0.328 |
2 |
|
Kostroma Oblast |
0.365 |
0.358 |
0.35 |
0.353 |
0.338 |
0.338 |
0.329 |
3 |
|
Republic of Khakassia |
0.378 |
0.356 |
0.346 |
0.354 |
0.354 |
0.34 |
0.329 |
3 |
|
Vladimir Oblast |
0.366 |
0.36 |
0.355 |
0.349 |
0.344 |
0.34 |
0.332 |
5 |
|
Kirov Oblast |
0.366 |
0.366 |
0.349 |
0.343 |
0.34 |
0.34 |
0.332 |
5 |
|
Karachay-Cherkess Republic |
0.368 |
0.373 |
0.365 |
0.356 |
0.348 |
0.344 |
0.332 |
5 |
|
Republic of Crimea |
0.309 |
0.34 |
0.348 |
0.336 |
0.333 |
8 |
||
|
Novgorod Oblast |
0.403 |
0.389 |
0.378 |
0.36 |
0.349 |
0.343 |
0.334 |
9 |
|
Chelyabinsk Oblast |
0.4 |
0.382 |
0.368 |
0.352 |
0.355 |
0.348 |
0.334 |
9 |
|
Vologda Oblast |
0.373 |
0.365 |
0.361 |
0.35 |
0.354 |
0.356 |
0.357 |
43 |
|
Sverdlovsk Oblast |
0.432 |
0.422 |
0.41 |
0.405 |
0.403 |
0.405 |
0.394 |
73 |
|
Republic of Bashkortostan |
0.427 |
0.424 |
0.412 |
0.416 |
0.411 |
0.408 |
0.394 |
73 |
|
Zabaykalsky Krai |
0.401 |
0.398 |
0.395 |
0.397 |
0.406 |
0.406 |
0.397 |
75 |
|
Krasnodar Krai |
0.415 |
0.421 |
0.414 |
0.404 |
0.405 |
0.403 |
0.401 |
76 |
|
Saint Petersburg |
0.446 |
0.432 |
0.408 |
0.406 |
0.405 |
0.406 |
0.402 |
77 |
|
Sakhalin Oblast |
0.415 |
0.408 |
0.408 |
0.412 |
0.418 |
0.419 |
0.402 |
77 |
|
Republic of Adygea |
0.385 |
0.396 |
0.383 |
0.396 |
0.403 |
0.405 |
0.404 |
79 |
|
Chukotka Autonomous Okrug |
0.406 |
0.419 |
0.413 |
0.4 |
0.405 |
0.408 |
0.407 |
80 |
|
Moscow |
0.505 |
0.454 |
0.432 |
0.417 |
0.417 |
0.418 |
0.413 |
81 |
|
Tyumen Oblast |
0.446 |
0.437 |
0.431 |
0.426 |
0.432 |
0.431 |
0.426 |
82 |
|
FOR REFERENCE: Russian Federation |
0.421 |
0.415 |
0.412 |
0.411 |
0.414 |
0.412 |
0.406 |
– |
|
Variation coefficient, % |
6.410 |
5.443 |
6.413 |
5.627 |
5.983 |
6.411 |
6.355 |
– |
|
Oscillation coefficient |
0.377 |
0.271 |
0.345 |
0.242 |
0.252 |
0.262 |
0.273 |
– |
* The 10 regions with the best and worst values of the indicator, and the Vologda Oblast are indicated.
** Ranked by 2020 data.
According to: Russian Regions: Statistical Digest. Rosstat.
Similar patterns are fixed on another indicator of inequality – the decile coefficient, characterizing the difference in income of the richest 10% and the poorest 10% of the population ( Tab. 3 ). For Russia as a whole, it decreased from 16.6 to 14.9-fold during the analyzed period, which, however, is still above the “conventional mark” of normal inequality (6–8 times) (Lapin et al., 2020, pp. 11–12). In spite of a considerable gap between polar regions (about 2.5-fold in 2010–2015, and about 2-fold in 2016–2020), the calculated coefficient of variation
(below 30%) indicates the homogeneity of the population, while a decrease in the oscillation coefficient suggests that the coefficient value for more and more regions is close to the average and regional development converges.
According to established opinion, “Russia is characterized by a high level of regional inequality: the income of the residents of the richest constituent entity of the Russian Federation may exceed the same indicator in the poorest constituent entity by several times” (Gorshkov, 2016, p. 698).
Table 3. Decile coefficient by Russian regions
|
Region* |
2010 |
2014 |
2015 |
2017 |
2018 |
2019 |
2020 |
Rank** |
|
Kostroma Oblast |
11.1 |
10.6 |
10 |
10.2 |
9.2 |
9.2 |
8.6 |
1 |
|
Jewish Autonomous Oblast |
12.1 |
11.4 |
10.3 |
9.8 |
9.9 |
9.3 |
8.6 |
1 |
|
Republic of Ingushetia |
10.6 |
11.3 |
10.5 |
10.5 |
9.4 |
8.9 |
8.6 |
1 |
|
Republic of Khakassia |
12.2 |
10.5 |
9.7 |
10.3 |
10.3 |
9.3 |
8.7 |
4 |
|
Vladimir Oblast |
11.1 |
10.8 |
10.4 |
10 |
9.6 |
9.3 |
8.8 |
5 |
|
Karachay-Cherkess Republic |
11.4 |
11.7 |
11.1 |
10.4 |
9.8 |
9.6 |
8.8 |
5 |
|
Kirov Oblast |
11.2 |
11.2 |
9.9 |
9.5 |
9.3 |
9.3 |
8.8 |
5 |
|
Republic of Crimea |
7.5 |
94 |
9.8 |
9.1 |
8.9 |
8 |
||
|
Novgorod Oblast |
14.6 |
13.2 |
12.1 |
10.8 |
9.9 |
9.5 |
8.9 |
8 |
|
Chelyabinsk Oblast |
14.3 |
12.5 |
11.4 |
10.1 |
10.3 |
9.9 |
8.9 |
8 |
|
Vologda Oblast |
11.7 |
11.1 |
10.8 |
10.0 |
10.3 |
10.4 |
10.5 |
42 |
|
Republic of Bashkortostan |
17.4 |
16.9 |
15.6 |
16.0 |
15.5 |
15.0 |
13.7 |
73 |
|
Sverdlovsk Oblast |
18 |
16.7 |
15.3 |
14.8 |
14.6 |
14.8 |
13.7 |
73 |
|
Republic of Sakha (Yakutia) |
14.4 |
14.0 |
13.7 |
14.0 |
14.9 |
14.8 |
14.0 |
75 |
|
Krasnodar Krai |
15.9 |
16.6 |
15.8 |
14.7 |
14.8 |
14.6 |
14.3 |
76 |
|
Saint Petersburg |
20.0 |
18.0 |
15.1 |
14.8 |
14.8 |
14.9 |
14.4 |
77 |
|
Sakhalin Oblast |
15.8 |
15.1 |
15.1 |
15.5 |
16.3 |
16.3 |
14.5 |
78 |
|
Republic of Adygea |
12.8 |
13.8 |
12.6 |
13.8 |
14.6 |
14.8 |
14.6 |
79 |
|
Chukotka Autonomous Okrug |
14..8 |
16.3 |
15.7 |
14.2 |
14.8 |
15.1 |
15.0 |
80 |
|
Moscow |
28.3 |
21.2 |
18.1 |
16.1 |
16.2 |
16.2 |
15.6 |
81 |
|
Tyumen Oblast |
20 |
18.7 |
17.8 |
17.2 |
17.9 |
17.9 |
17.2 |
82 |
|
FOR REFERENCE: Russian Federation |
16.6 |
15.8 |
15.5 |
15.4 |
15.8 |
15.6 |
14.9 |
– |
|
Variation coefficient, % |
20.37 |
16.14 |
17.24 |
15.23 |
16.39 |
17.43 |
17.02 |
– |
|
Oscillation coefficient |
1.298 |
0.859 |
0.890 |
0.682 |
0.733 |
0.772 |
0.776 |
– |
* The 10 regions with the best and worst values of the indicator, and the Vologda Oblast are indicated.
** Ranked by 2020 data.
According to: Russian Regions: statistical digest, Rosstat.
As noted above, the dynamics of relative indicators of inequality demonstrates the desire to the regions’ equalization. As for changes in volumetric indicators characterizing the level of income (for example, average per capita cash income, Tab. 4), it is impossible to unequivocally judge about the positive dynamics in reducing the level of interregional polarization. Despite the reduction of the gap between polar regions over the analyzed period from 3.6 to 2.7-fold, the values of variation and oscillation coefficients fluctuate insignificantly, there is no convergence of regions. The leaders remain stably developed subjects with a rich exportresource, industrial and financial base, while the outsiders include subsidized subjects of the North Caucasian and Southern federal districts with a low level of socio-economic development.
Thus, inequality in Russia has a large scale and persists throughout the entire post-reform period of the country’s development without a pronounced focus on reducing the depth of polarization of the extreme income groups. It is worth noting
Table 4. Average per capita cash income of the population (including the cost of a fixed set of goods and services by region)*, rubles per month
|
Region** |
2010 |
2015 |
2017 |
2018 |
2019 |
2020 |
Rank*** |
Dynamics, 2020 to 2010, %**** |
|
Moscow |
31389.6 |
42098.8 |
45166.8 |
48348.0 |
52401.6 |
55214.8 |
1 |
-8.0 |
|
Chukotka Autonomous Okrug |
21499.7 |
40398.5 |
46600.1 |
46685.0 |
47966.6 |
53746.5 |
2 |
43.2 |
|
Magadan Oblast |
19504.9 |
34545.1 |
37940.7 |
42630.5 |
46624.0 |
51192.8 |
3 |
34.0 |
|
Sakhalin Oblast |
21461.7 |
37743.8 |
41527.8 |
45082.4 |
49089.0 |
50724.8 |
4 |
14.6 |
|
Tyumen Oblast |
23842.5 |
37044.2 |
39867.0 |
42204.2 |
44507.6 |
46212.0 |
5 |
1.6 |
|
Saint Petersburg |
23678.1 |
34788.8 |
38316.8 |
40753.7 |
43432.7 |
45527.0 |
6 |
5.5 |
|
Moscow Oblast |
20860.7 |
34946.5 |
37815.2 |
40291.1 |
42968.7 |
43121.9 |
7 |
9.3 |
|
Republic of Tatarstan |
21926.8 |
363807 |
37202.3 |
38673.5 |
41304.1 |
41248.5 |
8 |
11.9 |
|
Sverdlovsk Oblast |
22102.4 |
34922.7 |
35806.8 |
38289.8 |
41046.5 |
40030.4 |
9 |
-10.0 |
|
Murmansk Oblast |
18936.5 |
30337.8 |
32811.0 |
34971.6 |
37370.4 |
39755.1 |
10 |
5.6 |
|
Vologda Oblast |
13916.4 |
24564.6 |
25453.8 |
27099.2 |
29043.5 |
29768.5 |
46 |
15.0 |
|
Kabardino-Balkarian Republic |
13621.0 |
20414.1 |
21730.5 |
22335.5 |
23364.2 |
24216.5 |
73 |
1.2 |
|
Stavropol Krai |
12880.9 |
22216.9 |
23215.4 |
23844.9 |
24823.3 |
24209.4 |
74 |
1.1 |
|
Republic of Crimea |
0.0 |
17866.0 |
21496.5 |
22014.2 |
23648.3 |
24169.6 |
75 |
18.3 |
|
Mari El Republic |
12399.8 |
20860.6 |
21739.0 |
22023.1 |
23611.4 |
24069.1 |
76 |
11.3 |
|
Kurgan Oblast |
15217.3 |
21602.2 |
22184.8 |
21697.8 |
22999.5 |
23927.1 |
77 |
-15.5 |
|
Republic of Tuva |
10906.3 |
16979.3 |
16672.2 |
17304.8 |
18877.6 |
21464.4 |
78 |
-0.8 |
|
Altai Republic |
12996.3 |
16215.1 |
17356.2 |
18930.6 |
20012.5 |
21436.4 |
79 |
-7.4 |
|
Republic of Kalmykia |
8813.2 |
16706.4 |
17767.6 |
18397.6 |
19404.0 |
21006.1 |
80 |
32.8 |
|
Karachay-Cherkess Republic |
11825.9 |
18245.0 |
18573.1 |
19066.8 |
20322.2 |
20948.6 |
81 |
-5.1 |
|
Republic of Ingushetia |
11699.6 |
17726.4 |
18929.9 |
19524.1 |
19704.3 |
20156.2 |
82 |
1.6 |
|
FOR REFERENCE: Russian Federation |
18958 |
30254 |
31897 |
33266 |
35338 |
36073 |
– |
– |
|
Variation coefficient, % |
21.0 |
20.0 |
20.8 |
22.0 |
22.1 |
22.6 |
– |
– |
|
Oscillation coefficient |
1.39 |
0.98 |
1.08 |
1.08 |
1.09 |
1.11 |
– |
– |
Calculation based on: Russian Regions: statistical digest, Rosstat . |
||||||||
that we analyzed the official statistical data based on sample surveys. According to some scholars (Salmina, 2021; Novokmet et al., 2017), the Rosstat assessments underestimate the scale of inequality, while the application of econometric methods and the re-estimation of income by wealth with tax or expenditure data provide more accurate information about inequality. Ultimately, however, the estimation methods used do not affect the conclusion that there is a high level of inequality in Russia compared to many developed and developing foreign countries.
Assessment of the subjective perception of inequality by the population
Before analyzing subjective perceptions of inequality in Russia, let us look at the correlation between people’s perceptions of the depth of income differences between the poor and the rich in countries with different levels of observed inequality (according to the Gini coefficient). Figure 1 shows the countries arranged in the space of two axes: the actual level of inequality (X axis) and the share of the population absolutely agreeing that income inequality is high (Y axis) (Gimpelson, Monusova, 2014, p. 219). According to the graph, the distribution does not have a clearly expressed trend. Among the countries with high inequality there are those where a large part of the population assesses it as excessively large (Russia, Bulgaria, Israel), and those where the population is not so categorical (UK, New Zealand, Lithuania). Similarly, in the group of states with low levels of actual inequality, its perception is heterogeneous.
Such a conclusion is quite expected because “there are a number of good reasons (both economic and socio-ethical) why a straightforward relationship is far from being guaranteed” (Gimpelson, Monusova, 2014, p. 221). The perception of inequality is based not so much on the income level of different population groups, as on the opportunities that people have in the country, on the level of fairness of the social structure, the degree of accessibility of life-forming goods of high quality, etc.
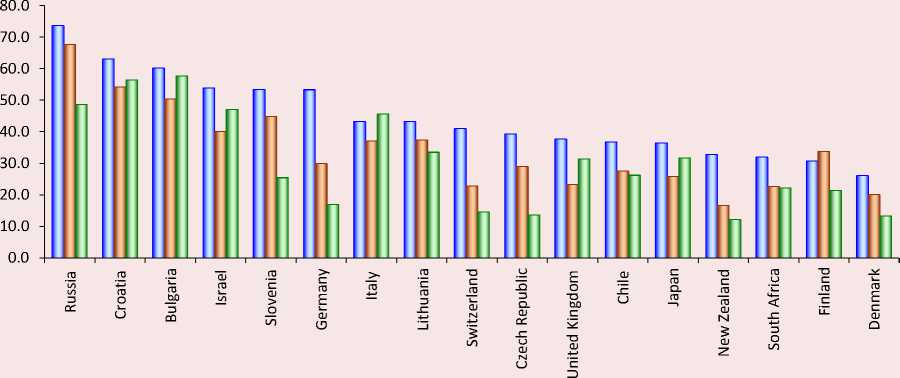
The data of the international ISSP-2019 survey show that the Russian population shows the most critical assessments of such aspects of perception as the scale (depth) of inequality and the role of the state in solving the problem of reducing income disparities ( Fig. 2 ). Nearly three-quarters of Russians (73%) fully agree that the income disparity between the rich and poor in the country is too great. Similar estimates are recorded in Croatia (63%) and Bulgaria (60%), while in other countries the
Figure 1. Perceptions of the depth of inequality and the level of actual inequality worldwide, 2018
80.0

70.0
60.0
50.0
40.0
Slovenia
Czech Republic
Russia
Bulgaria
Germany
• Italy Switzerland
Israel
Japan
Lithuania
United Kingdom
New Zealand
30.0
20.0
0.200
Finland
Denmark
0.300
0.400
Gini coefficient
Calculation based on: Income inequality. Available at: ; ISSP-2019.
Figure 2. Perception of income disparities and the role of the state in reducing them worldwide, % of respondents
□ Income disparities in the country are too great (completely agree)
-
□ The state should reduce income disparities between the poor and the rich (totally agree)
-
□ The state (government) has been totally failing at reducing income disparities (totally agree)
Calculation based on: ISSP-2019.
proportion of the population with such a categorical attitude is much lower (Germany, Slovenia, Israel – 53%, Chile – 37%, Denmark – 26%).
Also, the majority of Russians (68%) are absolutely convinced that it is the state that should be the leading actor in the fight against inequality and make efforts to reduce it. In other countries this position is shared by a much smaller share of the population, although by the total sum of responses (absolutely agree and rather agree) the residents of the countries under consideration are in solidarity in their request for the state to reduce income inequality. The Russians’ assessment of the actual actions of the state is quite critical: nearly half (48%) believe that the state is failing in this task. Even higher shares of those dissatisfied with government actions to reduce inequality are found in Croatia (56%) and Bulgaria (58%).
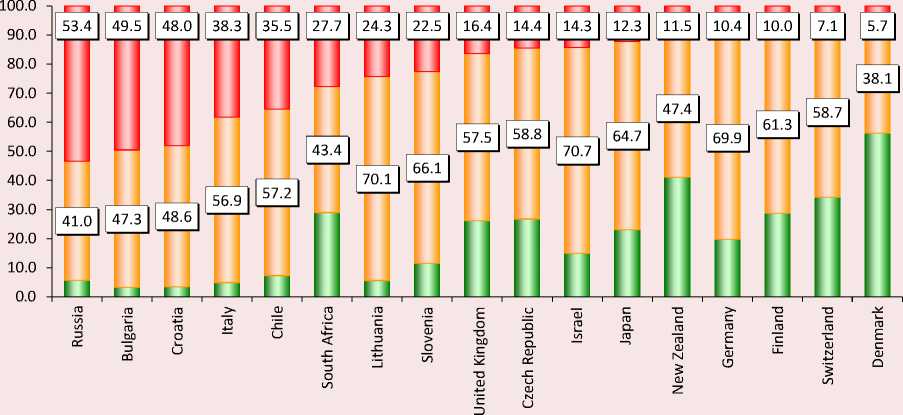
The Russian population perceives the existing income inequality not only as significant, but also as unfair – the share of those who rather and completely agree with it is 94% ( Fig. 3 ). It is noteworthy that residents of most other countries under consideration (with the exception of Denmark, Switzerland, Finland, New Zealand, and South Africa) are in solidarity with Russians on this issue. It can be assumed that the demand for a fair social order, a fair distribution of opportunities to access various benefits regardless of income levels is extremely relevant in the public consciousness in many countries of the world.
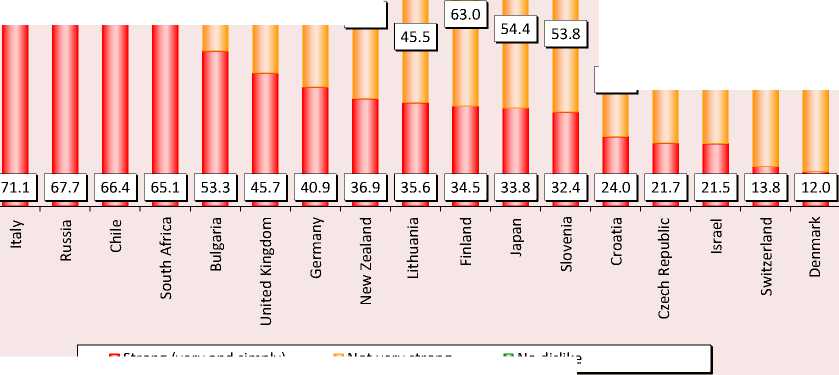
The data on the perception of the conflict between rich and poor should be regarded as an alarming social signal for Russia ( Fig. 4 ). Almost 70% of Russians are very keen on this conflict and believe that there is not just a difference in interests
Figure 3. People’s perceptions of the fairness of the existing distribution of income worldwide, % of respondents
□ Very unfair
I □ Fair enough (very and rather) Rather unfair
Calculation based on: ISSP-2019.
Figure 4. Estimation of the degree of dislike between the poor and the rich worldwide, % of respondents
100.0
90.0
80.0
70.0
60.0
50.0
40.0
30.0
20.0
10.0
0.0
38.9 51.2 53.1 69.8 70.8
6.5 5.7 9.3 13.0 15.2 5.1 4.2 5.5 18.9 2.6 11.8 13.9 37.1 27.1 25.3 16.4 17.2
22.4 26.6 24.3 21.8
31.5 49.2 55.0 57.6
□ Strong (very and simply) □ Not very strong □ No dislike
Calculation based on: ISSP-2019.
between the polar groups, but quite a strong dislike. This situation is also true for Italy, Chile, and South Africa, while in other countries social tensions between the poor and the rich are not so pronounced.
One of the instruments of public policy to reduce income inequality is the tax system. Despite the very tolerant attitude of the population of many countries to income disparities and government actions to reduce them, a significant share of citizens agrees that rich people should pay a much larger share of their income as taxes than the poor population ( Tab. 5 ). It should be noted that this pattern emerges regardless of whether the country has a progressive tax scale. In Russia, an overwhelming majority also supports a progressive scale, with many Russians rating the current taxes for the rich as too low (almost 70%) and advocating a significant difference in the level of interest paid on income (61%).
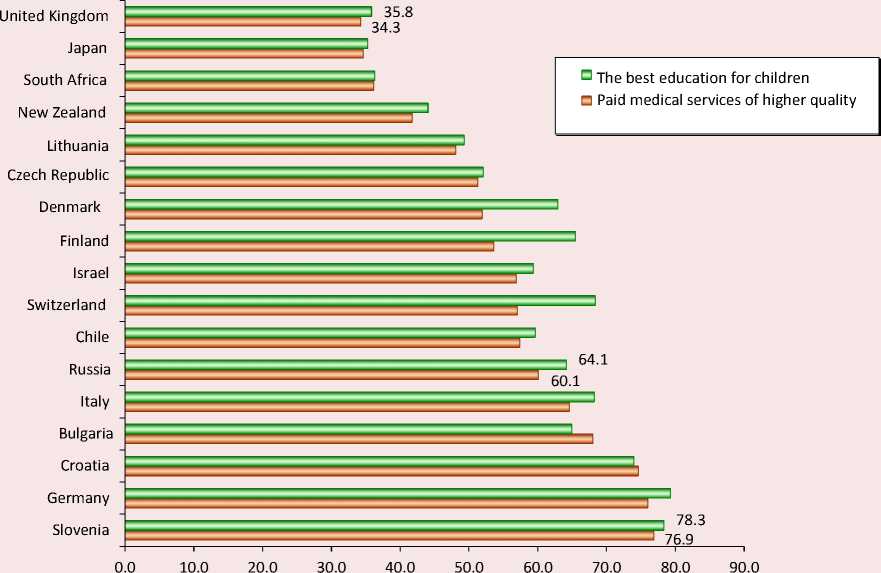
An important nonmonetary manifestation of inequality is the ability to access quality social services, primarily to education and health care, because they are directly related to human capital, they form the basis for social mobility, and determine the possibility of achieving a high level and quality of life. The position of the citizens of the United Kingdom, Japan, South Africa, and New Zealand looks very tolerant. At the same time, the population of Russia, like in many other countries, does not demonstrate high tolerance for the opportunities of wealthy people to acquire medical and educational services of better quality – more than 60% consider such manifestations of differentiation unfair ( Fig. 5 ). Such a position is more characteristic of the elderly (64% for medical services and 70% for education vs 58–62% in other age groups), the temporarily unemployed (65% for medical services and 68% for education vs 58 and 62% among the employed), and people who live in rural areas.
Table 5. Opinion of the population on the tax system, % of respondents*
|
Country** |
The amount of percentage of income that people with high incomes have to pay as taxes |
Assessment of current taxes for people with high incomes |
|||
|
Larger (significantly and somewhat) |
The same percentage as low-income people |
Smaller (significantly and somewhat) |
Low taxes |
Low + too low |
|
|
Japan |
90.2 |
8.5 |
1.3 |
41.9 |
57.1 |
|
Russia |
84.6 |
12.9 |
2.5 |
36.7 |
69.9 |
|
Germany |
83.5 |
15.8 |
0.7 |
43.5 |
53.5 |
|
Bulgaria |
83.3 |
11.6 |
5.2 |
41.8 |
53.9 |
|
Italy |
82.6 |
16.1 |
1.4 |
13.4 |
18.2 |
|
Switzerland |
82.1 |
16.6 |
1.2 |
44.7 |
57.0 |
|
Finland |
82.1 |
16.5 |
1.4 |
34.9 |
46.4 |
|
Slovenia |
81.7 |
16.5 |
1.8 |
50.4 |
60.6 |
|
United Kingdom |
77.6 |
20.8 |
1.6 |
32.7 |
40.0 |
|
Croatia |
74.6 |
23.4 |
2.1 |
44.3 |
61.6 |
|
Lithuania |
73.6 |
21.7 |
4.7 |
45.5 |
63.9 |
|
Israel |
71.5 |
24.5 |
4.0 |
284 |
30.4 |
|
New Zealand |
70.9 |
27.8 |
1.4 |
29.6 |
36.9 |
|
Chile |
69.9 |
24.0 |
6.1 |
39.7 |
53.6 |
|
Denmark |
64.4 |
33.0 |
2.7 |
31.5 |
35.3 |
|
South Africa |
58.6 |
34.8 |
6.6 |
8.9 |
11.1 |
|
Czech Republic |
55.7 |
40.1 |
4.2 |
35.3 |
42.6 |
* Ranked by the proportion who think the rich should pay a higher percentage.
** Countries with a progressive taxation scale for individuals are in italics. According to: ISSP-2019.
Figure 5. Assessment of fairness of differences in social benefits between the poor and the rich (options “rather unfair” + “completely unfair”) worldwide, % of respondents
Calculation based on: ISSP-2019.
An analysis of the perception of inequality in the context of population groups gives interesting results. According to studies by leading specialists in sociology, modern Russian society has formed “... at least 10–12 social strata, each... with its own values and interests, income and property characteristics, way and style of life,... with its life goal-setting,... its principles of morality, its principles of political norms...”11. The assessment of the existing income inequality in Russia as too deep and unfair, and the assessment of the acuteness of the conflict between the polar groups and the unsuccessful actions of the state in overcoming existing income disparities are typical for all sociodemographic and socioeconomic groups without exception (Tab. 6). The opinions of Russians differ only in the degree of expression. The assessments of the employed and temporarily unemployed are slightly more critical than those of citizens who have never worked. The most prosperous groups (people with a high level of education and those who belong to the upper stratum) perceive the income gap and social tension between the poor and the rich more acutely. It is noteworthy that despite the availability of better social services and diverse cultural and social life in cities, assessments of those living in urban and rural areas are identical.
Table 6. Perception of inequality in groups with different demographic and socio-economic characteristics in Russia, % of respondents*
|
Characteristics |
Share of agreement with the statement (strongly agree + rather agree) |
|||
|
Income disparities in the country are too great |
The existing distribution of income in Russia is unfair |
The dislike between the poor and the rich is great |
The state (government) is failing (completely + rather) to reduce income disparities |
|
|
Sex |
||||
|
Men |
91.5 |
92.4 |
68.4 |
83.8 |
|
Women |
91.7 |
96.0 |
67.1 |
80.8 |
|
Age |
||||
|
Under 30 |
89.3 |
91.0 |
67.9 |
73.4 |
|
From 30 to 55(60) |
92.1 |
94.4 |
67.3 |
83.2 |
|
Older than 55(60) |
92.4 |
96.6 |
68.2 |
86.1 |
|
Marital status |
||||
|
Married |
93.3 |
95.0 |
66.2 |
83.3 |
|
Living apart |
83.3 |
100.0 |
66.7 |
33.3 |
|
Divorced |
90.1 |
95.8 |
72.2 |
85.1 |
|
Widower (widow) |
89.7 |
98.8 |
65.5 |
87.6 |
|
Single, never been married |
89.8 |
90.4 |
69.7 |
76.4 |
|
Presence of children |
||||
|
No children |
92.6 |
94.2 |
69.5 |
83.6 |
|
Have children |
90.0 |
94.7 |
64.6 |
79.6 |
|
Work |
||||
|
Have a paid job at the moment |
92.3 |
94.3 |
69.8 |
82.8 |
|
Had in a paid job in the past, but not working now |
90.6 |
95.0 |
65.3 |
83.5 |
|
Never had a paid job |
91.5 |
89.9 |
58.0 |
67.1 |
|
Education |
||||
|
General secondary or lower |
90.4 |
92.7 |
62.8 |
81.4 |
|
Specialized secondary, incomplete higher |
90.5 |
95.4 |
67.9 |
82.4 |
|
Higher |
94.9 |
94.6 |
71.6 |
82.6 |
|
Second higher, degree in science |
91.5 |
91.5 |
73.9 |
81.3 |
|
Social status (self-assessment) |
||||
|
The lowest layer |
95.1 |
98.0 |
81.4 |
86.4 |
|
Workers |
92.3 |
95.7 |
67.4 |
82.3 |
|
Upper part of the workers layer/bottom part of the middle layer |
91.3 |
94.1 |
77.8 |
84.2 |
|
Middle layer |
90.6 |
92.8 |
62.3 |
80.8 |
|
Top of the middle layer |
89.3 |
92.9 |
67.9 |
74.1 |
|
The highest layer |
100.0 |
75.0 |
100.0 |
75,0 |
|
Territory of residence |
||||
|
City and suburbs |
92.0 |
94.1 |
66.5 |
81.4 |
|
A small town, an urban settlement |
89.5 |
94.3 |
72.8 |
83.1 |
|
The village and smaller |
93.0 |
95.2 |
64.9 |
82.8 |
|
According to: ISSP-2019. |
||||
Moreover, a comparison of the results of several waves of ISSP conducted by S.V. Mareeva, E.D. Slobodenyuk and V.A. Anikin ( Fig. 6 ) showed that “the perception of inequality and the intensity of the request for redistribution in Russia remain similar to the situation of twenty years ago” (Mareeva et al., 2022, p. 45). In other words, despite various initiatives and programs to strengthen the state’s social obligations and expand social support for certain population groups, the implementation of measures to consolidate Russian society using traditional spiritual and moral values and the values of the social state, and even changes in the socio-economic context in post-reform Russia, no radical transformation of the population’s subjective perception of the problem of monetary and nonmonetary inequalities has occurred.
In this context, it is understandable that the overwhelming majority of Russians (67%) do not agree with the statement that large income disparities are necessary for the country’s prosperity.
This view is shared to a greater extent by those respondents who believe that existing income disparities are high (69%) and unfair (69%) than by those for whom such disparities are small (48%) and not so unfair (45%). Russians are even more critical of the statement that inequality exists because it benefits the rich and those in power (82% of those who agree). Moreover, the population that assesses income distribution as unfair is virtually unequivocal in its opinion (84% of those who agree vs. 50% of those who think the distribution is fair).
Addressing the question about the grounds for success in life showed that a good education and hard work are seen as necessary components of success regardless of the perception of the depth and fairness of inequality ( Tab. 7 ). A certain differentiation of opinions is traced on such parameters as origin from a rich family and necessary connections – the population, more categorical in their perception of inequality, considers them very important in order to succeed in life.
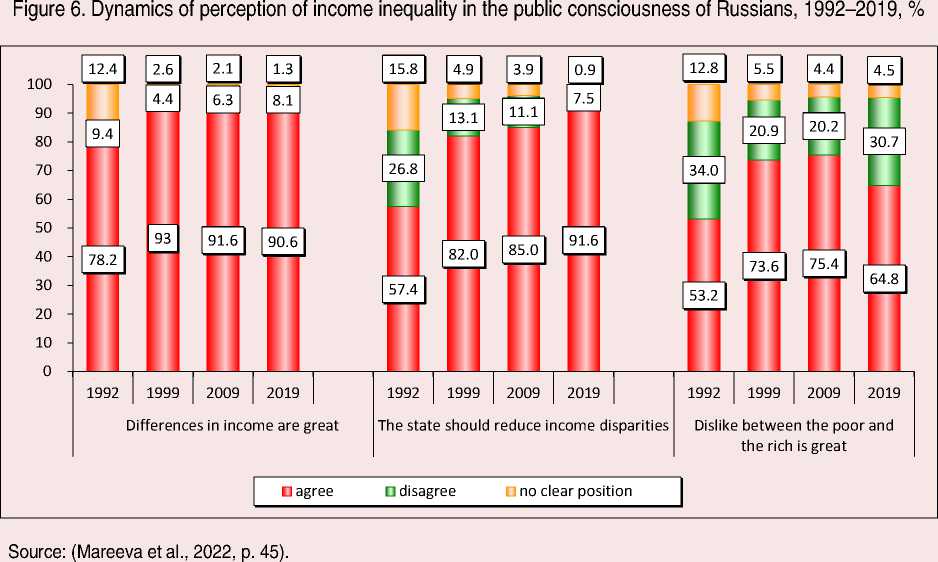
Table 7. Basis for success in groups with different degrees of assessment of the depth and fairness of inequality in Russia, % of respondents*
|
How important it is to succeed in life |
Income differences between rich and poor are large |
Fairness in income distribution |
||||
|
Agreed (completely + rather) |
Both agree and disagree |
Disagree (completely + rather) |
Fair (very + rather) |
Unfair (very + rather) |
||
|
| Е Е | ° 5 |
important (extremely + very) |
37.8 |
19.1 |
31.3 |
20.2 |
37.9 |
|
quite important |
25.2 |
29.8 |
15.0 |
22.6 |
25.1 |
|
|
not important (not very + completely) |
37.0 |
51.1 |
53.8 |
57.1 |
37.1 |
|
|
important (extremely + very) |
67.1 |
57.4 |
67.1 |
63.2 |
66.6 |
|
|
quite important |
21.1 |
36.2 |
17.6 |
20.7 |
21.8 |
|
|
not important (not very + completely) |
11.8 |
6.4 |
15.3 |
16.1 |
11.6 |
|
|
important (extremely + very) |
72.1 |
66.0 |
72.9 |
73.3 |
71.4 |
|
|
quite important |
17.7 |
29.8 |
20.0 |
19.8 |
18.5 |
|
|
not important (not very + completely) |
10.2 |
4.3 |
7.1 |
7.0 |
10.1 |
|
|
important (extremely + very) |
62.3 |
42.6 |
61.2 |
47.1 |
61.9 |
|
|
quite important |
25.9 |
25.5 |
12.9 |
29.9 |
25.3 |
|
|
not important (not very + completely) |
11.7 |
31.9 |
25.9 |
23.0 |
12.8 |
|
|
*The differences are highlighted. According to: ISSP-2019. |
||||||
Thus, the Russian population’s perception of inequality differs from that of other countries’ residents in a more pronounced critical assessment of the depth, unfairness, social conflict, and government actions for reducing disparities. At the same time, there are no significant differences in the perception of inequality in different sociodemographic and socio-economic groups, none of the groups stands out with greater tolerance or criticality.
Discussion
Inequality in monetary and nonmonetary dimensions is a serious challenge for the state, since the population views the actual extent and depth of differentiation as a result of government action. In this context, when the state fails to ensure a relatively equal distribution of resources, equitable access to vital services, and the consistent implementation of its proclaimed goals of living standards and quality of life, trust in state institutions is naturally reduced, and the probability of protest activity in society grows stronger. In Russia, the first part of this equation is already forming, in particular there is “stalling of the implementation of publicly declared goals of national development” (Ilyin, Morev, 2022, p. 11), “long-standing unresolved issues... of a fairer distribution of national welfare” (Ilyin, Morev, 2020, p. 16, 29). This leads to “people’s fatigue with the next positive goals of socio-economic development, which have not been fulfilled for the first time” (Ilyin, Morev, 2020, p. 10) and “creates risks for the legitimacy of the current authorities of all levels (including the Russian President) in assessments of public opinion” (Ilyin, Morev, 2022, p. 11). According to the results of all-Russian sociological surveys, a “slow, but fairly stable dynamics of growth in the number of Russians who negatively comment on the president’s activity” is forming – according to VCIOM surveys “in comparison with the third presidential term (2012–2017), the level of approval of V. Putin has decreased in the country in 2019– 2020 from 77 to 60–64%” (Ilyin, Morev, 2020, pp. 27–28).
Under certain circumstances, the social risks associated with inequality, in the fact that inequality “... creates a climate of confrontation, ... exacerbates the polarization of society, generates apathy and passivity of certain segments of the population, and encourages the bearers of radical mindsets to illegitimate forms of protest and political extremism” (Gorshkov, 2014, p. 29), can move from potential to real. Therefore, considering that the impact of inequality on interpersonal and institutional trust is weaker in the presence of strong welfare and redistributive policies (Kumlin, Haugsgjerd, 2017), effective and strong public policies are needed to mitigate the socio-economic and political consequences of inequality and improve living standards and quality of life in the context of building a welfare state in Russia.
Conclusion
The problem of inequality has always been a burning issue for Russian society in terms not only of the objective depth of differences, but also of its perception by the population. The restructuring of Russia’s socio-economic and socio-political structure over the past three decades has only partly contributed to the reduction of monetary and nonmonetary inequalities and in some ways transformed their content (poverty has decreased, income and middle class have increased, consumption patterns have changed).
The conducted research allowed us to draw a number of conclusions comparable with the results presented in previously published domestic and foreign works. In turn, it contributes to the understanding of cross-country and cross-group features of the population’s perception of monetary inequality and its nonmonetary manifestations, which constitutes its scientific novelty.
The assessment of the current situation with regard to the monetary inequality of Russia’s population in 2010–2021 shows that its level remains excessive. In particular, the value of the Gini coefficient steadily exceeds the mark of 0.400 and is expected to be higher in regions with trade and transport and export-resource specialization (Tyumen, Sakhalin, Sverdlovsk Oblasts, Chukotka Autonomous Okrug, Krasnodar Krai) and in major agglomerations (Moscow, Saint Petersburg). The decile coefficient varies around the mark of 15 times, but in more than half of the subjects does not exceed the mark of 12 times. Average income per capita in many regions shows positive dynamics, the gap between polar regions is reducing (from 3.6 to 2.9-fold), while in most subjects the value of the indicator remains below the average Russian level, especially in subsidized territories of the North Caucasian, Southern and Siberian federal districts. The calculated indicators of interregional differentiation (coefficients of variation and oscillation) indicate a high homogeneity of Russian regions by the analyzed indicators of monetary inequality.
According to the results of the analysis of subjective perception, it was determined that the majority of Russians consider income inequality to be excessively high and unfair, quite acutely assessing the conflict (degree of dislike) between the rich and the poor. The Russian population does not show tolerance to nonmonetary dimensions of inequality, considering unfair the opportunity of rich people to purchase medical and educational services of higher quality. Russia is a leader in these aspects against the background of other countries. Russians place the main responsibility for reducing income disparities on the state, but assess its activities in this direction as unsuccessful. Compared to citizens of other countries, Russians’ assessments are more categorical. Subjective perceptions of the scale and fairness of inequality and the role of the state in reducing it are shared by the entire population and are virtually identical for groups with different socio-demographic and socioeconomic characteristics.
The article contributes to the development of applied science, it clearly demonstrates the possibilities of long-term sociological research (monitoring) on key social problems, allowing us to identify the distinctive features of a particular period of functioning of the state and characteristic for this period of life practices, attitudes and subjective perceptions.
The identified trends in cross-country and cross-group perceptions of inequality will allow authorities, social institutions, and the nonprofit sector to adjust their activities in reducing differentiation and improving the level and quality of life of the population.
It is planned to focus further research on the degree of influence of various factors on the formation of interregional differentiation of inequality of the country’s population, on the development of a classification of Russian regions by the level of monetary and nonmonetary inequality to identify homogeneous groups of regions and substantiate directions and tools for smoothing inequality in these groups.
References The scale of inequality and the specifics of its perception in modern Russia
- Alvaredo F., Chancel L., Piketty T. et al. (2017). Global inequality dynamics: New findings from WID.world. American Economic Review, 107(5), 404–409. DOI: 10.1257/aer.p20171095
- Anikin V.A., Tikhonova N.E. (2016). Poverty and inequalities in BRICS: Notes on Russia. Obshchestvo i ekonomika=Society and Economy, 1, 78–144 (in Russian).
- Barone G., Mocetti S. (2016). Inequality and trust: New evidence from panel data. Economic Inquiry, 54(2), 794–809. DOI: 10.1111/ecin.12309
- Chernysh M.F. (2021). The institutional foundations of inequality in modern society. Mir Rossii=Universe of Russia, 30(3), 6–28. DOI: 10.17323/1811-038X-2021-30-3-6-28 (in Russian).
- Clark A.E., d’Ambrosio C. (2015). Attitudes to income inequality: Experimental and survey evidence. Handbook of Income Distribution, 2, 1147–1208. DOI: 10.1016/B978-0-444-59428-0.00014-X
- Díaz F.A. (2017). Inequality, social protests and civil war. Oasis, 26, 25–39. DOI:10.18601/16577558.n26.03
- Gastwirth J. (2017). Is the Gini index of inequality overly sensitive to changes in the middle of the income distribution? Statistics and Public Policy, 4(1), 1–11. DOI: 10.1080/2330443X.2017.1360813
- Gimpelson V., Treisman D. (2018). Misperceiving inequality. Economics & Politics, 30(1), 27–54. DOI: 10.1111/ecpo.12103 (in Russian).
- Gimpelson V.E., Chernina E.M. (2020). How we perceive our place in income distribution and how the perceptions deviate from reality. Zhurnal Novoi ekonomicheskoi assotsiatsii=The Journal of the New Economic Association, 46(2), 30–56. DOI: 10.31737/2221-2264-2020-46-2-2 (in Russian).
- Gimpelson V.E., Monusova G.A. (2014). Perception of inequality and social mobility. Ekonomicheskii zhurnal Vysshei shkoly ekonomiki=The HSE Economic Journal, 18, (2), 216–248 (in Russian).
- Gorshkov M.K. (2014). Social inequalities as an object of sociological analysis. Sotsiologicheskie issledovaniya=Sociological Studies, 7(363), 20–31 (in Russian).
- Gorshkov M.K. (2016). Social inequalities in post-reform Russia: A sociological diagnosis. Vestnik RUDN. Seriya: Sotsiologiya=RUDN Journal of Sociology, 16(4), 693–718 (in Russian).
- Gorshkov M.K. (2020). Russian society in measurement. Vestnik Rossijskoj akademii nauk=Herald of the Russian academy of sciences, 90(3), 232–242. DOI: 10.31857/S0869587320030068 (in Russian).
- Gorshkov M.K., Petukhov V.V. (Eds.). (2017). Rossiiskoe obshchestvo i vyzovy vremeni. Kniga pyataya [Russian Society and the Challenges of Time. Book Five]. Moscow: Ves’ Mir.
- Goubin S., Hooghe M. (2020). The effect of inequality on the relation between socioeconomic stratification and political trust in Europe. Social Justice Research, 33, 219–247. DOI:10.1007/s11211-020-00350-z
- Gould E.D., Hijzen A. (2016). Growing apart, losing trust? The impact of inequality on social capital. IMF Working Papers, 16/176. DOI: 10.5089/9781475529487.001
- Graafland J., Lous B. (2019). Income inequality, life satisfaction inequality and trust: A cross country panel analysis. Journal of Happiness Studies, 20, 1717–1737. DOI: 10.1007/s10902-018-0021-0
- Hu A. (2017). On the relationship between subjective inequality and generalized trust. Research in Social Stratification and Mobility, 49, 11–19. DOI: 10.1016/j.rssm.2017.03.003
- Ilyin V.A., Morev M.V. (2020). Vote of confidence for the President is confirmed. Achievement of socio-economic development goals before 2024-2030 is uncertain. Ekonomicheskie i sotsial’nye peremeny: fakty, tendentsii, prognoz=Economic and Social Changes: Facts, Trends, Forecast, 13(4), 9–37. DOI: 10.15838/esc.2020.4.70.1 (in Russian).
- Ilyin V.A., Morev M.V. (2021). Trends in public opinion regarding the effectiveness of public administration. Presidential cycles 2000–2021. Ekonomicheskie i sotsial’nye peremeny: fakty, tendentsii, prognoz=Economic and Social Changes: Facts, Trends, Forecast, 14(6), 9–32. DOI: 10.15838/esc.2021.6.78.1 (in Russian).
- Ilyin V.A., Morev M.V. (2022). Nationwide poverty — “a threat to steady development and our demographic future”. Ekonomicheskie i sotsial’nye peremeny: fakty, tendentsii, prognoz=Economic and Social Changes: Facts, Trends, Forecast, 15(1), 9–33. DOI: 10.15838/esc.2022.1.79.1 (in Russian).
- Kapelyushnikov R.I. (2017). Inequality: How not to primitivize the problem. Voprosy ekonomiki=Economic Issues, 4, 117–139 (in Russian).
- Knell M., Stix H. (2020). Perceptions of inequality. European Journal of Political Economy, 65. DOI: 10.1016/j.ejpoleco.2020.101927
- Krieckhaus J., Son B., Bellinger N., Wells J. (2014). Economic inequality and democratic support. The Journal of Politics, 76(1), 139–151. DOI: 10.1017/s0022381613001229
- Kuhn A. (2015). The individual perception of wage inequality: A measurement framework and some empirical evidence. IZA Discussion Paper, 9579.
- Kumlin S., Haugsgjerd A. (2017). The welfare state and political trust: Bringing performance back. In: Zmerli S., van der Meer T.W.G. (Eds.). Handbook on Political Trust. Cheltenham: Edward Elgar Publishing.
- Lapin N.I., Ilyin V.A., Morev M.V. (2020). Extremal inequalities and the social state (part 1). Sotsiologicheskie issledovaniya=Sociological Studies, 1, 4–17. DOI: 10.31857/S013216250008378-8 (in Russian).
- Mareeva S.V. (2015). Social justice and inequalities in views of Russians. Journal of Institutional Studies, 7(2), 109–119. DOI: 10.17835/2076-6297.2015.7.2.109-119 (in Russian).
- Mareeva S.V. (2018). Social inequities and the social structure of modern Russia as perceived by the population. Vestnik Instituta sotsiologii=The Bulletin of the Institute of Sociology, 9(3), 101–120. DOI: 10.19181/vis.2018.26.3.527 (in Russian).
- Mareeva S.V. (2021). Middle-class perceptions of inequality compared to other Russians: Consensus or disagreement? Sotsiologicheskie issledovaniya=Sociological Studies, 1, 38–50. DOI: 10.31857/5013216250012166-5 (in Russian).
- Mareeva S.V., Slobodenyuk E.D., Anikin V.A. (2022). Public tolerance for social inequalities in turbulent Russia: Reassessing the role of subjective mobility. Monitoring obshchestvennogo mneniya: ekonomicheskie i sotsial’nye peremeny=Monitoring of Public Opinion: Economic and Social Changes, 1, 39–60. DOI: 10.14515/monitoring.2022.1.1982 (in Russian).
- Nolan B., Valenzuela L. (2019). Inequality and its discontents. Oxford Review of Economic Policy, 35(3), 396–430. DOI: 10.1093/oxrep/grz016
- Novokmet P., Piketty T., Zucman G. (2017). From soviets to oligarchs: Inequality and property in Russia, 1905–2016. NBER Working Paper No. 23712. Cambridge, MA: National Bureau of Economic Research. DOI: 10.3386/w23712
- Ovcharova L.N., Burdyak A.Ya., Pishnyak A.I et al. (2014). Dinamika monetarnykh i nemonetarnykh kharakteristik urovnya zhizni rossiiskikh domokhozyaistv za gody postsovetskogo razvitiya: analiticheskii doklad [Dynamics of Monetary and Nonmonetary Characteristics of Living Standards of Russian Households over the Years of Post-Soviet Development: Analytical Report.]. Moscow: Fond “Liberalnaya missiya”.
- Ovcharova L.N., Popova D.O., Rudberg A.M. (2016). Decomposition of income inequality in contemporary Russia. Zhurnal Novoi ekonomicheskoi assotsiatsii=The Journal of the New Economic Association, 31(3), 170–185 (in Russian).
- Piketty T. (2015). Kapital v XXI veke [Le Capital au XXIᵉ siècle]. Moscow: Ad Marginem.
- Piketty T., Saez E. (2014). Inequality in the long run. Science, 344(6186), 838–843. DOI: 10.1126/наука.1251936
- Rossoshanskii A.I. (2019). Socio-economic inequality in the context of the development of a social state in modern Russia. Vestnik NGIEI=Bulletin NGIEI, 7(98), 108‒117 (in Russian).
- Rossoshanskii A.I., Belekhova G.V. (2020). Monetary inequality and inflation in Russia: Official statistics and assessments of population. Nauka Krasnoyar’ya=Krasnoyarsk Science, 9(4), 31-60. DOI: 10.12731/2070-7568-2020-4-31-60 (in Russian).
- Salmina A.A. (2007). Attitudes of the Russians towards income inequality and factors of their formation in comparison with other European countries. Vlast’=Power, 2, 27–37 (in Russian).
- Salmina A.A. (2021). High economic inequality in Russia? Measurement issues, indicators and evaluation. Mir Rossii=Universe of Russia, 30(3), 78–99. DOI: 10.17323/1811-038X-2021-30-3-78-99 (in Russian).
- Schoene M., Allaway I. (2019). Income inequality and European protest activity. Michigan Sociological Review, 33, 76–97.
- Stiglitz J. (2015). Tsena neravenstva. Chem rassloenie obshchestva grozit nashemu budushchemu [The Price of Inequality: How Today’s Divided Society Endangers Our Future]. Moscow: Eksmo.
