The state and prospects of grain production in Ukraine

Author: Bohdaniuk E.V., Rakitina V.V.
Journal: Мировая наука @science-j
Section: Основной раздел
Article in issue: 12 (21), 2018.
Free access
The article is devoted to research the state and prospects of grain production in Ukraine.
Grain and legume crops, statistical evaluation, production
Short address: https://sciup.org/140263252
IDR: 140263252
Text of the scientific article The state and prospects of grain production in Ukraine
At the present stage of development of agriculture, an important task is to ensure the proper production of grain, which is crucial for the entire agrarian sector of the economy. Grain farming is the basis of agrarian production, and its level of development is one of the most important indicators of the state of the economy of Ukraine.
Ukraine's natural and climatic conditions and fertile soil contribute to the cultivation of grain crops and allow high-quality food crops to be obtained in quantities sufficient to meet domestic needs and create export potential. It should be noted that in 2017-2018, Ukraine entered the top 10 grain crop producers. The world's main grain producers in 2017-2018 are 10 countries: China (499.9 million tons); US (436.4 million tons); India (248.1 million tons); Russia (125.9 million tons); Brazil (109.9 million tons); Argentina (67.3 million tonnes); Ukraine (61.5 million tons); Canada (56.2 million tons); Indonesia (48.4 million tonnes); Pakistan (38.9 million tons).
Graph 1. Dynamics of grain production in Ukraine, 2000 – 2017 years
Considering the sown area under the grain in Ukraine it should be noted the general tendency to it reducing on average for the analyzed period on 319.2 ths. hectares. Such a reduction is mainly due to an increase in technical crops in the arable structure in all categories of farms in Ukraine ( Graph 2 ) [1].
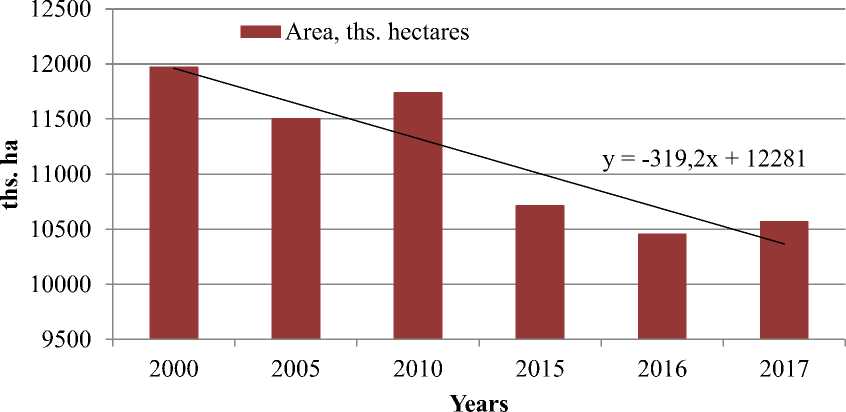
Graph 2. Dynamics of grain area in Ukraine, 2000 – 2017 years
Each region of Ukraine produces a certain amount of grain crops. In Table 1 the production of grain and legume crops by fields is represented. So, analyzing the last one, 2017 year, we can say that the three leading production companies included the Vinnytsia, Odesa and Poltava regions, and the smallest production is in the Transcarpathian, Chernivtsi and Ivano-Frankivsk regions.
Table 1
Crop production by regions of Ukraine, 2000 – 2017 years, mln. tons
|
Region |
2000 |
2010 |
2013 |
2015 |
2016 |
2017 |
|
Vinnytsia |
1744,5 |
3111,3 |
4852,3 |
3768,3 |
5563,5 |
4888,9 |
|
Volin |
503,1 |
579,4 |
902,0 |
1062,3 |
1109,7 |
1165,2 |
|
Dnipropetrovsk |
1571,4 |
2708,6 |
3710,3 |
3866,2 |
3480,8 |
3578,4 |
|
Donetsk |
1011,0 |
1796,6 |
2210,3 |
1536,1 |
1793,4 |
1908,0 |
|
Zhytomyr |
721,4 |
1086,9 |
2108,6 |
1459,6 |
2093,9 |
1993,7 |
|
Transcarpathian |
166,8 |
255,8 |
325,0 |
332,4 |
412,4 |
390,1 |
|
Zaporozhye |
1150,1 |
1905,4 |
2111,0 |
2728,1 |
2624,4 |
2907,1 |
|
Ivano-Frankivsk |
253,1 |
346,5 |
677,6 |
688,5 |
772,8 |
753,7 |
|
Kyiv |
1430,5 |
2003,0 |
3343,0 |
2820,0 |
3327,5 |
2646,9 |
|
Kirovograd |
1378,4 |
2374,1 |
3781,4 |
3313,9 |
3725,8 |
2858,0 |
|
Lugansk |
441,7 |
811,1 |
1292,9 |
992,8 |
1274,2 |
1276,2 |
|
Lviv |
481,4 |
622,7 |
1186,1 |
1366,3 |
1428,8 |
1417,0 |
|
Nikolaev |
921,3 |
2200,7 |
2803,8 |
2896,4 |
2725,5 |
2674,6 |
|
Odessa |
1581,3 |
2928,7 |
3670,8 |
3489,0 |
4403,3 |
4264,9 |
|
Poltava |
1407,8 |
2853,7 |
5639,6 |
5363,2 |
5783,1 |
4241,4 |
|
Rivne |
494,7 |
635,8 |
1108,6 |
1101,5 |
1300,5 |
1208,7 |
|
Sumy |
967,6 |
1323,9 |
3588,1 |
3734,5 |
3816,2 |
3686,2 |
|
Ternopil |
740,6 |
1261,0 |
2228,9 |
2199,0 |
2448,6 |
2622,3 |
|
Kharkiv |
1267,6 |
1266,5 |
4201,5 |
4209,7 |
4316,7 |
3859,2 |
|
Kherson |
1166,3 |
1514,8 |
1686,4 |
2621,9 |
2262,4 |
2545,4 |
|
Khmelnitsky |
1241,7 |
1742,8 |
3039,5 |
2792,9 |
3085,5 |
3421,4 |
|
Cherkassy |
1594,1 |
2531,1 |
4068,5 |
3745,5 |
4091,7 |
2926,5 |
|
Chernivtsi |
325,9 |
488,5 |
625,5 |
523,5 |
507,4 |
603,9 |
|
Chernihiv |
832,3 |
1518,2 |
3123,6 |
3514,2 |
3739,9 |
4079,0 |
According to industry experts, Ukrainian farmers still harvest about 4 t/ha of wheat and a little more - 5 t/ha of corn, while European farmers have reached an average of 8 t/ha of wheat, while in the United States the average yield of corn is 11 t/ha [2]. At the same time, unlike many European producers, we remain profitable. And even despite shifting climatic zones, the analysis of the dynamics of grain production indicates that the yield index in Ukraine continues to grow. The reason for the increase in yield is hidden in the production of grain and oilseeds, as well as in the future, the expansion of the volumes of irrigation fields.
According to the Organization for Economic Cooperation and Development (OECD) and the United Nations Food and Agriculture Organization (FAO), global cereal and cereal consumption is expected to increase by 2026, a projected increase of 13% compared to the base period (2014-2016), to 2863 million tons [3].
The expected increase in production, including as a consequence of grain exports, will significantly improve Ukraine's position in world trade. Such a tendency will, of course, have a positive effect on Ukraine's domestic market and on the welfare of the population.
References The state and prospects of grain production in Ukraine
- State Statistics Service. 2018. Plant Growing of Ukraine (Statistical Collection).
- Gorbachev N. What are the prospects of the grain market of Ukraine until 2030? Retrieved from https://delo.ua/business/jaki-perspektivi-zernovogo-rinku-ukrajini-do-2030-roku-344436/.
- Organization for Economic Cooperation and Development. Retrieved from http://www.oecd.org.
