The study of electrical circuits in university technical specialties through information visualization using Microsoft Office applications

Author: Ryshyanova S.M., Zharlygassova E.Z., Lifenko V.M.
Journal: Теория и практика современной науки @modern-j
Section: Математика, информатика и инженерия
Article in issue: 1 (55), 2020.
Free access
This paper describes the process of optimizing the training of engineers and technicians through information visualization using Microsoft Office applications
Optimization of the educational process, simulating the program, training simulator, and microsoft office applications
Short address: https://sciup.org/140275022
IDR: 140275022 | UDC: 53.08:004
Text of the scientific article The study of electrical circuits in university technical specialties through information visualization using Microsoft Office applications
Introduction
Visualization of educational information technology is one of the methods for educational process optimization. The process of solving the experimental technical and physical problems begins with a study of the theoretical foundations and definitions. At the workshops familiarity with formulas is achieved by using Microsoft Office applications by typing mathematical symbols in the formula editor, imported from the Power Point slides, followed by oral presentation of the information in the slides.
Students learn the definitions in the process of creating a video using mobile devices, the WEB-camera or digital video camera, accompanied with a voiced text and formulas.
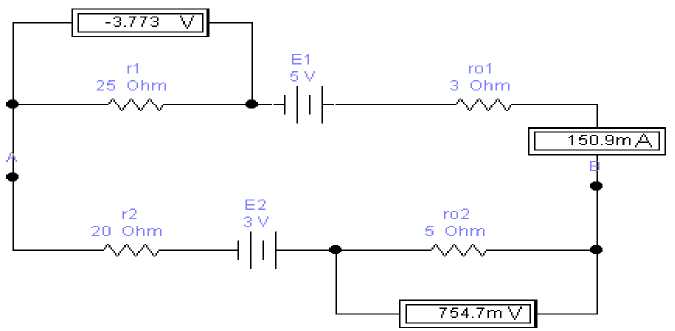
Image schema, on the proposed layout of the circuit is carried out with the help of Electronics Workbench Help program (Figure 1).
-
Figure 1 Figure schemes implemented using Electronics Workbench Help program
Familiarity with conventional graphic symbols of discrete elements, rules and features of the oscilloscope connectivity, ammeter, voltmeter and ohmmeter and scientific measurement method and the recording device is performed through this simulating program. Method for mathematical modeling is widely used to study the modes of operation of electrical circuits, along with numerical and analytical methods.
Organization of educational research:
Image circuitry is implemented in a graphics editor Paint Brush and imported into Excel environment, whereby the readings of ammeters and voltmeters get visualized (Figure 2). Visualization of experimental results of the solved problem is represented by graphics, tables, charts, flowcharts, and mathematical model. The corresponding mathematical model facilitates the analysis of the electrical characteristics of the electronic device and each loop can be used to predict conditions and usage.
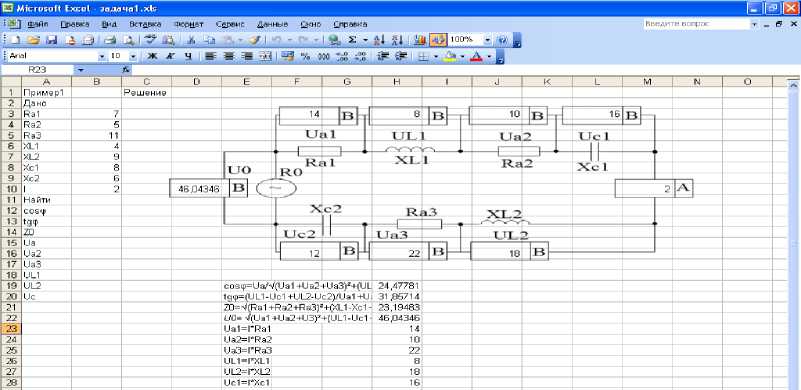
Figure 2. Implementation of a mathematical model of the electrical circuit sinusoidal current with Microsoft Office Excel application.
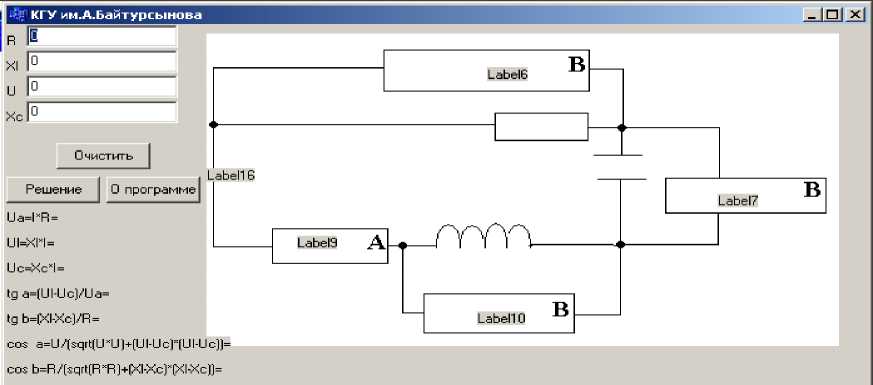
Visualization of problem-solving process for the simplified model or device is also carried out on the simulator (Figure 3), implemented in the visual environment, C ++ Builder 6.0 software [1-2]
-
Figure 3. The implementation of a mathematical model of the sinusoidal current electrical circuit using a visual programming environment C ++ Builder 6.0
Rendering algorithm
Conclusion: Visualization of the experimental tasks results is an effective method to improve the quality of mastering a sinusoidal current flow laws. Development of a mathematical model of the electronic device for the investigation of their characteristics and the prediction modes of operation contributes to the optimization of teaching and research training of engineers and technicians for their future professional activity.
List of sources used:
References The study of electrical circuits in university technical specialties through information visualization using Microsoft Office applications
- Bazhenova IJ, Delphi 7. Teach programmista.- Univ.: Kudits-image, 2003. - 448 p.
- Galiseev G. Programming in Delphi 7: Teach. - Univ.: Williams, 2003. - 288 p.
