The technology for detecting weeds in agricultural crops based on vegetation index VARI (Planetscope)
")
Author: Erunova Marina G., Pisman Tamara I., Shevyrnogov Anatoliy P.
Journal: Журнал Сибирского федерального университета. Серия: Техника и технологии @technologies-sfu
Article in issue: 3 т.14, 2021.
Free access
The aim of the work is to develop techniques for detecting weediness in agricultural crops based on the use of the VARI vegetation index, calculated from the PlanetScope satellite data. The territories of the Krasnoyarsk Agricultural Research Institute of the Federal Research Center of the Krasnoyarsk Science Center of SB RAS near the village Minino (Central Siberia, Krasnoyarsk Region) were used as the object of the research. To calculate the vegetation index VARI of grain crops, the algorithm for receiving and processing PlanetScope satellite data was developed. On its basis, a map of the spatial distribution of the VARI index for wheat crops with various degrees of weediness was made. According to the satellite data of PlanetScope (VARI), possibility to interpret the areas of wheat sowing with a high and low degree of weediness during the growing season is shown. It was revealed that the VARI value of wheat crops with a low degree of infestation is greater than the VARI value of wheat crops with a high degree of infestation.
Algorithm, wheat, crops weediness
Short address: https://sciup.org/146282226
IDR: 146282226 | UDC: 528.8.04, | DOI: 10.17516/1999-494X-0314
Технология обнаружения засоренности посевов сельскохозяйственных культур на основе вегетационного индекса VARI (Planetscope)
Целью работы является разработка методики обнаружения засоренности посевов сельскохозяйственных культур на основе применения вегетационного индекса VARI, рассчитанного по спутниковым данным PlanetScope. В качестве объекта исследования использованы территории Красноярского НИИСХ ФИЦ КНЦ СО РАН вблизи пос. Минино (Средняя Сибирь, Красноярский край). Для расчета вегетационного индекса VARI посевов зерновых культур разработан алгоритм получения и обработки спутниковых данных PlanetScope. На его основе создана карта пространственного распределения индекса VARI посевов пшеницы с различной степенью засоренности. По спутниковым данным PlanetScope (VARI) показана возможность дешифрирования участков посевов пшеницы с высокой и низкой степенью засоренности в течение вегетационного сезона. Выявлено, что величина VARI посевов пшеницы с низкой степенью засоренности больше величины VARI посевов пшеницы с высокой степенью засоренности.
Text of the scientific article The technology for detecting weeds in agricultural crops based on vegetation index VARI (Planetscope)
Цитирование: Ерунова, М.Г. Технология обнаружения засоренности посевов сельскохозяйственных культур на основе вегетационного индекса VARI (PlanetScope) / М.Г. Ерунова, Т.И. Письман, А.П. Шевырногов // Журн. Сиб. федер. ун-та. Техника и технологии, 2021, 14(3). С. 347–353. DOI: 10.17516/1999-494X-0314
Research methodologies
The object of the research is the crops planted on the territory of the Krasnoyarsk Agricultural Research Institute of the Federal Research Center of the Krasnoyarsk Science Center of SB RAS near the village Minino (Middle Siberia, Krasnoyarsk Region). The crops of spring wheat Svirel (Triticum vulgare) with different degrees of infestation in areas № 22 and № 23 for the growing season of 2019 were studied. (Fig. 1).
The PlanetScope satellite data were used to interpret agricultural crops with varying degrees of infestation. The largest satellite constellation of PlanetScope company gives high spatial resolution (3 m) data on a daily basis from Dove satellites [7]. The spectral channels are represented by four ranges: 455-515 nm, 500-590 nm, 590-670 nm, and 780-860 nm. The data are provided on a commercial basis.
The assessment of wheat infestation was carried out according to the VARI vegetation index. VARI – Visible Atmospheric Resistant Index [8]. This index is resistant to the influence of the atmosphere and can be used for assessment of species composition of vegetation. VARI is designed to highlight vegetation in the visible part of the spectrum. It is suitable for color images, uses all three color channels. It is calculated by the formula (1):
VARI = (GREEN – RED) / (GREEN + RED – BLUE) (1)
where Green – the pixel values from the green channel (500-590 nm); Red – pixel values from the red channel (590-670 nm); Blue – pixel values from the blue channel (455-515 nm).
To calculate VARI using PlanetScope satellite data, a set of orthorectified images was formed in the Planet Explorer online service for the growing season of 2019, “cloudless data” were selected.
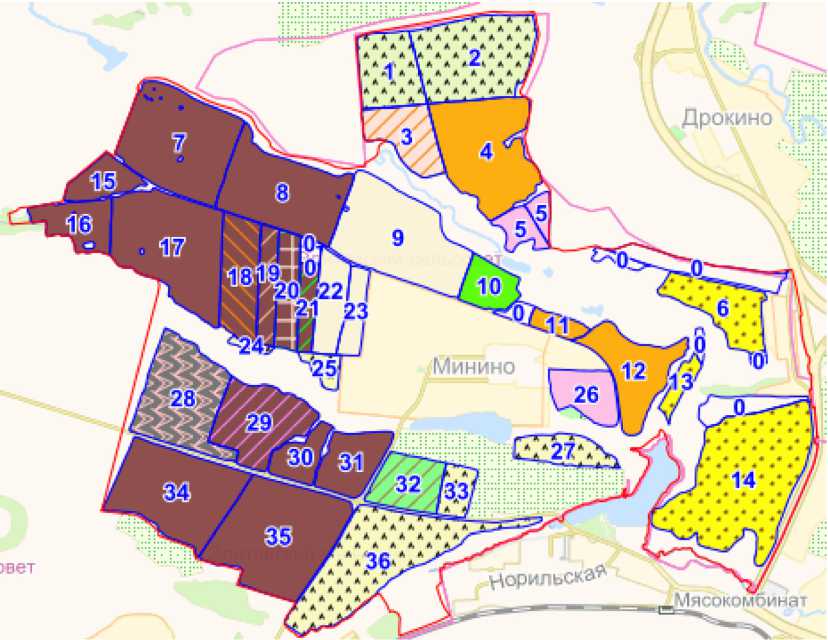
Fig. 1. Map of agricultural crops on the territory of the Krasnoyarsk Agricultural Research Institute of the Federal Research Center of the Krasnoyarsk Science Center of SB RAS near the village Minino (Middle Siberia, Krasnoyarsk Region). The studied fields № 22 and № 23 are wheat crops with different degrees of infestation
In each obtained image, all spectral channels have their own (individual) calibration coefficients. In the program GIS QGIS through the module “Raster calculator” for each image, the spectral index VARI was calculated taking into account individual coefficients. If the territory consists of several images, then the images were merged into a “single” raster.
A digital map of agricultural fields and a set of VARI images for 2019 made it possible to get statistical VARI values for each field during the entire growing season [9].
For biological assessment of the degree of weediness of grain crops, a visual method of accounting weeds is used [7]. Observational data are assessed on a four-point scale:
-
1 point – a weak degree of infestation, weeds are rare;
-
2 points – average degree of infestation, weeds are noticeable among cultivated plants (up to 25%);
-
3 points – a strong degree of infestation, the number of weeds is close to the number of cultivated plants;
-
4 points – a very strong degree of infestation, the number of weeds is more than the number of cultivated plants.
Interpretation and discussion of research results
Among the tasks of current monitoring of the state of crops according to remote sensing of the Earth, a special place is occupied by assessment of the sanitary state of crops, i.e. identifying the fact of crop weediness.
It is established that the amount of crop yield depends not only on the total weediness of crops, but also on the nature of the placement of weeds in the field. It is proved that the greater their congestion, the higher the threshold of harmfulness, which causes a fixed loss of yield [3].
Earlier, an algorithm for obtaining and processing satellite PlanetScope data was developed for calculating the vegetation index NDVI of agricultural crops [7]. On its basis, a map of the spatial distribution of NDVI of wheat crops with various degrees of weediness was created. Based on the NDVI index, possibility to interpret areas of wheat crops with high and low degree of weediness is shown.
To improve the reliability of the detection of weediness of agricultural crops, it becomes necessary to study the assessment of the degree of infestation of crops on the basis of other vegetation indices.
Fig. 2 shows the dynamics of the VARI vegetation index of wheat crops with different degrees of weediness during the growing season. The presence of dependence of the value of this index on the degree of weediness during the active growth phase (July – August) was found. The higher the level of weediness of crops, the lower the VARI values. With a very high degree of weediness (level 4), the VARI values reach 0.12-0.15, while with a low degree of weediness, they reach 0.27.
Knowledge of relationship between the state of vegetation and its spectral reflectivity is the basis for solving agricultural problems. Nowadays, the most urgent task of remote monitoring is getting and analyzing maps of the spatial distribution of vegetation indices.
The vegetation index map shows the state of agricultural crops in the field, exactly, the amount of active biomass, density and uniformity of development, suppression, etc. The map gives an opportunity to identify problem zones and areas for further additional analysis. By monitoring large areas of agricultural crops, it is especially important to identify differences in development of crops during the growing season. This makes it possible to quickly make adjustments to the technology of growing crops for increasing the level of productivity.
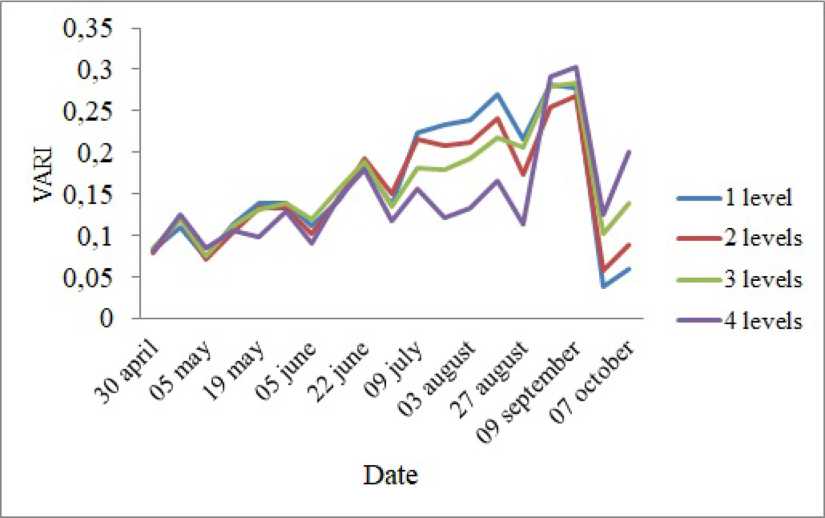
Fig. 2. Dynamics of the VARI index of wheat crops depending on the degree of weediness during the growing season of 2019
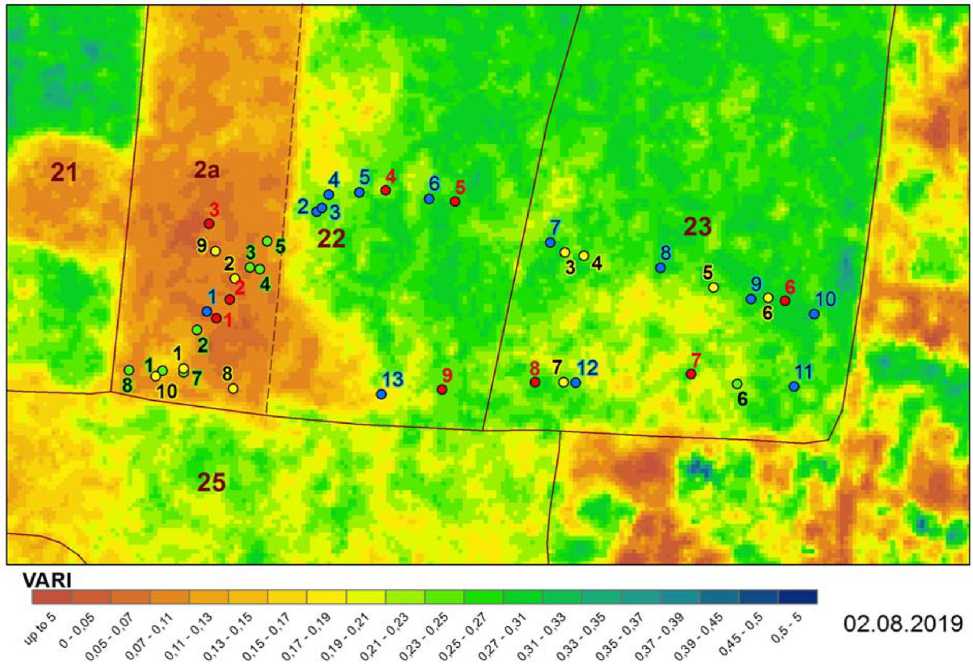
Fig. 3. Map of the spatial distribution of the VARI index of wheat crops with different degrees of weediness. Area 2a (highlighted in brown) indicates an unsown zone with a high degree of weediness and a low VARI, while fields № 22 and 23 show areas with a high VARI and a low degree of weediness (highlighted in green). Circles indicate the route for biological assessment of the degree of infestation of crops. Red and blue circles indicate areas with a low degree of weediness (1 and 2 points), yellow and green circles-with a high degree of weediness (3 and 4 points)
Weeds are most clearly detected on the map of the spatial distribution of the VARI index in early August-02.08.2019 (Fig. 3). The difference in the value of the VARI index appears due to the different time of flowering and maturation of cultivated and weed plants. In August, weeds begin to bloom profusely. Accordingly, the amount of chlorophyll decreases and, in this regard, the value of VARI of weed vegetation decreases. This is especially evident on the map of the spatial distribution of the vegetation index VARI in fields № 22 and 23.
In field № 22, the area 2a shows an unsown part of the field with weeds (Fig. 3). On this part of the field areas with a strong and very strong degree of weeding dominate. On the other hand, in the sown fields № 22 and 23, wheat is at the end of flowering stage. At this moment, it contains a large amount of chlorophyll and in this regard, a high value of the VARI index of wheat crops was revealed (highlighted in green). Consequently, possibility of interpretation of fields with weeds by the vegetation index VARI was found.
Such maps are of great help to an agronomist, allowing him to identify and accurately assess the scale of the problem. They allow to plan and carry out technological measures for precise treatment or protection from weediness in time. Accurate application of plant protection products significantly saves money due to their timely distribution not to all fields, but specifically to an area with high weediness.
Thus, on-line monitoring of crops plays an important role in obtaining high and stable yields. The use of modern technical means can significantly reduce the time spent without losing the quality of the survey.
Conclusions
The specificity of agricultural production is its dependence on weediness of crops, which leads to the variability of agricultural production from year to year. Such variability has a significant impact on agricultural markets and prices.
Taking into account the lack of information on the weediness of crops, one can confirm that the study and development of methods of satellite monitoring and field spectrometry of agricultural land are among the priority tasks [10, 11].
Based on the results presented in this work, the following conclusions were made:
-
– an algorithm for receiving and processing PlanetScope satellite data for calculating the vegetation index VARI of grain crops was developed;
-
– a map of the spatial distribution of the vegetation index VARI of wheat crops with various degrees of weediness was made;
-
– based on the VARI index, possibility to interpret the areas of wheat crops with a high and low degree of weediness is shown. The higher the degree of weediness of crops (4 level), the lower the VARI values and vice versa, the lower the degree of weediness of crops (1 level), the higher the VARI values.
References The technology for detecting weeds in agricultural crops based on vegetation index VARI (Planetscope)
- Pflanz M., Nordmeyer H., Schirrmann M. Weed mapping with UAS Imagery and a Bag of Visual Words based image classifier. Remote Sensing, 2018, 10(10), 1530 (doi: 10.3390/rs10101530)
- Wu B., Meng J., Li Q., Yan N., Du X., Zhang M. Remote sensing-based global crop monitoring: experiences with China's Crop Watch system. International Journal of Digital Earth, 2014, 7(2), 113137 (doi: 10.1080/17538947.2013.821185)
- Lamba D.W., Brown R.B. PA - precision agriculture: remote-sensing and mapping of weeds in crops. Journal of Agricultural Engineering Research, 2001, 78(2), 117-125 (doi: 10.1006/ jaer.2000.0630)
- Martin M.P., Barreto L., Riaco D., Fernandez-Quintanilla C., Vaughan P. Assessing the potential of hyperspectral remote sensing for the discrimination of grassweeds in winter cereal crops. International Journal of Remote Sensing, 2011, 32(1), 49-67 (doi: 10.1080/01431160903439874)
- Rembold F., Atzberger C., Savin I., Rojas O. Using low resolution satellite imagery for yield prediction and yield anomaly detection. Remote Sensing, 2013, 5(4), 1704-1733 (doi: 10.3390/rs5041704)
- Vrindts E.J., De Baerdemaeker J., Ramon H. Weed detection using canopy reflection. Precision Agriculture, 2002, 3(1), 63-80 (doi: 10.1023/A:1013326304427)
- Pisman T.I., Erunova M.G., Botvich I.Yu., Shevyrnogov A.P. Spatial distribution of NDVI seeds of cereal crops with different levels of weediness according to PlanetScope satellite data. J. Sib. Fed. Univ. Eng. Technol, 2020, 13(5), 578-585 (doi: 10.17516/1999-494X-0247)
- Gitelson A., Stark R., Grits U., Rundquist D.C. Vegetation and Soil Lines in Visible Spectral Space: A Concept and Technique for Remote Estimation of Vegetation Fraction. Int. J. Remote Sens., 2002, 23, 2537-2562
- Erunova M.G., Shpedt A.A., Trubnikov Y.N., Yakubailik O.E. Geospatial database for digitalization of agriculture of the Krasnoyarsk territory. IOP Conference Series: Earth and Environmental Science. Krasnoyarsk Science and Technology City Hall of the Russian Union of Scientific and Engineering Associations, 2019, 315(3), 32022
- Thorp K., Tian L.F. A review on remote sensing of weeds in agriculture. Precision Agriculture, 2004, 5(5), 477-508 (doi: 10.1007/s11119-004-5321-1)
- Petit S., Boursault A., Guilloux M., Munier-Jolain N., Reboud X. Weeds in agricultural landscapes. A review. Agronomy for Sustainable Development, 2011, 31(2), 309-317 (doi: 10.1051/ agro/2010020)
