The Unwanted Emission Signals in the Context of the Reconstruct Possibility of Data Graphics

Author: Ireneusz Kubiak
Journal: International Journal of Image, Graphics and Signal Processing(IJIGSP) @ijigsp
Article in issue: 11 vol.6, 2014.
Free access
In its operation, every electrical device generates electromagnetic disturbance signals. They can be due to the operation of components of the device (step motors, heaters, control circuits, or electronic circuits). Quite often such signals have the characteristics of the data processed on such devices. They can have the form of a text. In each case, such signals are undesirable. However, they can be used to reproduce such data or, in other word, to conduct the process of electromagnetic infiltration. In the case of video signals (graphic mode of a computer, a laser printer), then the reproduced data can be presented in the form of graphic images that can be easily assimilated by people. Such images are transformed in order to find the data that is of interest. Reproduction of such data may lead to a disclosure of classified information. There are many solutions that should counter the process of reproduction of such data. Such solutions are implemented in the design of equipment and influence, to a lesser or greater extent, the appearance of the equipment, as well as the related organizational methods. A new method that can be used in electromagnetic protection of process data is a software solution. It involves the use of appropriate computer fonts. The article presents the possibilities related to shaping the form of video signals. For this purpose, appropriate shapes of the letter characters of computer fonts were recommended. Unlike characters in standard fonts (Arial and Times New Roman), they do not have the unique decorative elements (serif), such as hooks, connectors, heels, arches, and ribbons, and consist of only vertical and horizontal lines [5]. There are no slanted and crooked lines. Due to this, the characters are often very similar. This greatly contributes to the impossibility to differentiate between the letter characters in the reproduced image that is filled with noise and numerous disturbances. The graphic elements being searched, having the form of strings of letters, cannot be read. The digital image processing methods intended to improve the quality of the image are quite ineffective. In search for graphic characters, such as computer font letter and digit characters, one can use methods based on the similarity of the standard with a portion of the analyzed image. However, when special fonts are used, the correlation method generates many false decisions, which also prevents reading text data.
Image analysis, image reconstruction, text recognition, data processing
Short address: https://sciup.org/15013443
IDR: 15013443
Text of the scientific article The Unwanted Emission Signals in the Context of the Reconstruct Possibility of Data Graphics
Published Online October 2014 in MECS DOI: 10.5815/ijigsp.2014.11.01
When processing any data having the electronic form, radiated emission signals are generated. The nature of such emission can be compared to standard radio emission, e.g. broadcast by radio stations. However, when the main objective is not to radiate signals, such radiation is undesirable. The nature of such signals may correspond to the nature of the signals being processed [1]. In such situations, the emissions can be described as undesirable descriptions or byproducts. Quite often, such signals are referred to as compromising emanations. This is due to the fact that such signals have distinctive characteristics that correspond to the electrically processed data. Such characteristics include electric impulse duration, rising and falling edge duration, and impulse voltage amplitude value. The source of such signals can be any element of the device that processes data in electrical form. In particular, the graphic channel of a computer or the laser of a laser printer, can constitute such sources.
Due to the fact that such signals are not produced on purpose, it is not obvious that they can be received. This also applies to signals produced in the graphic channels of equipment. The suitability of such recorded signals is significant when the reception parameters correspond to the parameters of the video signal associated with the processed image. In the case of an image from the computer screen, this is the graphic mode of operation of the graphics card and the frequency of image refresh [2]. In the case of computer printers, it is the quality and speed of the print. When such parameters are taken into account in the receipt of undesirable signals, it may be possible to reproduce graphic data in the form of a standard image seen on a computer monitor or a printed sheet of paper [19].
Of huge importance to the data reproduction capability are the graphic form of the data and the characteristics of the Information Infiltration Channel ( IIC ). The IIC has the characteristics of a high-pass filter (differentiability):
x ( t + A t ) — x ( t )
x ' ( t ) = lim (1)
At >0 A t where: x'(t) - the form of the signal x(t) after passing through the theoretical IIC (signal at the output of the IIC), x(t) - the form of the compromising emanation signal (signal at the input of the IIC).
What this means is that at the output of the channel there are only higher-frequency components of the original signal constituting a source of the undesirable signal. Taking into account the characteristics of the IIC , one can select the form of the original signal so that the undesirable emission generated prevent the reproduction of the processed data present in the image being analyzed. Such an image is created as a result of the process of rastering of the compromising emanation signal. The lack of ability to reconstruct and read the graphic elements of the image may be due to the presence of two phenomena. First, the undesirable emission signal may have no unique characteristics associated with the data present in the image. Second, the unique characteristics may be present, but their mutual similarity may be so great that it is not possible to distinguish between individual text data characters in the reproduced image.
The solutions currently used to protect information against electromagnetic infiltration are mostly organizational and technical measures. They consist in filtration of the signal circuits, shielding of electronic modules of equipment, and organization of physical limited access zones [2].
The authors of the article recommend using a new method, the so-called software method, based on sets of special computer fonts, where the letter and digit characters have no elements that increase the differences between them [5][6]. Very often, classified text data is printed for further distribution. Therefore, the effectiveness of the new computer fonts in electromagnetic protection of information is demonstrated for the emission source having the form of a laser printer. The printed data is texts written using letter characters of traditional fonts (Arial and Times New Roman) and letter characters of specially designed fonts. The special letter characters were the source of undesirable emissions that were different from similar signals for traditional font letter characters.
In order to define the degree of similarity between characters used in the different fonts, the character correlation coefficient was used. Attempts to reproduce the characters contained in the reproduced images were made using the visual method. However, due to the numerous interferences in the images, visual analysis is not fully effective and credible. The authors recommended using threshold values RZthr of the character correlation coefficient above which the adopted values of the character correlation coefficient are to determine the recognition of a character being searched. The criterion for determination of the threshold values RZthr requires recognition of at least 90% of the total number of specific characters. However, the degree of similarity between the characters present in an image and the characters in the standard image, in particular in the case of images with lots of noise and containing numerous interferences, is very high. This pertains both to identical and different characters. Consequently, in order to evaluate correct recognition of characters, the authors recommended using a parameter that would indicate the number of errors consisting in incorrect recognition of characters. This parameter is the Character Error Rate (CER). Both failures to recognize specific characters and incorrect recognition of characters are included in its value.
-
II. Source Of Undesirable Signals
Images in computer printers are formed in the same way as in CRT monitors. Both devices use the rastering method, which consists in arranging, line after line, appropriate sections of the recorded signals, thus forming the image (a matrix with the appropriate number of columns and rows according to the area to be printed on and the resolution of the print). It is easily noticeable that during printing of documents, the string of recorded data required to reproduce a single page to be printed is very large. Recording of a signal corresponding to an A4 page (8.27" x 11.69") with the print quality of 600 dpi x 600 dpi, assuming that each dot of the print should correspond to about 3 signal samples, requires 105 MB of disk space.
Before we move on to the analysis of the shapes of the computer font characters at the output of the IIC obtained from compromising emission signals whose source is a laser printer, we should describe the process of formation of a printed image on paper. Let us focus on the stage that determines the production of radiated emission that carry information about the characters being printed. The most important stage of the entire process is the moment when light strikes the photosensitive drum. The source of light is most often a laser diode which emits interrupted light (the process of interruption of light emission is the source of emission which determines the chance of success of reproduction of printed image) which, through a lens, is directed onto special multi-angular rotating mirror which rotates with the speed of several thousand rotations per minute (fig. 1). Thanks to its movement, the individual flashes are reflected at different angles and
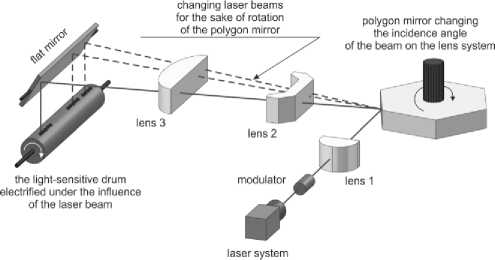
Fig. 1. General outline of image formation in laser printers.
strike successive points on the drum, causing them to be positively charged.
This enables sending over 80 million light impulses in one minute. Then a negatively charged toner is applied on the printer. The toner adheres to the drum only in locations where the laser beam struck the drum, which are positively charged by the laser. In the printing process, the paper, too, is positively charged which enables transferring the toner from the drum onto the surface of the paper.
Because of the interruptions of the laser beam, the beam strikes individual points which form lines in letter or digit characters. Each light emission is a source of a radiated emission signal which is used to reproduce the character using the compromising emanation signal. Note that the emission signal generated in this manner carries information not only on the vertical and slanted edges of printed characters [1], but also about the way they are filled (Fig. 2). This may increase the possibility to reproduce characters and to read the information. Further in this article we will demonstrate whether this applies to texts written with special (secure) fonts.
-
III. Forms Of Font Characters Obtained From Undesirable Emission Signals.
The undesirable emission signals were recorded during printing of a text document that contained letter characters of standard fonts and of special fonts, in the arrangement presented in Figure 3. Signals were transmitted between the computer and the printer using the USB 2.0 standard and the quality of the document was 600 dpi x 600 dpi. The recorded signals had two frequencies: 700 MHz and 750 MHz.
(a)
(b)
The special/secure computer fonts that protect processed text data from successful electromagnetic infiltration is the fonts whose lower case letters were shown, as an example, in Figure 4.
a) the special font 1

b) the special font 2

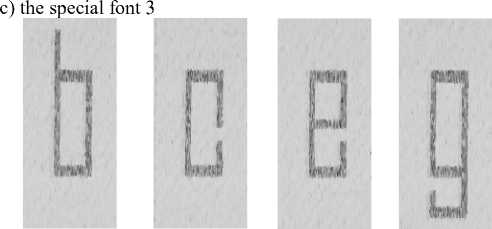
c) the special font 3

Fig. 4. The forms of letter characters of special fonts.
These are characters of one- (special font 3) and two-element (special fonts 1 and 2) typefaces. The letter characters have no unnecessary decorative elements (serif) that distinguish them from other letters in the same font.
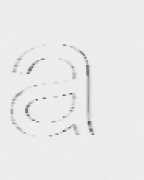
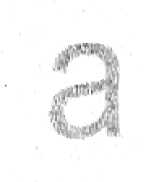
The shapes of the graphic characters corresponding to letter characters of computer fonts, obtained in the process of image rastering from undesirable emission signals, are similar to their counterparts in the original text. Examples of such shapes are shown in Figure 5. However, those characters are very different from the graphic form of the characters reproduced from radiated emission signals whose source is the graphic channel of a VGA standard computer [6]. This is due to the nature of the video signal as the emission source, in the case of a computer monitor, and of the signal that controls the operation of the laser, in the case of a laser printer.
Fig. 2. An example form of a letter character obtained from a recorded undesirable emission signals whose source was a) a computer monitor and b) a laser printer.
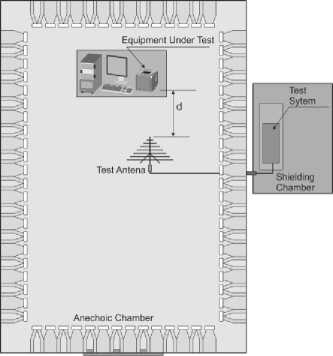
Fig. 3. The measuring system used to record the compromising emanation signals generated by the laser printer.
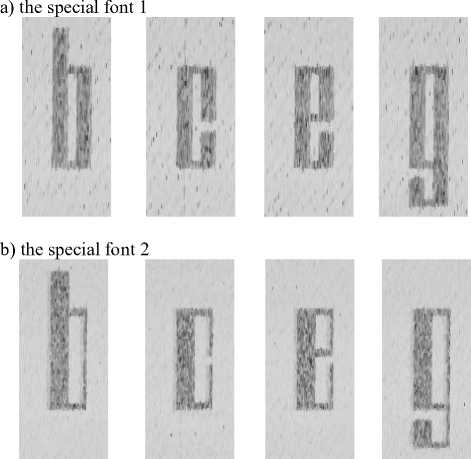
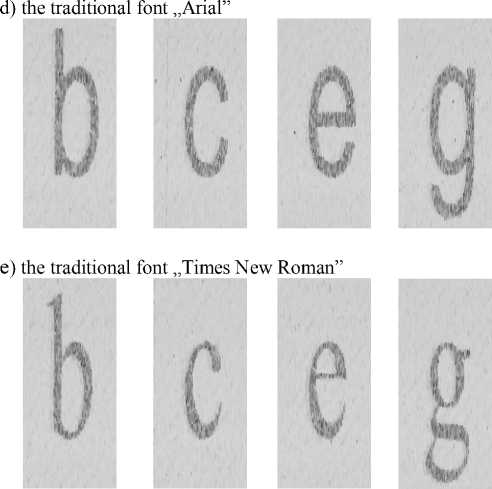
Fig. 5. Examples of letter characters of computer fonts reproduced from compromising emanation signals whose source was a laser printer -inverted images.
a)
However, one must take note of the very important issue of the structure of the characters that are reproduced on the basis of recorded signals correlated with the signal of a printer laser.
b)
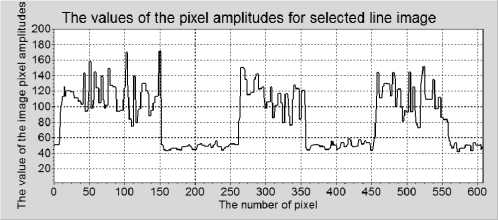
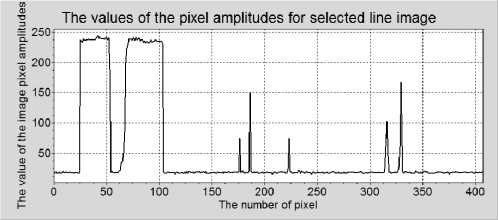
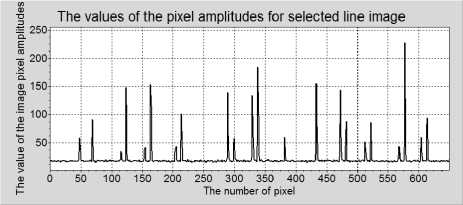
Fig. 7 Examples of paths of the compromising emanation signals that are recorded during operation (single vertical lines (columns) of images) of a) the graphic channel of a computer and b) a laser printer, for the Arial font.
As has been mentioned, each point forming a character, e.g. a letter, is preceded by an electric impulse that controls the operation of a printer laser. This influences the paths of the recorded undesirable emission signals (Fig. 6 and Fig. 7) and, consequently, the form of the reproduced characters.
The simple design of special font characters, which are limited to vertical and horizontal lines forming the letter, the lack of oblique and curved lines, makes their visual analysis very difficult. Noise in the images, interferences, and low levels of recorded signals make such analysis even more complicated.
a)
b)
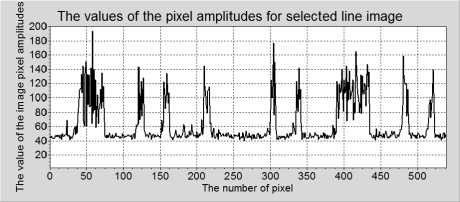
Fig. 6 Examples of paths of the compromising emanation signals that are recorded during operation (single horizontal lines (rows) of images) of a) the graphic channel of a computer and b) a laser printer, for the Arial font.
IV. R EAL I MAGES C ONTAINING L ETTER C HARACTERS
The analyses were based on signals on the output of the IIC , which were real signals. The results obtained in each case demonstrated that by properly selecting the shapes of the letter characters one can influence the degree of success in reproduction of data carried in undesirable emissions. In the case of the recommended shapes of letter characters, reproduction of characters is connected with the degree of their mutual similarity.
Figure 8 shows the real image and the image obtained using the rastering method from a recorded emission signal correlated with the operation of the laser of a laser printer. The printed document contained the same text written using the five analyzed computer fonts. The obtained image is not very legible and its quality is very poor. In such cases, the process of signal classification uses digital image processing methods whose operating algorithms are modified for the purpose of electromagnetic infiltration. The methods used with reference to the images obtained from signals whose source was the printer of a laser were median filtration of mirror size 3x3 and thresholding of the value of the
amplitude of the pixels forming the reproduced image, with the threshold values equal to 40 (lower threshold) and 218 (upper threshold). The results of the operations are shown in Figures 9 and 10.
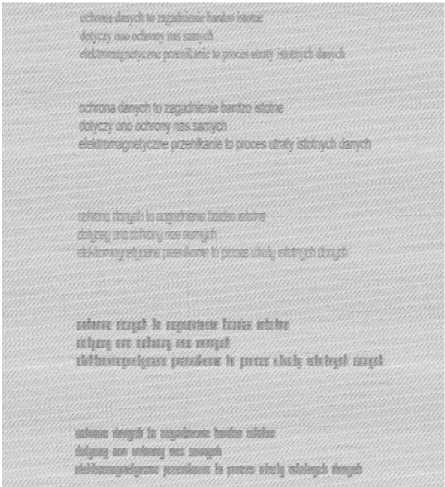
Fig. 8. A part of the real image obtained from a compromising emission signal generated by a laser printer without implementing digital processing methods aimed to improve the quality of the image, containing text written with the five analyzed computer fonts - inverted image.
OdtWU •/'-:' to ,?"..':'■.: :$rCO SSW to^’ ж юточ ?bs яс"л?
'Нит' Tf:: totztpteic' v"-." ?to‘ ' • inpeaeaiavsEswiy# • / • ■ t --г - vf;. »•;: ent»* fc зювыее; ад» top trim lurrt N mure*hiH> b6*i
«*№ ««taipunejp |к»жнр>1;пп peeN* ft turn lie!; sMtpf Шу1
-
• ЙИ>1«!1П 'll m Я -I*i Iir h ini I*mX r.iirj,; щп^ ' ".;" '
Fig. 9. A part of the real image obtained from a compromising emission signal generated by a laser printer after two operations of median filtration with the window dimensions of 3x3, containing text written with the five analyzed computer fonts - inverted image.
Because each image contains five texts, the digital image processing method used affect each of the characters contained in the image in the same manner. The methods used enabled obtaining images of better contrast and legibility. Nevertheless, some character strings are not legible.
ixMei <гмй Ni ?a@яialSк■ iitiifl - v:W
-
•№o;. йй^ойЖа ms ^зямЬ
-te^T- , -л-,. ;;.> ,; v .V^ .a >: -^v^ ^(e^v ffijCy# "'. '^
Sta to ..' V $ЙЗ?1ЯГ iBSl' У'Ж иг^, ? ъ ст I'm ms №y *
^f ■ -ri;T'J?1 .№' к ">J '*. ? ■■: :s .tei: :-rr. ;■* Я'Лр1
Him: ftztrf if ?rpinuw кян. n!sln i*l|iq ire abut iir owpl tk№«>?fpttynH f№6jer << tniizi'e!; fii’-yi »етдй fdb№ И>0 к «|е*е* Ie*.! i*ht $■>№; № 1*4 еа зм^*
iisMreeayrirBB: яув*к* Ь птс$ f^4 гМ^й Неуб
Fig. 10. A part of the real image obtained from a compromising emission signal generated by a laser printer after two operations of median filtration with the window dimensions of 3x3 and thresholding of the amplitude values with an upper and lower threshold, containing text written with the five analyzed computer fonts - inverted image
In the images, one can clearly see that the standard font characters are legible and, in most cases, can be distinguished from others. On the other hand, the special fonts shown in Figure 8 are not legible. The use of digital image process methods makes attempts at reading the text written using special font no. 3 possible. Nevertheless, this may prove to be difficult. The other special fonts (1 and 2) make the text contained in the image completely unsuitable for reading using the visual method. In particular, special font 3 is a string of dark spots that form the outlines of the rows of the text. The use of single line spacing between the rows would make the image completely blurry.
Nevertheless, visual analysis of images of poor quality is often insufficient. One must search and verify the results using supporting methods. Most often such methods involve numerical analyses supported decisionwise with appropriate conditions and criteria. One of the conditions used in the process of searching for graphic characters in an image is the threshold value of the mutual correlation coefficient. Based on this value, one can determine the value of the CER for each computer font.
-
V. Character Correlation Coefficient Of Computer Fonts And Character Error Rate
Due to strong disturbances and noise in images, their visual analysis prevents indicating the special font characters present in images. However, one may attempt to support the relevant decisions by using appropriate conditions and criteria associated with computer analysis.
As has been mentioned before, a threshold value of the character correlation coefficient has been used, for which it is assumed that at least 90% of specific characters will be recognized. This enables determination of the CER value of the analyzed fonts with regards to the number of incorrect decisions associated with recognition of a given character. The values of the character correlation coefficient are determined using the following formula:
Nw -1 Mw -1
2 2 A ■ в
^ z ________n=0 m=0____________ j,i INw -1 Mw —1 з Nw —1 Mw—1.
2 2 A2 ■ 22 n=0 m=0 n=0
where:
xj , i
1 Nw - 1
----- 2
Nw ■ Mw n =0
Mw -1 2 m =0
C
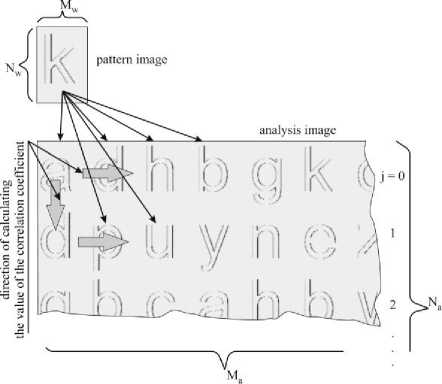
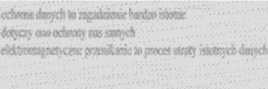
Fig. 11. The rule for calculating the character correlation coefficient Rz for computer font letter characters (in this case, letter “k” shown in the figure) in order to determine the CER.
У =
Nw - 1 Mw - 1
----- 22
Nw ' Mw n =0
yn , m
A = C - xj, i(5)
B = yn, m y(6)
C = xn+j ■ Nw, m+i ■ Nw and 0 < i < b -1 , 0 < i < d -1 , Na/ - number of b =
Nw rows in the correlation image, d = Ma - number of Mw columns in the correlation image, xn,m – amplitudes of pixels of the analyzed image containing alphabetic characters, yn,m – amplitudes of pixels of the reference image (a single alphabetic character), Ma – number of columns in the analyzed image containing alphabetic characters, N – number of rows in the analyzed image containing alphabetic characters, Mw – number of columns in the reference image (a single alphabetic character), Nw – number of rows in the reference image (a single alphabetic character), i – number of the correlation image column, m – number of the reference image column (a single alphabetic character), j – number of the correlation image row, n – number of the reference image row (a single alphabetic character), as well as the algorithm shown in Figure 11.
The obtained values of the character correlation coefficient for the individual characters within a given font are shown in Tables 1 and 2.
Table 1. Number of characters (lower case letters) for special fonts whose values of the RZ coefficient of correlation between the lower case letter characters at the output of the IIC are within the defined intervals.
|
Value of the correlation coefficient |
Number of lower case letter characters of a given font for which the value of the RZ correlation coefficient (similarity to another character of the same font) is within a defined interval. |
||
|
Special font 1 |
Special font 2 |
Special font 3 |
|
|
R < 0.2 |
0 |
0 |
0 |
|
0.2 < R < 0.4 |
5 |
0 |
16 |
|
0.4 < R < 0.7 |
135 |
128 |
142 |
|
0.7 < R < 0.9 |
58 |
70 |
40 |
|
R > 0.9 |
0 |
0 |
0 |
Table 2. Number of characters (lower case letters) for standard fonts whose values of the RZ coefficient of correlation between the lower case letter characters at the output of the IIC are within the defined intervals.
|
Value of the correlation coefficient |
Number of lower case letter characters of a given font for which the value of the RZ correlation coefficient (similarity to another character of the same font) is within a defined interval. |
|
|
Arial |
Times New Roman |
|
|
R < 0.2 |
8 |
4 |
|
0.2 < R < 0.4 |
80 |
89 |
|
0.4 < R < 0.7 |
109 |
103 |
|
0.7 < R < 0.9 |
1 |
2 |
|
R > 0.9 |
0 |
0 |
Because of the noise in the images, the character correlation coefficient for special fonts may have larger values for non-conforming characters (the standard character does not conform with the character contained in the part of the analyzed image) than for conforming characters (table 3). As a result, this may lead to incorrect recognition of characters based on the condition that the correlation coefficient must have an appropriate value.
Table 3. The maximum values of the character correlation coefficient for conforming and non-conforming characters for special fonts, SNR =- 6dB .
|
Character |
Special font 1 |
Special font 2 |
||
|
Z R b_max |
Z R t_max |
Z R b_max |
Z R t_max |
|
|
a |
0.2105 |
0.1896 |
0.1750 |
0.1855 |
|
b |
0.2012 |
0.1917 |
0.1955 |
0.1987 |
|
c |
0.1962 |
0.1876 |
0.1896 |
0.1887 |
|
d |
0.2001 |
0.1852 |
0.1916 |
0.1836 |
|
e |
0.1948 |
0.1996 |
0.1787 |
0.1852 |
|
g |
0.1938 |
0.1895 |
0.1951 |
0.1893 |
|
h |
0.2025 |
0.2031 |
0.1872 |
0.2028 |
|
i |
0.1783 |
0.1406 |
0.1861 |
0.1692 |
|
k |
0.1982 |
0.1926 |
0.1872 |
0.1992 |
|
l |
0.1796 |
0.1478 |
0.1686 |
0.1850 |
|
n |
0.1751 |
0.1927 |
0.1903 |
0.1951 |
|
o |
0.1891 |
0.1895 |
0.1880 |
0.1913 |
|
p |
0.1990 |
0.1742 |
0.1865 |
0.1873 |
|
r |
0.1846 |
0.1545 |
0.1779 |
0.1671 |
|
s |
0.1884 |
0.1735 |
0.1870 |
0.1832 |
|
t |
0.1645 |
0.1624 |
0.1786 |
0.1801 |
|
u |
0.1922 |
0.1920 |
0.1915 |
0.1874 |
|
y |
0.1852 |
0.1917 |
0.1905 |
0.2008 |
|
z |
0.1857 |
0.1803 |
0.1872 |
0.1911 |
Thus, assuming a certain value of the RZ character correlation coefficient above which the decision is made to recognize a character, one may conduct the process of search for letter or digit characters in the reproduced image. The problem that remains is adoption of appropriate threshold value of the RZ thr parameter. In the analyses that were performed, it was assumed that the percentage of the recognized characters should not be less than 90% of all the characters being searched. The relevant calculations of the RZ thr and the CER were conducted on images that contained letter characters of the different fonts with the equal number of each character (Fig. 12), for which the signal to noise ratio was equal to - 6 dB . The locations of characters in the image were random. The CER value was determined using the following formula:
CER = c+k = c + ( r - e ) ff
where: r – the number of a given character present in the analyzed image (for the analyzed cases r = 31), c - the number of characters recognized incorrectly, e – the number of characters recognized correctly, k – the number of characters that were not recognized but were searched ( k = r - e ), f - the number of all characters present in an image (for the analyzed cases f = 660). In the case of the analyzed images and the assumed values of the r and f parameters, formula (8) has the following form:
_ c + ( 31 - e ) 660
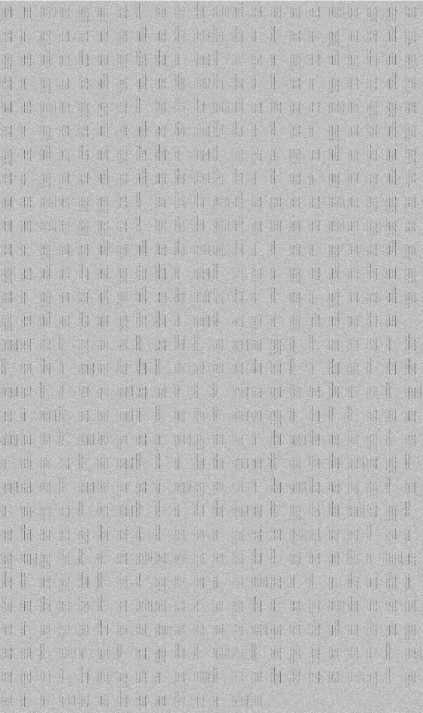
Fig. 12. An example of an analyzed image containing letter characters of special font 1, SNR 6dB .
The results of the analyses demonstrate that the degree of similarity between characters of special fonts is much higher than that between characters of standard fonts. This greatly affects the possibility to identify characters in images.
A high degree of similarity between characters translates into a large number of errors defined by the CER . In the case of special fonts, the values are 300 . 10 - 3 or 400 . 10 - 3 (table 4) and in the case of standard fonts - only 60 . i0 - 3 (table 5).
-
VI. Conclusion
The article presents the shapes of special font characters and their influence of the forms of graphic characters reproduced from undesirable emission signals.
The source of signal emission was a laser printer and the signal was recorded in the course of printing of a text document.
Table 4. CER values for special fonts, for SNR = - 6 dB
|
Character |
Special font 1 |
Special font 2 |
Special font 3 |
|
a |
280 |
589 |
221 |
|
b |
127 |
115 |
182 |
|
c |
484 |
654 |
170 |
|
d |
68 |
409 |
163 |
|
e |
433 |
715 |
314 |
|
g |
46 |
105 |
61 |
|
h |
92 |
221 |
131 |
|
i |
10 |
430 |
19 |
|
k |
284 |
211 |
34 |
|
l |
5 |
278 |
151 |
|
n |
426 |
443 |
430 |
|
o |
311 |
693 |
577 |
|
p |
299 |
178 |
341 |
|
r |
3 |
615 |
370 |
|
s |
267 |
640 |
166 |
|
t |
139 |
161 |
24 |
|
u |
387 |
438 |
316 |
|
y |
66 |
76 |
54 |
|
z |
358 |
418 |
267 |
Table 5. CER values for special fonts, for SNR = - 6 dB
|
Character |
Arial |
Times New Roman |
|
a |
5 |
7 |
|
b |
0 |
14 |
|
c |
73 |
24 |
|
d |
0 |
0 |
|
e |
7 |
14 |
|
g |
5 |
0 |
|
h |
3 |
34 |
|
i |
53 |
46 |
|
k |
5 |
5 |
|
l |
143 |
8 |
|
n |
49 |
87 |
|
o |
32 |
51 |
|
p |
3 |
5 |
|
r |
34 |
27 |
|
s |
2 |
2 |
|
t |
7 |
12 |
|
u |
5 |
14 |
|
y |
0 |
2 |
|
z |
5 |
5 |
The reproduced special font characters were compared with standard font characters (Arial and Times New Roman). The results of the analyses demonstrate the presence of a strict relationship between the form of a letter character and the possibility of its reproduction by rastering from recorded undesirable emission signals. Traditional font letter characters have many graphic elements that make them different from one another.
Those elements are serifs, heels, rounded elements, arches, etc. Special font characters, being as simple as possible, contain no such elements. Also, they consist only of vertical and horizontal lines. Such details are of great importance to the degree of similarities between letter characters. The high level of correlation between such characters makes it impossible to distinguish between different characters on the receiving side. This is demonstrated both in a visual analysis and in a numerical analysis based on determination of RZthr threshold values of the character correlation coefficient that require recognition of at least 90% of all the characters being searched RZ values for the reference character and the part of the analyzed image that are greater than the RZ thr value determine recognition of the character being searched. However, in particular in the case of special fonts, this does not always indicate conformity of the reference character to the character contained in the analyzed portion of the image. Thus, the decision is incorrect. The indicated character is not present in the specific place in the image. Consequently, the value of the Character Error Rate parameter was calculated. The parameter indicates the degree to which special fonts are more resistant to recognition using the correlation method or, in other words, how many incorrect decisions are made. The data obtained demonstrates much higher resistance of special fonts to correct recognition of characters. The CER values for those fonts were equal to approximately 400 ⋅ 10 - 3 , compared to 60 ⋅ 10 - 3 in the case of standard fonts. This phenomenon can be used when designing computer font characters to be used in electromagnetic protection of classified information. The first such fonts are indicated in the article. This problem is particularly important given the common use of computers for processing classified information in having the form of text documents.
References The Unwanted Emission Signals in the Context of the Reconstruct Possibility of Data Graphics
- Kubiak I., “Possibilities of reconstruct of data text from unwanted signal emissions using character correlation method – standard DVI”, Telecommunication Review and Telecommunication News, 2014-2-3.
- Kubiak I., “Digital processing methods of images and signals in electromagnetic infiltration process”, Image Processing and Communications, vol. 18, no. 1, pp. 5-16, 2013, DOI: 10.2478/v10248-012-0070-7, ISSN: 1425-140X.
- Kubiak I., Grzesiak K., Musial S., Przybysz A., ?The generator of half-tone screening for the process of electromagnetic infiltration”, Military University of Technology 2012, ISBN 978-83-62954-28-5.
- Kubiak I., “Identification of waveforms for electromagnetic fields on the basis of its measurements within a confined bandwidth of reception”, PhD Thesis 2000.
- Kubiak I., “Analysis methods and digital processing images in electromagnetic infiltration process”, Military University of Technology 2013, ISBN 978-83-62954-86-5.
- Richard G. Lyons: Understanding Digital Signal Processing (2nd Edition), 2004.
- Zielinski T.: “Digital Signal Processing”, Communication and Transport Publisher, 2009.
- Deok J. Park, Kwon M. Nam: “Multiresolution Edge Detection Techniques, Pattern Recognition”, Vol. 28, 1995.
- Pratt K.: “Digital Image Processing”, Wiley& Sons, New York 1978.
- Michael J. McCarthy, “The Pentagon worries that spies can see its computer screens, someone could watch what’s on your VDT”, The Wall Street Journal, 07.08.2000.
- Allen R. L., Mills D., “Signal Analysis: Time, Frequency, Scale, and Structure”, 2004.
- Hong Zeng, Dual image processing algorithms and parameter optimization, Seventh International Conference on Natural Computation (ICNC), Shanghai 2011, Conference materials volume 2, p.946-950, ISSN 2157-9555.
- Sohi D.S., Application to enhance the teaching and understanding of basic image processing techniques, Southeastcon 2000, Naswille, p. 413-416, ISBN 0-7803-6312-4.
- Mitra S.K., Image processing using quadratic volterra filters, 5th International Conference on Computers and Devices for Communication (CODEC), Kolkata 2012, ISBN 978-1-4673-2619-3.
- Grzesiak K., Przybysz A., “Emission security of laser printers”, MCC 2010: Military Communications and Information Systems Conference, Wroclaw 2010.
