The value of temperature indicators, osmotic and acid activity of drug solutions for their local toxicity

Author: Ruziyev A.M., Qambarov Z.G., Muminov B.E., Ergashev X.M.
Journal: Экономика и социум @ekonomika-socium
Section: Основной раздел
Article in issue: 4-1 (95), 2022.
Free access
Multiple intravenous injections and infusions of various drugs, carried out during anesthesia and resuscitation care and intensive care for patients in an anesthesiologyresuscitation department, require adequate intravascular access. long-term presence of catheters inside peripheral veins is often accompanied by the appearance of local postinjection complications, among which phlebitis and venous thrombosis, often combined with occlusion of intravascular catheters, remain practically "habitual". A poorly studied factor of blockage of catheters and veins may be the mechanical and physicochemical aggressive effect of catheters and infusion media on the venous wall, since a similar aggression of injection needles and drugs against fiber is shown with subcutaneous injections.
Temperature range, ph, osmotic activity, phlebitis, thrombophlebitis, occlusion of intravascular catheters
Short address: https://sciup.org/140292830
IDR: 140292830
Text of the scientific article The value of temperature indicators, osmotic and acid activity of drug solutions for their local toxicity
Determining the range of temperature, pH, osmotic activity, as well as a list of drug solutions, administered intravenously to patients during anesthesiology and resuscitation allowances.
A retrospective study of the contents of 144 patient records allowed specify the list, the amount of medicines and the frequency injections into a vein, during course treatment, factory readiness of drugs for their safe introduction into a vein, into the pancreas, as well as some reasons development of post-injection infiltrates and phlebitis.
Most often, drugs were prescribed in the form of intravenous injections, intramuscular injections were prescribed 5 times less often, and subcutaneous injections - 10 times less than intravenous. List of medicinal drugs prescribed to patients in the form of intravenous injections, amounted to 80 titles. Therefore, inpatient treatment of adults patients in the anesthesiology-reanimation department included a mandatory daily injection into the blood through venous access several medicinal products in dosage forms ready for injection both simultaneously 2 - 3 -4 times a day, and continuously for several days in a row, practically without taking into account difference in age, body weight.
With the help of a thermal imager, we found out the temperature range solutions of drugs injected into a vein (photo 1). Shown, that the temperature in the resuscitation ward in its different places varies within from (23.30±0.07) °С to (25.10±0.07) °С, and the average temperature of all intravenous solutions is (24.2±0.07) °C, n=5 at P=0.95.
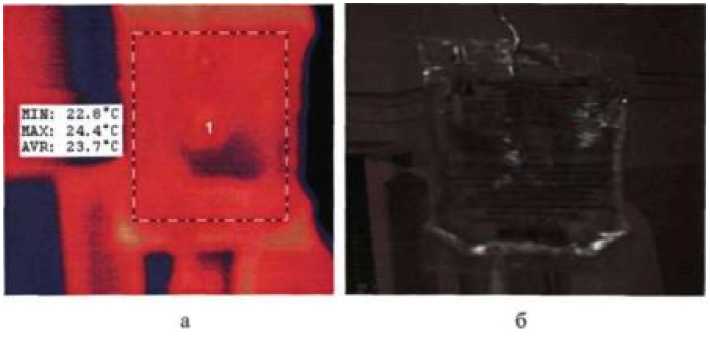
Photo 1. Image in the infrared (a) and visible (b) range of the spectrum radiation container with a solution of 0.9% sodium chloride volume of 250 ml prepared for intravenous administration.
In addition to temperature, studies of osmotic and acidic activity of drugs injected into the vein. The results are shown in table 1.
Thus, the range of revealed pH values of ready-made solutions for intravenous injections was between pH 4.00±0.09 and 8.80±0.08, and the range of osmolarity values was between 17.4±0.5 and 3450±12.7. In other words, modern high-quality solutions designed for intravenous injection, may not have a pH of 7.4 and an osmolarity of 280 mOsmol / l, that is, the solutions introduced into the blood are hypo-, normo- and hyperosmotic, as well as acidic and alkaline, as they do not have a pH 7.0.
Additionally, using cefoperazone sodium as an example, we the osmotic activity of solutions prepared by dissolving 1 g of dry powder of this antibiotic with various volumes of solvents such as water for injection, 0.9% sodium solution chloride, 5% and 10% glucose solutions.
Table 1
Indicators of osmoticity and acidity of ready-made solutions medicines
|
No. |
drug solution |
Osmolarity(mOsm/L) |
pH |
|
1 |
Solution 0.9% sodium chloride 500 ml |
308±1.5 |
5.20±0.09 |
|
2 |
5% glucose solution 500 ml |
280±1.5 |
4.10±0.09 |
|
3 |
Reamberin |
345±1.5 |
6.00±0.09 |
|
4 |
Aminoplasmal E 10% 500 ml |
1030±2 |
5.00±0.09 |
|
5 |
Solution of 4% sodium bicarbonate 300 ml |
- |
8.20±0.09 |
|
6 |
Solution of 50% metamizola sodium 2 ml |
3450 ± 12.7* |
6.10±0.09 |
|
7 |
Solution 0.5% dopamine 5 ml |
- |
4.00±0.09 |
|
8 |
Solution 2.4% euphyllin 10 ml |
- |
8.80±0.08 |
|
9 |
A solution of 25% about magnesium sulfate 5 ml |
1164 ±10.4* |
5.20±0.09 |
|
10 |
Novocaine 0.25%) 50 ml |
17.4±0.5 |
4.35±0.08 |
Note: *-significantly at p<0.05 (n=5) compared with osmotic activity of a diluted solution of the corresponding drug facilities.
It has been shown that the dissolution of the same dose of antibiotic different solvents and/or different volumes of the same solvent leads to solutions with different osmotic activity. In this case, the value of the osmotic activity of solutions increases as the total concentration of substances in the solution increases. It has been shown that the dissolution of the same dose of antibiotic by different solvents and/or different volumes of the same solvent leads to obtaining solutions with different osmotic activity. At the same time, the value of the osmotic activity of solutions increases as an increase in the total concentration of substances in solution.
table 2
Osmotic activity (mOsm / l of water) solutions containing different concentrations of cefoperazone sodium
|
No. p/n |
Name of the medicinal product |
Osmotic activity (mOsm/lwater) |
|
one |
Solution of 1 g of cefoperazone sodium and 100 ml of water for injection (1% solution) |
36.0±0.6 |
|
2 |
Solution of 1 g of cefoperazone sodium and 100 ml of 0.9% sodium chloride (1% |
330.0 ± 7.2* |
|
solution) |
||
|
3 |
Solution of 1 g of cefoperazone sodium and 100 ml of 0.5% glucose (1% solution) |
230.0+ 6.3* |
|
4 |
Solution of 1 g of cefoperazone sodium and 100 ml of 10% glucose (1% solution) |
630.0 ± 10.1* |
|
five |
Solution of 1 g of cefoperazone sodium and 10 ml of water for injection (10% solution) |
495.0 ± 8.1* |
|
6 |
Solution of 1 g of cefoperazone sodium and 10 ml of 0.9% sodium chloride (10% solution) |
805.0 + 9.5* |
|
7 |
Solution of 1 g of cefoperazone sodium and 10 ml of 0.5% glucose |
535.0 ± 7.2* |
|
8 |
Solution of 1 g of cefoperazone and 10 ml of 10% glucose (10% solution) |
1200.0+ 12.0* |
Note: *-significantly at p<0.05 (n=5) compared with osmotic activity of a solution of 1% cefazolin sodium in water for injection.
So a solution of 1% cefoperazone sodium, obtained by dissolving 1 g dry powder in 1000 ml of water for injection, or in 1000 ml of a 0.5% solution glucose, hypoosmotic, while a solution of 1% beta-lactam antibiotic obtained by dissolving 1 g of antibiotic powder in 1000 ml a solution of 0.9% sodium chloride or 10% glucose is hyperosmotic. So and increase in the concentration of cefoperazone sodium from 1 to 1-0% due to reducing the solvent volume from 100 to 10 ml is accompanied by an increase in the osmotic activity of solutions up to 1200 mOsm / l of water.
Thus, it has been shown that in the department of anesthesiology and resuscitation, drug solutions are repeatedly administered intravenously in large volumes (more than 500 ml) with a significant range pH and osmotic values. Moreover, pH and osmoticity in many cases, are not reflected on labels, packages and instructions for medical use of drugs. Moreover, breeding drugs in itself changes their osmotic activity, and the result of dilution depends on the solvent.
Dynamics of heat radiation of the upper limbs of patients before, during time and after intravenous administration of drug solutions products with different values of acidity, osmoticity and temperature
When examining the temperature of the limbs of patients with trauma, we NEC ТН91ХХ brand thermal imager (Japan) was used, which allows real-time record the dynamics of temperature changes selected area of the patient's body simultaneously at several points (photo 2). It is shown that the intact area of the intended injection site solutions of drugs into the saphenous veins of the extremities the patient is characterized by heterogeneity of temperature indicators with a difference in average temperatures of (1.90±0.07)°С (Р<0.05, n=5).
Moreover, the higher temperature is characteristic mainly for flexion and internal, and lower for distal and outer surfaces of the limb. It should also be noted that higher temperaturedetermined in the area of passage superficial blood vessels, such as saphenous veins (photo 3)
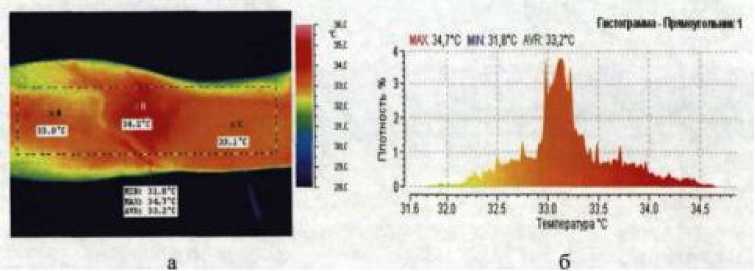
3.3.1. Photo of the intact right hand in the area of the cubital fossa Photo Photo 2. Patient D. 28 years old in the infrared range of the radiation spectrum (a) and a diagram showing the temperature distribution in the selected parts of the hand (b)..
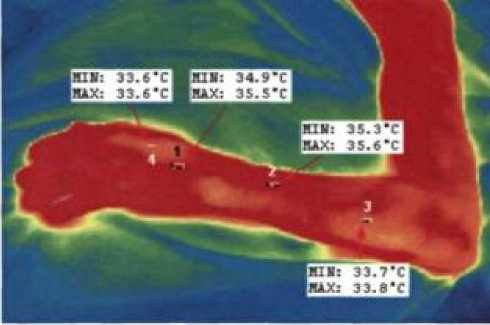
Photo 3. Photograph of the left hand of patient I. at the age of 59 in infrared range indicating the temperature range in the areas passage of the saphenous vein (points 1 and 2) and areas without veins (3 and 4).
From the above data it follows that at normal temperature body (36.60±0.2)°С and environment (24.00±0.07)°С, upper values average temperatures of the area of the proposed intravenous injection drug solutions does not exceed (34.50±0.2)°C (n=5 at R =0.95). _
At the next stage of the research, we measured the local temperature in the area of the cubital vein injection before, during and after intravenous administration of drug solutions, which showed that the introduction of drug solutions at “room temperature” (23.00 ± 0.2) ° C into the vein always causes a decrease in the temperature status of tissues, and the higher the infusion rate, the higher the infusion rate (photos 4, 5 and Table 2). drug "room temperature" dependsprimarily on the speed of its introduction.
Photo 4. Image of the right forearm of patient S. 33 years old in the infrared range of the radiation spectrum before the infusion of a solution of 0.9% sodium chloride "room temperature" into the cubital vein (a) with a temperature distribution diagram (b). For example, cooling the area under study to 30 ° C occurs at the rate of injection of 0.9% sodium chloride solution 2 ml per minute after 7 minutes, and increasing the rate of injection of the solution to 10 ml per minute cools this zone after 2 minutes. At the same time, intravenous infusion at a rate of 1 ml per minute, even after 7 minutes of observation, does not result in cooling to 30°C.
Photo 5. Image of the right forearm of patient S., 33 years old, in the infrared range of the radiation spectrum 4 minutes after the start of the infusion of the solution at a rate of 3 ml per minute (a) with a diagram of the temperature distribution of the selected area (b). To determine the reason for the cooling of the catheterization area, we have clarified the temperature range of the solutions used for intravenous administration and peripheral vascular catheters. It was determined that the temperature characteristics of solutions and catheters depend on the temperature conditions of their storage. It was revealed that the temperature in the resuscitation ward in its different places varies from 23.30±0.07 °С to 25.10±0.07°С. Therefore, the average temperature of all intravenous of injected solutions of "room temperature" is (24.2±0.07)°C, n=5 at P<0.05 (photo 5). To prevent cooling of the catheterization area during infusion therapy the next day, we preheated the solution to 38°C (Photo 6 and Table 3). veins at low injection rate.
Table 3 Change in the average temperature of the area of injection of the saphenous vein of the upper 1/3 of the forearm under the influence of an intravenously administered solution of 0.9% sodium chloride "room temperature" in a volume of 200 ml at different rates
|
Speed infusion(ml/min) |
Change in the average temperature of the catheterization area during intravenous infusion (°C) |
|||
|
before infusion |
in 2 minutes |
in 4 minutes |
after 7 minutes |
|
|
one |
33.2±0.2 |
31.9±0.3* |
31.3±0.2 |
31.1±0.1 |
|
2 |
33.2±0.2 |
31.1±0.2 |
30.9±0.1* |
30.2±0.2 |
|
3 |
33.2±0.2 |
30.6±0.2 |
30.1±0.2 |
29.7±0.2 |
|
6 |
33.2±0.2 |
30.0±0.1 |
29.3±0.2 |
27.9±0.2 |
|
10 |
33.2±0.2 |
29.1±0.1 |
27.5±0.3* |
26.8±0.1 |
Note: * - significant at n=5, P<0.05
Photo 6. Image in the infrared (a) and visible (b) spectral range of a container with a solution of 0.9% sodium chloride with a volume of 250 ml, prepared for intravenous administration.
Photo 7. Image in the infrared (a) and visible (b) range of the radiation spectrum of a container with a solution of 0.9% sodium chloride with a volume of 250 ml, preheated to 38°C.
Only jet injection at a rate of more than 10 ml per minute increases the average temperature of the saphenous vein catheterization area by (0.6 ± 0.2) ° C, n=5 at P<0.05. It is known that some finished drugs for intravenous injection cause a burning sensation in patients when injected into the blood, which appears a few seconds after the start of administration and disappears 1-1.5-3 minutes after the end of the drug administration. One of these finished products is a solution of prednisolone 30 mg/ml. We carried out a thermal imaging observation of the area of catheterization of the saphenous vein of the forearm in 5 patients with a jet injection of 2 ml of a solution of prednisolone, previously diluted in 5 ml of a solution of 0.9% sodium chloride at a temperature of +25°C (photo 7). namely +25°C, led to a short-term decrease in the average skin temperature along the vein, and after 5 minutes - to its increase by (0.7±0.2)°C from the initial values, n=5 at P=0.95.
Table 4Change in the average temperature in the injection area of the saphenous vein of the upper 1/3 of the forearm under the influence of an intravenously administered solution of 0.9% sodium chloride at a temperature of 38°C in a volume of 200 ml at different rates Note: * - significant at n=5, P<0.05.
|
Speed infusion(ml/min) |
Change in the average temperature of the catheterization area during intravenous infusion (°C) |
|||
|
before infusion |
in 2 minutes |
in 4 minutes |
after 7 minutes |
|
|
one |
33.b±0.2 |
33.0±0.2 |
32.7±0.2 |
31.9±0.1 |
|
2 |
33.6±0.2 |
33.3±0.1 |
32.9±0.2 |
32.5±0.3 |
|
3 |
33.6±0.2 |
33.4±0.3* |
33.1±0.1 |
32.8±0.2 |
|
6 |
33.6±0.2 |
33.5±0.2 |
33.3±0.1* |
33.4±0.2 |
|
10 |
33.6±0.2 |
34.2±0.2 |
34.1±0.2 |
33.8±0.2 |
Photo 8. Images of the right forearm of patient S. 37 years old in the VIR range of the radiation spectrum before inserting a catheter into the saphenous vein (1), after 30 seconds (2), after 2 minutes (3) and after 5 minutes (4) after intravenous administration of a solution of prednisolone through earlier installed catheter.
In this regard, we analyzed the passport of this solution to determine its side effects on the vascular wall, indicated by the manufacturer of the solution. According to the instructions for use of the drug prednisolone (manufacturer "Indus Pharma Pvt. Ltd", India), intravenous administration may be accompanied by burning, numbness, pain, tingling at the injection site, necrosis and scarring of the surrounding tissues. At the same time, the instructions do not indicate the causes of these complications, as well as measures for their prevention. In the study of the physicochemical characteristics of the drug prednisolone (manufacturer "Indus Pharma Pvt. Ltd", India), the following indicators were revealed: osmotic activity 1220 ± 2 mOsm / l of water, pH 5.20 ± 0308. Thus, this drug is characterized by pronounced deviations of these indicators from the indicators of osmoticity (270-280 mOsm / l) and acidity (pH 7.35-7.45) of plasma and blood cells. In this regard, we carried out observations of the temperature regime of the injection area in patients with intravenous bolus slow injection of a solution of 10% cefoperazone sodium (Cefobide 1.0 from Pfizer Inc.) into the intact cubital vein at a temperature of 24°C with different indicators of osmotic activity due to the use of various solvents permitted by the manufacturer (according to the instructions for use of the drug). The results obtained are shown in Table 4. From the above data it follows that the intravenous administration of drug solutions with an osmotic activity of more than 500 mOsm / l of water (a solution of 1 g of cefoperazone sodium and 10 ml of 0.9% o sodium chloride, a solution of 1 g of cefoperazone and 10 ml of 10% glucose) is accompanied by reversible hyperthermia, the duration of which in the injection zone is the longer, the higher the osmotic activity of the solutions. Photo 9. Photograph of the right hand of patient V. at the age of 42 years in the infrared range of the radiation spectrum, taken 72 hours after vein catheterization and the start of multiple infusion therapy.
We carried out further observations in patients with already existing clinical manifestations of post-injection complications. such as hyperemia, swelling, soreness at the injection site or along the vein. It was found that the average skin temperature in the area of postinjection inflammation increased to 36.4±0.2°C (n=5, P<0.05). Moreover, hyperthermia is stable (photo 9).
Table 5Change in the average temperature of the injection site of the cubital vein after intravenous injection of 10 ml of a solution of 10% cefoperazone sodium at a temperature of 24°C, with different osmotic activity
|
Solution |
Change in the average temperature of the injection area (°C) |
||||
|
bringing |
30 minutes after injection |
1 minute after administrati on |
5 minutes after administratio n |
7 minutes after injection |
|
|
Solution 1g cefoperazone sodium and 10 ml of water for injection |
33.5±0.2 |
32.7±0.3 |
31.3±0.2 |
33.6±0.1 |
33.5±0.2 |
|
Solution 1g cefoperazone sodium and 10 ml of 0.9% sodium |
33.5±0.2 |
32.5±0.2 |
32.7±0.1 |
33.9±0.2 |
33.5±0.2 |
|
chloride |
|||||
|
Solution 1g cefoperazone sodium and 10 ml 0.5% glucose |
33.6±0.2 |
32.4±0.2 |
32.8±0.2 |
33.7±0.2 |
33.4±0.2 |
|
Solution 1g cefoperazone and 10 ml - 10% glucose |
33.4±0.2 |
32.b±0.1 |
33.1±0.2 |
34.0±0.2 |
33.6±0.2 |
Note: n=5, P<0.05
Conclusions. Thus, we have determined a clinically significant indicator of the onset of the stage of irreversible damage to the venous wall with repeated intravenous injections of solutions of hyperosmotic drugs, which manifests itself as persistent hyperthermia in the injection zone "along the vein", even despite the intravenous administration of cold drug solutions (solutions at room temperature). temperature, namely - at a temperature of + 24- + 26 ° С), which in the process infusion initially cool the veins surrounding their subcutaneous fat and the skin located above them.
References The value of temperature indicators, osmotic and acid activity of drug solutions for their local toxicity
- Dolina O.A. Anesthesiology and resuscitation: Proc. allowance / M.: Medicine, 1998. - 544 p.
- Evstratova K.I. Physical and colloidal chemistry: Proc. for pharmaceutical universities and faculties / K. I. Evstratova, N. A. Kupina, E. E. Malakhova. // M.: Higher school, 1990 - 487 p.
- Evtushenko N. S. Expert evaluation of drugs based on the results of state control / N. S. Evtushenko, A. I. Luttseva, N. V. Trius // Man and Medicine: IX Russian National Congress. - M.-2002.-S. 832.
- Zilber A.P. Medicine of critical conditions. - Petrozavodsk, 1995. -360 p.
- Ivanitsky G.R. Modern matrix thermal imaging in biomedicine // UFN. - 2006. - 176. - 1293-1320.
- Ivanova, L.B. Influence of the volume value, osmotic activity and temperature of drug solutions on their post-injection local toxicity to subcutaneous fat: Ph.D. dis. cand. honey. Sciences. - Ufa, 2009. - 21 p.
- Karamzin, S.S. Study of biophysical aspects of the spatial dynamics of fibrin clot growth in vitro: Ph.D. dis.cand. biol. Sciences. -M., 2010. - 22 p.
- Kasatkin A.A., Benderskaya E.Yu., Syutkina Yu.S. Film photography in the infrared spectrum of the injection area as a way to assess the local pharmacokinetics and pharmacodynamics of drugs. // Materials of the conference "Pharmacy and public health" (Ekaterinburg, February 17, 2009). Section: Pharmacotherapy. Ed. prof. L.P. Larionov. Yekaterinburg. pp. 120-121.
- Kasatkin A.A., Urakova N.A., Sokolova N.V., Ponomarev S.V., Tadzhiev R.I., Syutkina Yu.S. Artificial thermal contrasting of tissues
- to visualize them in the infrared range of the radiation spectrum. // Bulletin of the Ural medical academic science. - 2009. -№2. - S. 323-324.
- Karkishchenko N. N. Pharmacokinetics / N.N. Karkishchenko, V. V. Khoronko, S. A. Sergeeva, V. N. Karkishchenko // Rostov n / D .: Phoenix, 2001 - 384 p.
- Katsung B.G. Basic and clinical pharmacology: in 2 volumes. -Trans. from English-M.-St. Petersburg: Binom-Nevsky Dialect, 1998.-V.1 - 612 p.; T.2.-670 p.
