The Vologda region: prospects of territory's demographic development

Author: Shabunova Alexandra Anatolevna, Bogatyryov Anton Olegovich
Journal: Economic and Social Changes: Facts, Trends, Forecast @volnc-esc-en
Section: Social development
Article in issue: 3 (11) т.3, 2010.
Free access
The article considers the demographic situation in the Vologda region. Based on the results of variable demographic prognosis an analysis of its development prospects is made.
Vologda region, demographics, population projections, the population of work-age work capacity, productivity
Short address: https://sciup.org/147223205
IDR: 147223205 | UDC: 314.011(470.12)
Text of the scientific article The Vologda region: prospects of territory's demographic development
Since 1992 population of Russia has been annually declining. Region being the most adverse in terms of the demographic situation have lost time about 10 – 15% of their residents for this time1. The population of the whole country has decreased from 1992 to 2009 at 6.6 million (4.5%), where 4.9 million people is the share2 of 2000 – 2009.
Population decline is an unfavorable process for the country as a whole and for each of its region in particular. First, poor population size poses a threat to geopolitical catastrophe in the country with a large area3. Population density is already less than one person per square kilometer at two-thirds of Russian territory. Further reduction of the population will be the destruction factor of the state’s integrity, the national security of its citizens. Secondly, the reduction of the working age population will require significant effort to modernize production and improve productivity to maintain and increase the release of GDP.
The task of overcoming the demographic crisis is a priority for the country. Reducing the rate of attrition, population size stabilization and building environment for its growth are the
main objectives of population policy, outlined in the “Concept of long-term socio-economic development of the Russian Federation until 2020” 4 and “Concept of Demographic Policy of the Russian Federation until 2025” 5. According to these documents to enhance the effectiveness of taken measures, along with regional population programs since 2006 activities within the priority national projects in education, health and housing policies are implemented. However, current growth rates of fertility and mortality are low. It can be assumed that the annual population losses from natural attrition will take place in the near future.
The Vologda region is one of those regions, where demographic trends are similar to nationwide. Since early 2000’s the annual number of births has be en increasing in the region, since
2003 the annual number deaths has become fewer. Nevertheless, in the period from 2004 to 2009 the population decreased by 37 thousand people (2.9%), which is higher than the rate of population decline in the country over the same period (1.6%).
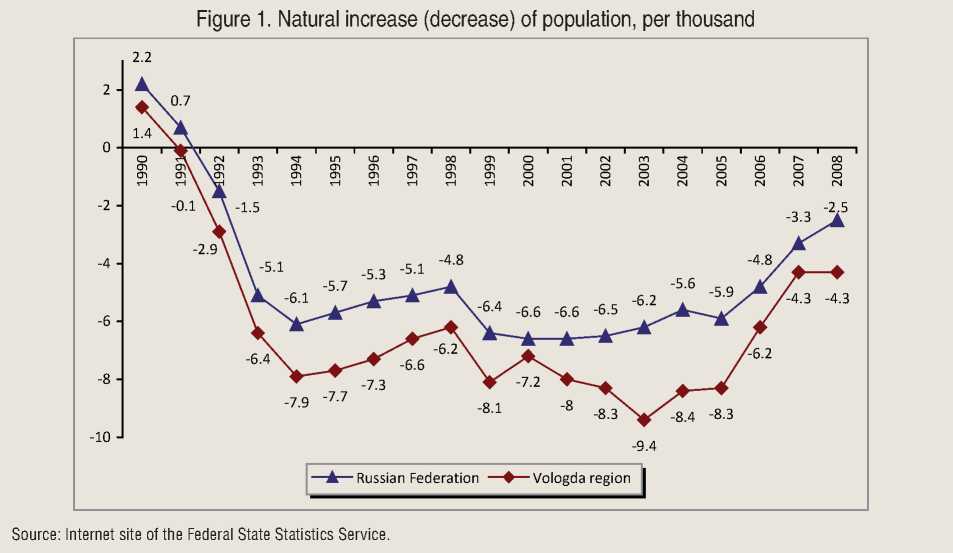
The current trend of population downsizing in the Vologda region originated in 1991. Its maximum value was recorded in 2003, after that the imbalance in the birth and death rates are gradually declining (fig. 1) .
The main reason for the conservation of natural attrition is high mortality rate of the population (tab. 1) . In 2007, this figure in the Vologda region has exceeded the birth rate 1.4 times. Based on the fact that in the period from 2002 to 2007 there was reduction of reproductive age women number from 346 to 336 thousand it can be assumed that in the medium term, the birth rate in the region will change slightly. Therefore, the basic steps to create a positive natural growth should be aimed at reducing overall mortality rate.
Low fertility and declining mortality would contribute to change the demographic structure – for example, reduce the proportion of orking-age population and an increase in the proportion of the population of retirement age.
Table 1. Vital statistics
|
Territory |
2002 |
2003 |
2004 |
2005 |
2006 |
2007 |
2008 |
|
The number of births per 1000 people |
|||||||
|
Russian Federation |
9.7 |
10.2 |
10.4 |
10.2 |
10.4 |
11.3 |
12.1 |
|
North-West federal district |
8.9 |
9.4 |
9.6 |
9.3 |
9.4 |
10.2 |
10.7 |
|
Vologda region |
10.1 |
10.4 |
10.7 |
10.5 |
10.9 |
11.6 |
12.0 |
|
Number of deaths per 1000 people |
|||||||
|
Russian Federation |
16.2 |
16.4 |
16 |
16.1 |
15.2 |
14.6 |
14.6 |
|
North-West federal district |
17.7 |
18.4 |
17.8 |
17.7 |
16.6 |
15.6 |
15.7 |
|
Vologda region |
18.4 |
19.8 |
19.1 |
18.8 |
17.1 |
15.9 |
16.3 |
|
Natural increase (decrease) per 1000 people |
|||||||
|
Russian Federation |
-6.5 |
-6.2 |
-5.6 |
-5.9 |
-4.8 |
-3.3 |
-2.5 |
|
North-West federal district |
-8.8 |
-9.0 |
-8.2 |
-8.4 |
-7.2 |
-5.4 |
-5.0 |
|
Vologda region |
-8.3 |
-9.4 |
-8.4 |
-8.3 |
-6.2 |
-4.3 |
-4.3 |
|
Source: Internet site of the Federal State Statistics Service. |
|||||||
A general idea of possible changes in the demographic situation gives a forecast of the population size and composition. The results of predictive studies can be used as an information base for regional policy, as well as an approximate estimate of its effectiveness. In addition, data on the number and composition of the population should be used in research on the socio-economic topics. The forecast identifies the most critical moments when additional government support is necessary for preventing demographic problems.
To study the demographic prospects of the Vologda region a predictive study of population size and composition for the period up to 2020 was held based on the advancing age method6. Reliability of the estimates got with the help of this approach is due to natural demographic feature: the near future of the population is embedded in its sex and age structure. I.e. for example in the construction of the medium-term forecast the majority of people is already known, the uncertainty lies only in the dynamics of individual demographic components (fertility, mortality, migration, etc.).
The forecast is made in four versions (inertial scenario, scenarios of management optimization, mortality reduction, fertility increase). Each of them takes into account possible changes in fertility, mortality and migration. Marriage and divorce rates of the population, as well as socio-economic factors (e.g., income, education, housing, etc.) were not explicitly considered. It can be assumed that their influence is reflected in the number of population births and deaths.
The inertial scenario assumes maintenance of the basic vital indicators – birth and death rates – in the period of forecasting (2008 – 2020) at the level of 2007 (forecast base year).
The scenario of management optimization is designed with a glance of target demographic policy presented in the program of the RF Gov-ernment7. According to this document, the total fertility rate increased from 1.45 (2008) to 1.6 (2012), and the mortality reduction is planned
Figure 2. Population size forecast of the Vologda region according to four different scenarios, thous. people
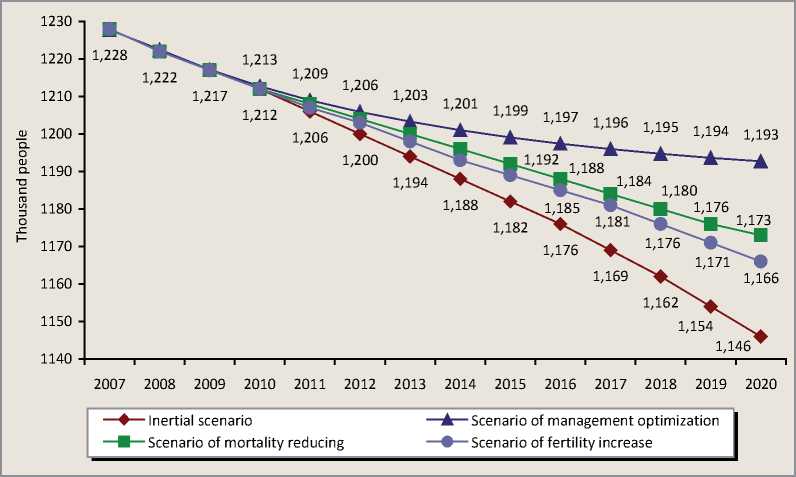
Sources: Age and sex composition of the Vologda region in 2007: stat. newsletter / Vologdastat. – Vologda, 2008. – 79 p.; population forecast results.
in several areas, particularly among workingage population by 9% (2012 to 2008). On these grounds a uniform annual change in the values of indicators and the goal achievements by the deadline (2012) are used in the prediction. Moreover, it is expected that the decrease in overall mortality may be the same rate as the population of working age. Further dynamics – from 2012 to 2020 – is based on a similar principle, in the assumption of population policy. In such circumstances, by 2020 the total fertility rate will be 1.9 and total mortality will decline by about 31% compared with the level of the forecast base year.
Scenarios for mortality reducing and fertility increasing are “short” versions of the management optimization scenario. That is the demographic measures in policies are implemented in them only in one direction – either mortality reducing or fertility increase. The value of one of the indicators remains static during the entire projection period at the level of 2007, and another is equally changed by the same rates as in the “full” version of the forecast. This provides the quantitative assessment of selected demographic measures.
The migration increase in the years preceding the base year was negligible (less than 0.1%), so in all the calculations there was an assumption that there is no migration during the whole projection period.
Under any of the considered options of the demographic situation development the population size of the region in 2020 will decrease relative to the indicator in 2007 (fig. 2, tab. 2) . The “lower” assessment in this forecast is the value of 1,146 thousand people by 2020 (inertial scenario), and the “upper” is 1,193 thousand people (scenario of management optimization). Within the boundaries of this interval are the forecasted values of population size, obtained by the scenario of mortality reducing and the scenario of fertility increase. This confirms the predominant role of comprehensive measures to improve the situation rather than unidirectional ones.
Comparison of different scenarios shows that the structure of the region's population in the current base year (2007) is extremely unfavorable. Even with support from the state significant deviation for the better is possible
Table 2. Variable demographic forecast for the Vologda region
|
Forecast scenarios |
Population size, thousands people |
Share of able-bodied population, % |
Economic burden, pers. of disabled age per 100 able-bodied persons |
||||||
|
2007 |
2012 |
2020 |
2007 |
2012 |
2020 |
2007 |
2012 |
2020 |
|
|
Inertial |
1,228 |
1,200 |
1,146 |
63 |
61 |
55 |
58 |
65 |
81 |
|
Management optimization |
1,206 |
1,193 |
60 |
53 |
65 |
87 |
|||
|
Mortality reducing |
1,204 |
1,173 |
60 |
54 |
65 |
84 |
|||
|
Fertility increasing |
1,203 |
1,166 |
61 |
54 |
65 |
84 |
|||
Sources: Age and sex composition of the Vologda region in 2007: stat. newsletter. – Vologda, 2008. – 79 p.; population forecast results; author’s calculations.
only after several years of population policy measures (in the chart the gap in forecast values of scenarios begins since 2010).
Throughout the whole forecast period the decrease of working age population is expected. Various scenarios of events show roughly the same values for this indicator, due to the length of the forecasting period. The number of working age people will be 729 thous. in 2012 and 636 thous. people in 2020 (when there were 776 thous. people in 2007).
One of the consequences of demographic structure change in the years 2008 – 2020 will be the reduction of working-age population share in the total population – the number of working age people will not exceed the number of disabled. Due to this the economic burden on the working age population will increase to about 84 disabled people per 100 able-bodied people.
By 2020 on any of the scenarios the proportion of persons aged 60 years and older will rise from 17 to 23%. According to the UN scale of population aging 8, the population of the area is considered “old” if the share of this category of people exceeds 7% of the total. In other words, in the period from 2008 to 2020 the population aging of the region will continue. The consequences of this process will be meaningful to the demographic (“base” for low fertility and high mortality), economic (slowdown in labor substitution, increase of load for working age population) and social (increased spending on social welfare, increasing pressure on social infrastructure) components of society.
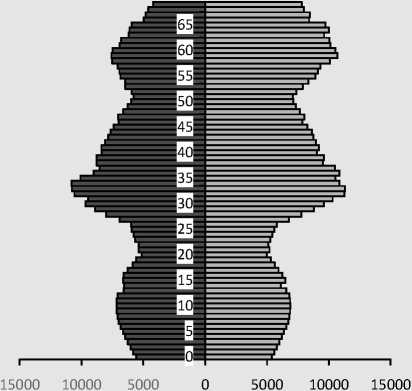
Age and sex pyramid based on the inertial scenario cases reflects the most likely changes in the population structure with preservation of natural reproduction regime of the current base year (fig. 3) . Asymmetrical forms of the pyramid in both cases show the uneven replacement of generations. The narrowed part of the pyramid in 2007 is the result of adverse demographic trends (low fertility, high mortality) in the past. For example, the “trough” in the age range from 5 to 10 years are people born in 1997 – 2002 (in this period there was a decrease in fertility and increasing mortality), from 60 to 65 years – generation of 1942 – 1947 (war and early postwar years).
In the years 2008 – 2020 further increases of gender imbalance is expected, according to which by the beginning of 2020, in the Vologda region there will be 100 women per 82 men (in 2007 – 85).The number of women of reproductive age in the region will be declining every year – an average of 17% for the entire period. In such circumstances, the birth rate can be raised only by revising the reproductive attitudes of the population to a greater number of children per family – two or three children or more 9 (currently the one-child family model dominates).
Economic potential of the Vologda region, as well as any other RF subjective depends, primarily, from human resources10. Additional research
Figure 3. Age and sex composition of the Vologda region (left – at the beginning of 2007, right – at the beginning of 2020, pers.)
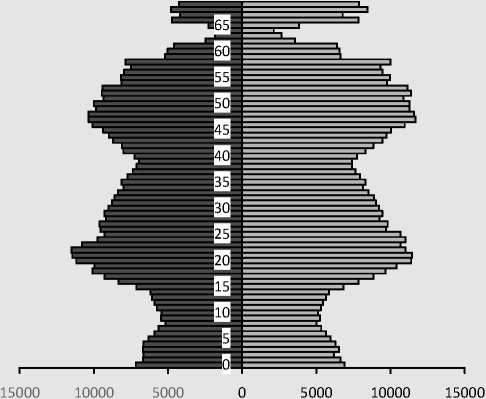
□ Men □ Women
□ Men □ Women
Sources: Age and sex composition population Vologda 2007: stat. newsletter / Vologdastat. – Vologda, 2008. – 79 p.; population forecast results.
in the context of districts of Vologda region was performed with emphasis on the possible dynamics of the working age population. For each of the municipalities a separate population forecast by the advancing ages according to the inertial scenario of the situation was built. Thus, we have obtained approximate number of prospective residents of working age in the districts and their contribution to the total workforce of the region.
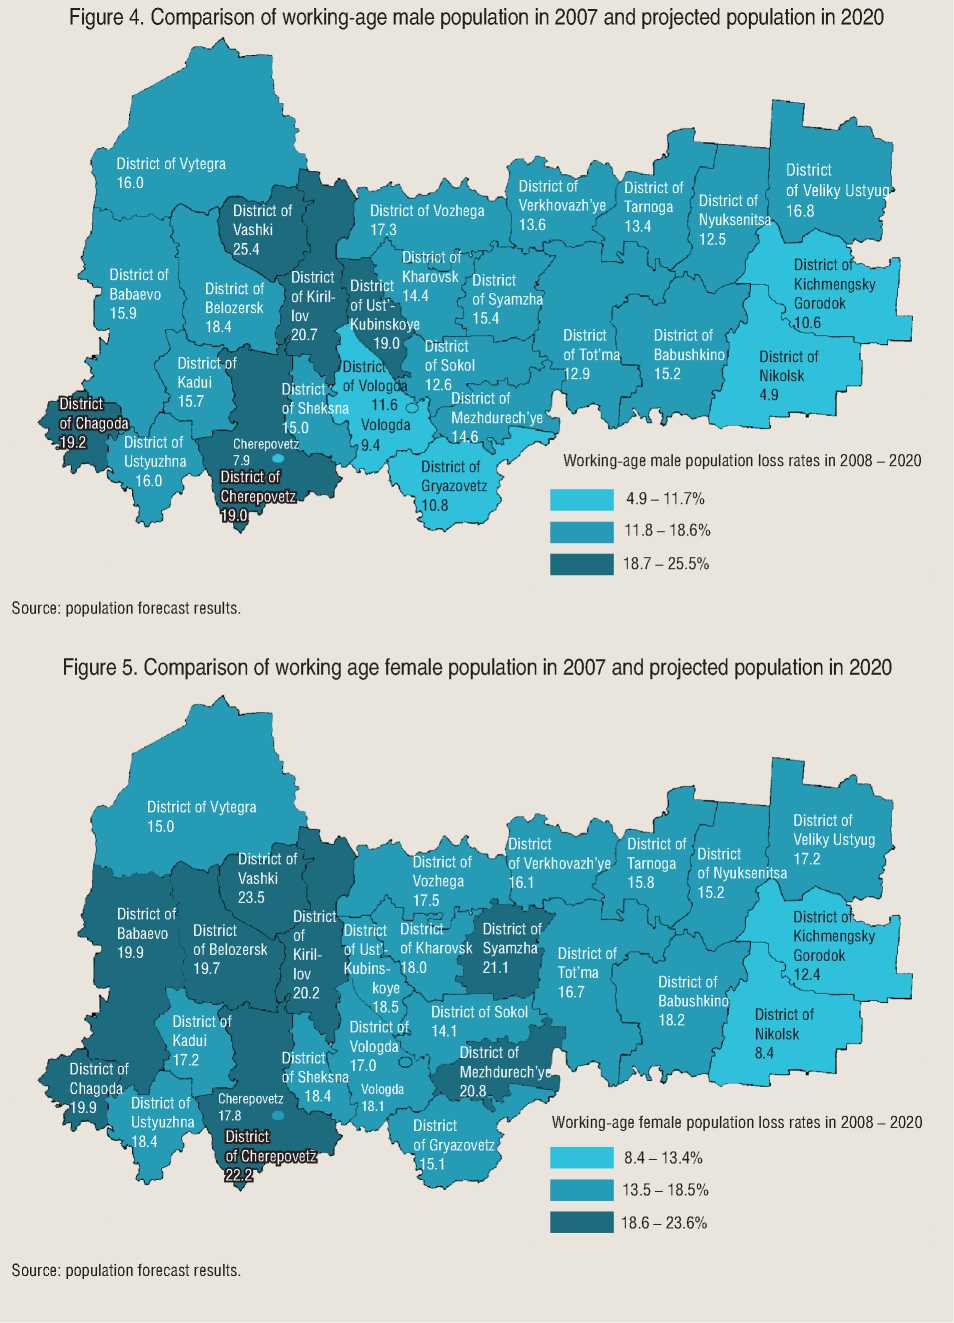
According to the forecast for the period from 2008 to 2020 in all municipalities of the region there will be reducing of working age population. The rates of decline in this category will differ both by the territorial and by gender basis (fig. 4, 5) . Changes in decline by the end of the forecasting period will make the following ranges: for male population – from 4.9% (Nikolsky district) to 25.4% (Vashkinsky region), the female population – from 8.4% (Nikolsky district) to 23.5% (Vashkinsky district).
By 2020, there will be no significant changes in the distribution of number of working age people in municipalities of the Vologda region. Much of the labor force will continue to be concen- trated in the cities of Cherepovetz (175 thous. people), Vologda (163 thous. people) and in the districts of: Velikiy Ustyug (32 thous. people), Vologda (27 thous. people), Sokol (27 thous. people), Gryazovetz (21 thous. people), Sheksna (19 thous. people), Cherepovetz (18 thous. people) and Vytegra (15 thous. people).
However, within each of the municipalities from 2008 to 2020 the population structure change is expected. Reducing the proportion of working-age population in the total amount will be from15% (Nikolskiy district) to 20% (Ust-Kubinskiy district). By early 2020 this figure will remain relatively high in the districts of Velikiy Ustyug (55% of the total population), Sokol (55%), Vologda (51%), Nikolsk (51%), Sheksna (51%), Totma (50 %), Gryazovetz (49%), Kichmenskiy Gorodok (49%), Tarnoga (49%), Nyuksenitsa (48%), as well as in the city of Vologda (53%) and Cherepovetz (53%).
As a result of the decline in the proportion of working-age population in the districts of the Vologda region there will be increase in the economic burden on this category of people. In most
4.9
11.7%
–
11.8
18.6%
–
District of Nikolsk 8.4
District of Nikolsk 4.9
District of Gryazovetz 10.8
District of
District of
Verkhovazh’ye Tarnoga
19.2
District
District of of Kharovsk Syamzha
18.0
21.1
District of Ust’-Kubins-
District of Ust’-
District of Tot’ma 16.7
District of Babaevo 15.9
District of Babaevo 19.9
District of
Vashki 23.5
District of Sheksna
District of Kirillov 20.2
District of Kharovsk 14.4
District of Tot’ma 12.9
District of Belozersk 18.4
District of Kirillov 20.7
District of Babushkino 15.2
District of Babushkino 18.2
District of Belozersk 19.7
Vologda 18.1
District of Tarnoga 15.8
District of
Veliky Ustyug
District of Vozhega 17.5
District of Chagoda
District of Nyuksenitsa 15.2
District of Nyuksenits 12.5
District of Ustyuzhna 16.0 1
District of Syamzha 15.4
District of Gryazovetz L15.1
District of Veliky Ustyu
District of Chagoda 19.9
koye
18.5 District of Vologda 17.0
ubinskoye к 19.0
District of
Ustyuzhna 18.4 •
District of Cherepovetz 19.0
District of Sokol
12.6
District of
1 Mezhdurech’ye
District of Kadui 15.7
District of Kadui 17.2
District of Vytegra 15.0
District of
Vashki 25.4
Cherepovetz 18.4 17.8
District of Cherepovetz h22.2
District of Vozhega 17.3
' District of Verkhovazh’ye
16.1
District of Vytegra 16.0
District of Sokol 14.1
District of
Mezhdurech’y
L 20.8
District •o of Sheksna 15.0 Cherepovetz
Source: population forecast results.
Figure 5. Comparison of working age female population in 2007 and projected population in 2020
18.7 – 25.5%
Working-age female population loss rates in 2008 – 2020
8.4 – 13.4%
13.5 – 18.5%
18.6 – 23.6%
Source: population forecast results.
District of__n Kichmengsky Gorodok
12.4
Working-age male population loss rates in 2008 – 2020
District of Kichmengsky Gorodok
10.6
Figure 4. Comparison of working-age male population in 2007 and projected population in 2020
municipalities the value of the index will exceed 100 disabled-age people per 100 working-age people. The most significant predominance of non-working age population will be in the districts of Vashkino (129 disabled-age people per 100 working-age people), Vozhega (123 pers.), Kirillov (123 pers.), Chagoda (124 pers.) and Cherepovetz (134 people not accounting the city of Cherepovetz).
It follows from the projection that in no districts the demographic situation is optimal for the preservation or enhancement of a major component of the labor force. Reducing the number of working age people can become significant obstacle to further economic growth. Labor force shortage, which is not so evident during the crisis of economic phenomena, in the long term, will require compensation by increasing productivity, attracting a workforce from other regions of Russia and from abroad. Typically, the first way involves raising the technological level of production and labor reallocation between sectors. Demographic projection gives a quantitative value of the required increase in productivity.
In the period from 2005 to 2007 GRP growth rate of the Vologda region was relatively stable and amounted to an annual average of about 5%. If we assume that the employment rate of working age population over the projection period (2008 – 2020 years) will not change and will be equal to about 76%, then to maintain GRP growth rates, with the declining population of working age there will be required increase in labor productivity among the employed residents of working age by 131% (2020 to 2007, an average 7% per year).
In accordance with the “Concept of longterm socio-economic development of the Russian Federation until 2020” the planned GDP increase should be done in two phases: from 2007 to 2012 – 37% and from 2012 to 2020 – 64%. In order to increase the rate of the Vologda region GRP was comparable to the GDP of
Russia in the first phase there will be required an increase in productivity of the employed working-age population by 46% (2012 to 2007, an average of 8% annually), while in the second – by 88% (2020 to 2012, an average of 13% per year). For comparison: in the concept of the planned labor productivity increase in the first phase it is approximately equal to 40%, while in the second – 71%. In other words, under this approach higher rates of productivity growth would be required in the Vologda region than planned in the whole country.
Thus, in the medium term (13 years) the number of the population will reduce and its structure will deteriorate. In some municipalities in the effect of lowering the number may be: increased migration outflow, an increase in the number and percentage of empty settlements decrease in the density of population, increase in the radius of the remoteness of settlements and, in general, reducing the capacity of spatial development 11. The deterioration of the population’s structure will create additional obstacles for increasing the birth rate (reduction of the number of women of reproductive age, the growth of gender disparities) and mortality (“aging” of population, increasing population pressure on the working age population).
Currently, a chance of overcoming the demographic decline still remains. This will require comprehensive measures to improve the ideological and spiritual (socio-psychological state) of Russian society, the strengthening of a national (civilizational) identity of the Russian state, improving the quality of public policy (management of demographic processes) and social and material problems12. The question is, how timely would such actions be and what losses any delay threatens.
References The Vologda region: prospects of territory's demographic development
- Public policy of Russia’s pullout from the demographic crisis/ed. S.S. Sulakshin. -M.: Economy, 2007. -896 p.
- Demographical conceptual dictionary/ed. L.L. Rybakovsky. -M.: DSP, 2003. -352 p.
- The concept of demographic policy of the Russian Federation for the period up to 2025 : ratified by the Decree of the Russian Federation President of dated October 9, 2007 № 1351. -Access mode: http://mon.gov.ru/dok/ukaz/vosp/4202/
- Concept of long-term socio-economic development of the Russian Federation for the period up to 2020 : ratified by the Decree of the Russian Federation Government dated November 17, 2008 № 1662-p. Access mode: http://www.economy.gov.ru/minec/activity/sections/strategicPlanning/concept/
- Practical demography/ed. L.L. Rybakovsky. -M.: DSP, 2005. -280 p.
- Spatial aspects of the region’s development/under the general ed. of V.A. Ilyin. -Vologda: VSCC CEMI RAS, 2008. -298 p.
- Population reproductive potential of the region: status, trends prospects/team of authors led by V.A. Ilyin. -Vologda: VSCC CEMI RAS, 2005. -208 p.
- The central statistical database of the Federal State Statistics Service . -Access mode: http://www.gks.ru
- Antonov A.I., Borisov V.A. The population dynamics of Russia in 21 century and priorities of population policies. -M., 2006. -192 p.
