Thermal image analysis and segmentation to study temperature effects of cement and bird deposition on surface of solar panels

Author: Akash Singh Chaudhary, D.K. Chaturvedi
Journal: International Journal of Image, Graphics and Signal Processing @ijigsp
Article in issue: 12 vol.9, 2017.
Free access
To obtain solar energy from solar photo-voltaic panels is not a new task now a days. Solar panels are designed to give their maximum possible output when exposed to the solar radiations. The operating conditions of solar panels affected by the atmospheric conditions like dust, dirt, solar INSOLATION, temperature etc. Here the effect of cement and bird deposits on the surface of solar panels is considered. Temperature rise due to cement and bird deposits develop hot-spots and affects the electrical power output of the solar panel. The cement and bird deposits can be seen by visually on solar panel surface but their effect can not be visualized by naked eye. The infrared THERMOGRAPHY helps to analyze these effects by using thermal imaging camera. This paper focus to study the temperature effects of cement and bird deposition on solar panel surface by capturing thermal images along with analyzing the thermal images using MATLAB digital image processing for better understanding. Image segmentation for cement and bird deposits is performed using watershed transform to achieve the desired region of interest from thermal images.
Bird deposits, Cement deposits, Image segmentation, Solar panels, Temperature effect, Thermal imaging
Short address: https://sciup.org/15015920
IDR: 15015920 | DOI: 10.5815/ijigsp.2017.12.02
Text of the scientific article Thermal image analysis and segmentation to study temperature effects of cement and bird deposition on surface of solar panels
Published Online December 2017 in MECS
-
I. Introduction
The area of renewable energy is becoming more popular today due to several drawbacks of the conventional sources of energy like green house gas emission, global warming, pollution etc. Solar energy is one of the preferred area among other non-conventional areas (wind energy, tidal, hydro, biomass, geothermal etc) due to the good availability of solar radiations in India [1]-[2]. Solar energy has been widely used in generation of power, industries, irrigation purpose [3] to fulfill the increment in the generation of energy demand [4]. India has good solar energy of about 4 - 7 kWh / m 2 and 5 x10¹⁵ kWh in a day and in a year respectively [5]-[6]. The earth and environment receive
radiation3.6x1024 Joules / year approximately [7]. The
solar solar cell converts these solar radiations into electrical energy. The solar panels are exposed to the open atmosphere and their surface is affected to many atmospheric conditions. The solar photo-voltaic panels which are subjected to dirt, snow covering, leaves dropping, cement deposits and bird deposits cause partial shading. If these depositions continue to remain present on the panel surface, heating of the affected area starts and may form hot-spots. The overall effect of these depositions either causes a huge power loss or may damage the solar panel. These problems can be avoided using blocking diodes up to certain extent [8]-[9].
The cement deposits and bird deposits are one of the important parameters to be considered when estimating the generated solar power output. The cement and bird deposits increase the temperature of solar cell and decrease the solar power output by a considerable amount. If these depositions remain to continue of solar panel surface, they may cause other problems in the solar cells/ modules like burn or damage of the panel surface. Therefore, the study of cement and bird deposition is important [10]-[11]. The thermal camera captures the radiated heat emitted by a object above absolute zero temperature. It represents the correct picture of the affected area by capturing thermal images. The thermal images represent the variation of temperature in a colorful pattern called as THERMOGRAMS [12].
-
II. Basics of Solar Cells and Solar Panels
The energy from sun is obtained in heat form and in light form. A solar cell converts light energy radiated by sun into electrical energy. A solar cell is the smallest element of a solar module, many modules are connected to form a solar photo-voltaic panel. The solar photovoltaic panels combine to form a photo-voltaic string and many photo-voltaic strings connected together are known as solar photo-voltaic array. The output current and output voltage of a solar cell is known as photo-voltaic output current and photo-voltaic output voltage. Fig. 1 and fig. 2 show solar cell and solar photo-voltaic panel respectively.

Fig.1. Solar cell
Fig.2. Solar photo-voltaic panel
The basic output current equation of a solar cell can be written as:
I pv = Iph - I O

X
— 1
V
-
V pv + I pv R se
V
R
sh
Where, Vpv is output voltage of photo-voltaic cell, Iph is photo-voltaic generated current, I 0 is reverse saturation current of diode, I D is diode current, V D is voltage drop across diode, Rse is series resistance, Rsh is shunt resistance, V T = (KT/q) is thermal voltage, K is Boltzmann constant, T is cell’s operating temperature in kelvin, q is charge of an electron, ɳ is quality factor of solar photovoltaic panel.
The two basic categories of photo-voltaic solar panels used are c rystalline silicon photo-voltaic solar panels and thin film photo-voltaic solar panels. Crystalline silicon photo-voltaic solar panels include MonoCrystalline and Poly-Crystalline. Thin film photo-voltaic solar panels include Cd Te (Cadmium TELLURIDE), CIGS (Copper Indium Gallium SELENIDE) and a-Si (Amorphous silicon) photo-voltaic solar panels [13].
-
III. Principle Of Thermal Imaging
In 1800 a German Astronomer, Frederick William Herschel discovered Infrared radiations [14]. In thermal imaging the infrared radiations emitted by any object are converted into a different color pattern of thermal images known as THERMOGRAM with the help of thermal camera. These THERMOGRAMS represent the variations of temperature in the thermal image [15]. The following fig. 3 shows the basic components of a thermal imaging system [16].
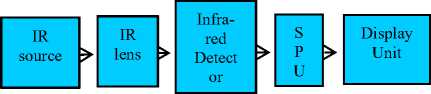
Fig.3. Basic components of a thermal imaging system
The principle of thermal imaging is based on the Stefan’s Boltzmann law, which states that the total radiant energy emitted by a black body is directly proportional to the fourth power of the absolute temperature given by equation E r= σƐT4 (watt/m2) where E r = Total radiant energy, σ= Stefan’s Boltzmann constant
(5.6697×10⁻⁸W/m2 K4), Ɛ= EMISSITIVITY of object, T= Absolute temperature of object. Thermal imaging can be used in monitoring as well as maintenance areas like detection of hot spots, failures, cracks, in solar panels, overheating problems in mechanical installations heating, leakage and insulation breakdown in pipes and valves etc [17].
-
IV. Operation on Matlab Digital Image Processing
An image (being a two dimensional function f(x,y) and amplitude f) having finite and discrete quantities of x,y and amplitude values of f is known as a digital image. The processing of these digital images by a digital computer is called digital image processing. Digital image processing is an emerging technique used in many fields like engineering, medical, agriculture, education etc. MATLAB is a programming language used for technical computing. Image processing toolbox is one of the frequently used functions in MATLAB [18]. Now a days thermal image processing is also becoming popular due its advantage of having a sharp idea of thermal images through image processing tool in MATLAB. It is useful in determining the high temperature by adding pseudo-colors to the thermal images. The dark colors basically represent the colder portions and bright colors represent the hot portions of the thermal images. The fusion of the original images and thermal images consisting pseudo-colors also used for better understanding of the affected part. The affected areas can be easily detected by using operations of digital image processing. There are many stages and algorithms involved during the processing of a thermal image from initial form to final form [19]-[20]. The digital image processing allows to analyze the captured thermal images against degradation effects, heated areas due to high temperature, quality of image. There techniques use in digital image processing for the analysis of thermal images after the data acquisition involve image filtering, image enhancement, image segmentation, feature extraction etc [21].
The flowchart shown in fig. 4 represents the basic operations used in digital image processing with MATLAB for thermal images analysis.
The fig. 4 shows that first step is to acquire data in the form of thermal image then apply second step of PEE-Processing. Noise is random variation in the color information or brightness in an image, which must be removed. Filtering involves reducing noise from thermal images using filters. Image enhancement involves sharpening, DEBLURRING of image. Next is to perform image segmentation to find the region of interest, edge detection. The feature extraction involves finding parameters like mean, standard deviation, variance, SKEWNESS, KURTOSIS etc. The last step is to classify the image [22]-[23].
There are many methods used for image segmentation like region based segmentation, edge detection, watershed transform segmentation etc. Use of watershed transform based segmentation is faster and simpler but involves problem of over-segmentation. This problem can be avoided by using markers in watershed transform approach. [24]-[26]. The digital image processing along with thermal imaging is helpful in studying the other fault effects of solar panels like cracks in cell, glass breakage, hot spots in cells, shadowing, broken ribbons, by-pass diode failure in photo-voltaic modules etc [27].
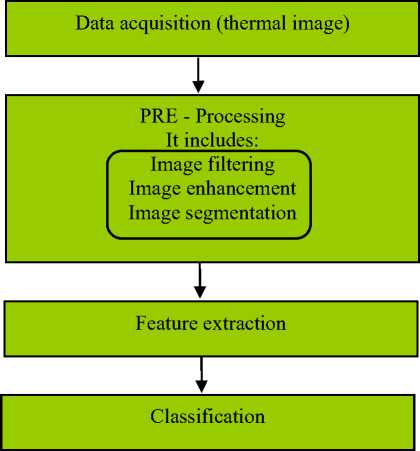
Fig.4 Basic operations used in digital image processing with MATLAB for thermal images analysis
-
V. Temperature Effects of Cement and Bird Depositions on Solar Panels
The cement and bird depositions allow only a part of solar radiations to convert into electricity, rest solar radiations help to increase temperature of the deposited surface area compared to non-deposited surface area and produces heat on the panel surface. This process causes overheating of solar cells which reduces electrical power output and efficiency of solar panels [28]-[30].
The intensity of infrared radiation is a function of temperature of an object, the high is the temperature, higher is the intensity of emitted infrared radiation. Thus area having high temperature has more infrared radiations and high loss of heat. So infrared radiations shows hotspots (portions having high temperature than other portions) which are not visible by naked eye and hidden portions of heat loss. Therefore temperature of cement and bird depositions is an indicator of solar panel health condition [31]-[32].
-
VI. Thermal Imaging Camera
The thermal imaging camera is a device to capture thermal images of any object without any physical contact. It uses principle of thermal imaging to detect the thermal radiations/ thermal heat emitted by any object above absolute zero temperature (-273°C). A thermal imaging camera can identify defects which are not visible by naked eye. The dark color in THERMOGRAM shows colder area while bright color shows the hotter area represented in terms of a temperature scale. The maximum temperature, minimum temperature, average temperature of area, temperature of a particular spot in thermal images, region based thermal image analysis can be performed using thermal image analysis software.
The fig. 5 shows KUSAM MECO Thermal imaging camera (Model TE-P) used in experiment with its specifications are mentioned in table 1.

Fig.5. KUSAM MECO Thermal Imaging Camera
Table 1. Specifications of thermal camera
Thermal Camera Info.
Type of Detector
Min. Focus distance
Value
UNCOOLED FPA MicroBOLOMETER 0.3m
Spectral range Measurement Temp.
Environment operating Temp.
Environment humidity
Accuracy
Thermal sensitivity Color palette Laser pointer
8-14μm
-20 °C to +350° C
-15 °C to +50 °C
≤ 90 % Non-condensing
± 2°C
≤ 0.1C @ 30 °C
11 Changeable
Class 2, 1mw/635 NANOMETER (red)
-
VII. Work Done for Temperature Effects of Cement and Bird Depositions on Surface of Solar
Panels
Location for Experiment
The experimental work to study the temperature effects for cement and bird depositions on surface of solar panels was performed on the roof of a building with solar panels installed and facing towards south direction. The building was surrounded by trees in plenty on eastern side and few on western side, there was a building on north side. The following fig. 6 shows the location of solar panels chosen for experiment.
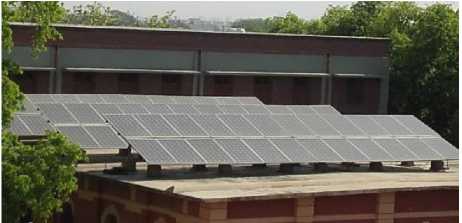
Fig.6. Shows location of solar panels for experiment
Total 72 solar panels were present on the roof of building forming 4 strings connected in parallel. Each string consisting of 18 serially connected solar panels.
The specifications of solar module is given as follows:
Company:
Module No.:
р maximum:
V ■ t open circuit:
т .
short circuit:
V mp:
I mp:
Max system voltage:
Bypass diode rating:
Max over current protection:
STC (Standard test conditions):
INSOLATION:
AM:
Cell Temp.:
BHEL
L20220
220 watt power
36 V
8.3 A
29 V
7.60 A
1000 V
15 A
15 A
1000 W/m2
1.5
25 °C
The measurements for experiment were done on Monday, 11.04.17 with load remain connected to solar panels. The instruments used for measurement were a KUSAM MECO clamp-meter with a THERMOCOUPLE (for current, voltage, temperature measurement), KUSAM MECO thermal imaging camera (for capturing thermal images), and digital solar PYRANOMETER (to measure solar IRRADIANCE). The weather conditions were measured using weather software from system with internet connectivity.
Small pallets of cement deposits and bird beat deposits were observed on few solar panels and rest of the panels were free from any deposit.
The experimental work performed to analyze temperature effects for cement and bird deposition on the surface of solar panels using thermal imaging was divided into two parts.
First part- A is to study temperature effects of cement and bird depositions on surface of solar panels using thermal imaging.
Secondly in part- B to analyze thermal image of cement and bird depositions using thermal image segmentation with MATLAB digital image processing.
-
A. To study temperature effects of cement and bird depositions on surface of solar panels using thermal imaging:
Cement deposits on solar panel surface:
As there was a newly constructed building on the northern side of solar panels, cement deposits were found on solar panels installed adjacent to it only. The cement deposits were irregular in shape and size with small and big pellets. The following fig. 7 shows surface of solar panels with cement deposits.
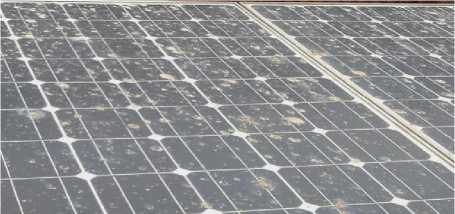
Fig.7. Shows surface of solar panels string 1with cement deposits
On Tuesday, 11.04.17 sunrise and sunset was at 5.58 am and 6.40 pm respectively. The sky was clear with dusty air in the atmosphere. The table 2 given below shows electrical and thermal measurements of cement deposits on solar panel surface for string 1.
Table 2. Measurement parameters of cement deposits on solar panel surface of string 1
|
Date |
Tuesday, 11.04.17 |
|||||
|
Time |
11.30 am |
12.30 am |
1.30 pm |
2.30 pm |
3.30 pm |
04.3 0 pm |
|
T cement deposit (ºC) |
50 |
51 |
47 |
48 |
43 |
40 |
|
T cement deposited cell (ºC) |
45 |
47 |
48 |
49 |
43 |
40 |
|
T cement deposited module (ºC) |
45 |
47 |
48 |
47 |
42 |
39 |
|
T solar panel string 1 (ºC) |
46 |
47 |
45 |
48 |
42 |
38 |
|
T ambient (ºC) |
35 |
39 |
40 |
41 |
38 |
37 |
|
I Output (A) |
0.63 |
0.61 |
0.45 |
0.35 |
0.19 |
0.05 |
|
V Output (V) |
572 |
566 |
565 |
572 |
576 |
571 |
|
P Output (kw) |
0.360 |
0.345 |
0.254 |
0.200 |
0.109 |
0.28 5 |
|
Solar IRRADI ANCE (w/m2) |
175.5 |
168.6 |
162.7 |
107.2 |
96.5 |
73.6 |
|
Humidity (%) |
17 |
12 |
10 |
11 |
11 |
11 |
|
Wind speed (m/s) |
NW 5.3 |
W 5.7 |
W 5.1 |
NW 5.7 |
NW 5.1 |
NW 7.2 |
|
Wind pressure (K Pa) |
101.0 |
100.9 |
100.9 |
100.7 |
100.7 |
100. 6 |
|
UV |
8 |
11 |
10 |
7 |
4 |
2 |
|
Visibility (km) |
6 |
6 |
6 |
6 |
6 |
6 |
The cement depositions increase temperature of cement deposited area, which causes heating and finally result into loss of electrical power output of solar panel.
The table 2 shows that when ambient temperature increases the temperature of three parameters (temperature of cement deposited cell, temperature of cement deposited solar module and temperature of solar panel string 1) increases. This increase in temperature of above three parameters cause heat loss and reduces electrical power output of the cement deposited solar panel string 1.
When ambient temperature decreases, temperature of all three parameters (temperature of cement deposited cell, temperature of cement deposited solar module and temperature of solar panel string 1) also decreases and an increment in electrical power output of solar panel string 1 is noticed. Temperature of cement deposits first increase and then deceases with ambient temperature because the increased temperature of cement deposits causes an increment of temperature of the deposited surface area of solar cell, so the temperature of cement deposits is used to heat the cement deposited solar cell. Again when ambient temperature increases and decreases the temperature of cement deposits increase and decrease with it. So temperature of cement deposits fluctuates with ambient temperature and temperature of cement deposited cell.
The following fig. 8 shows the curves for the temperature variation of cement deposits, cement deposited solar cell, cement deposited solar module and solar panel string 1 with respect to the ambient temperature mentioned in table 2.
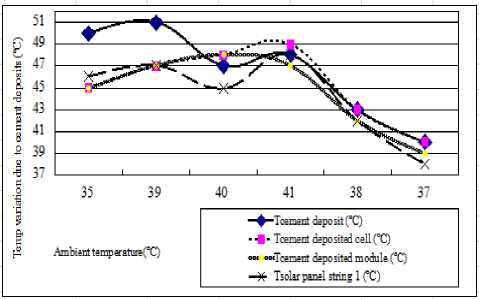
Fig.8. Shows curves for temperature variation of cement deposits, cement deposited solar cell, cement deposited solar module and solar panel string 1 with respect to ambient temperature mentioned in table 2
The fig. 8 shows variation of four temperature parameters with ambient temperature. The highest temperature of cement deposits was observed at 51(ºC) with corresponding ambient temperature as 39(ºC). The points on the curve at which temperature of cement deposits is high, the temperature of cement deposited cell and temperature of cement deposited module is also high. In curve the highest temperature of cement deposited cell was noticed to be 49(ºC) with highest ambient temperature 41(ºC). Temperature of cement deposited module and solar panel string 1 were highest at 48(ºC).
These curves show that temperature of cement deposits, temperature of cement deposited cell, temperature of cement deposited solar module, and temperature of solar panel string 1 are dependent on each other, which affect the electrical power output of solar panels and other degradation effects. The following fig. 9(a) and fig. 9(b) shows normal photograph and thermal image of cement deposits observed on solar panel surface for string 1. The temperature effect of cement deposits was not visible in normal photographs but thermal image shows the heating effect due to high temperature.
(a)
(b)
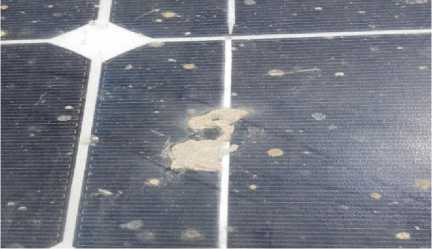
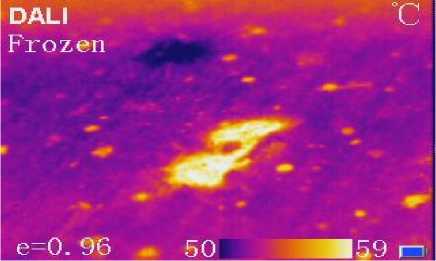
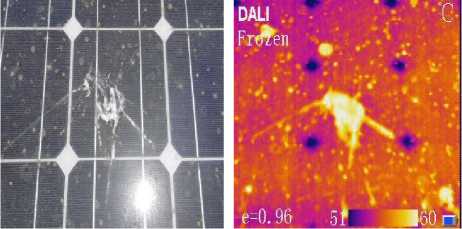
Fig.9.(a) and fig. 9(b) shows normal photograph and thermal image of cement deposits observed on solar panel surface for string 1
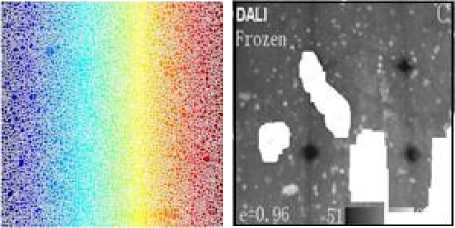
The fig. 9(b) is the thermal image of cement deposits showing a bright yellow colored cement deposit with maximum hot-spot temperature as 59ºC and minimum temperature of 50ºC. The dark blue color in image shows cold area of solar panel surface. Small pellets of cement deposits are also highlighted with bright yellow color representing hot points of deposits. These heating effects of temperature due to cement deposit are not visible in the normal photograph fig. 9(a).
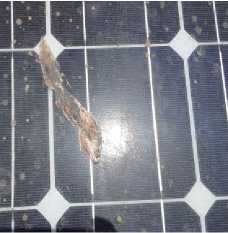
Bird deposits on solar panel surface:
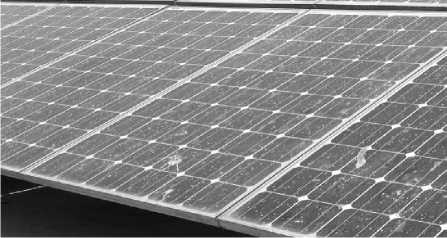
Fig.10. Shows bird deposits at three places on the surface of solar panel string 2
The bird deposits were observed at three places on the surface of solar panel string 2, which can be seen in the following fig. 10
The measurements of bird deposit only at one place was done (i.e., for bird deposit shown in fig. 12(a) only) on same day, on Tuesday, 11.04.17 with same atmospheric conditions. The sunrise and sunset was at 5.58 am and 6.40 pm respectively and sky was clear with dusty air. Table 3 shows electrical and thermal measurements of bird deposits on solar panel surface for string 2.
Table 3 Measurement parameters of bird deposit (shown in fig. 12(a) only) on solar panel surface of string 2
|
Date |
Tuesday, 11.04.17 |
|||||
|
Time |
11.30 am |
12.30 am |
1.30 pm |
2.30 pm |
3.30 pm |
04.3 0 pm |
|
T bird deposit (ºC) |
43 |
49 |
47 |
46 |
42 |
38 |
|
T bird deposited cell (ºC) |
42 |
43 |
45 |
47 |
42 |
37 |
|
T bird deposited module (ºC) |
42 |
45 |
46 |
44 |
41 |
39 |
|
T solar panel string 2 (ºC) |
44 |
48 |
46 |
45 |
43 |
38 |
|
T ambient (ºC) |
35 |
39 |
40 |
41 |
38 |
37 |
|
I Output (A) |
0.44 |
0.43 |
0.42 |
0.15 |
0.37 |
0.06 |
|
V Output (V) |
573 |
566 |
565 |
572 |
576 |
571 |
|
P Output (kw) |
0.252 |
0.243 |
0.237 |
0.085 |
0.213 |
0.34 |
|
Solar IRRADI ANCE (w/m2) |
169.2 |
167.2 |
137.2 |
105.3 |
101.2 |
70.1 |
|
Humidit y (%) |
17 |
12 |
10 |
11 |
11 |
11 |
|
Wind speed (m/s) |
NW 5.3 |
W 5.7 |
W 5.1 |
NW 5.7 |
NW 5.1 |
NW 7.2 |
|
Wind pressure (K Pa) |
101.0 |
100.9 |
100.9 |
100.7 |
100.7 |
100. 6 |
|
UV |
8 |
11 |
10 |
7 |
4 |
2 |
|
Visibilit y (km) |
6 |
6 |
6 |
6 |
6 |
6 |
The table 3 shown that the electrical power output of solar panel string 2 decreases with an increase in temperature of bird deposited solar cell and temperature of bird deposited solar module. The electrical power output increases when temperature of bird deposited solar cell and temperature of bird deposited solar module falls. As ambient temperature increases, temperature of bird deposits also increases but after heating surface area of bird deposited solar cell, the temperature of bird deposits get lower. This cycle of increase and decrease in the temperature of bird deposits continues with ambient temperature, temperature of bird deposited solar cell and temperature of solar panel string 2. The overall effect of temperature of bird deposits reflect on generation of electrical power output of solar panels string 2.
The following fig. 11 shows different curves for temperature variations of bird deposits, bird deposited solar cell, bird deposited solar module and solar panel string 2 with respect to the ambient temperature as mentioned in table 3.
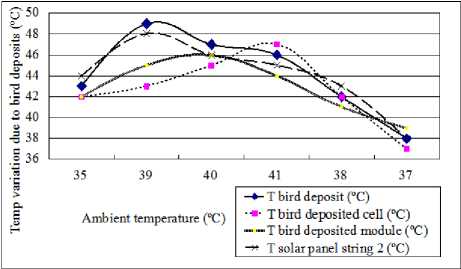
Fig.11. Shows curves for temperature variation of bird deposits, bird deposited solar cell, bird deposited solar module and solar panel string 2 with respect to ambient temperature mentioned in table 3
The fig. 11 shows temperature variation curves of four parameters with ambient temperature. The highest points for temperature of bird deposits was observed at 49(ºC) with corresponding ambient temperature as 39(ºC). The highest temperature of bird deposited cell was 47(ºC) with highest ambient temperature 41(ºC). Temperature of bird deposited module and solar panel string 2 were highest at 46(ºC). Therefore bird deposits affect temperature of solar panel which result in change in the generation of electrical power output.
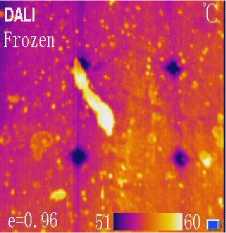
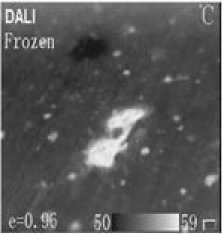
The following fig. 12(a), fig. 12(b), fig. 12(c) and fig. 12(d) shows normal photograph and thermal image of bird deposits observed at two places on solar panel surface for string 2.
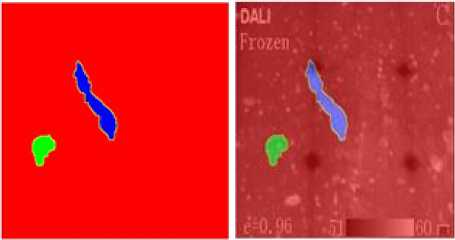
The fig. 12(a) and fig. 12(c) are normal photographs showing only the bird deposits physically. The fig. 12(b) and fig. 12(d) are the thermal images of these bird deposits showing maximum temperature as 60ºC and minimum temperature as 51ºC. The hot and cold temperature of bird deposits are represented by bright yellow color and dark blue color in the thermal image of fig. 12(b) and fig. 12(d) respectively.
(a)
(b)
(c) (d)
Fig. 12(a) and fig. 12(c) shows normal photograph and fig. 12(b) and fig. 12(d) shows thermal image of bird deposits observed at two places on solar panel surface for string 2
-
B. To analyze thermal image of cement and bird depositions using thermal image segmentation with MATLAB digital image processing:
This part of research work deals to find the interested objects in thermal images of cement and bird deposits using image segmentation. The thermal images of cement and bird deposits contain several small deposits. The heated area due to these deposits can be visualize more precisely with the help of image segmentation technique in MATLAB digital image processing. Watershed transform is a powerful method used in image segmentation. Watershed transform has many advantages compared to other image segmentation methods such as simple, INTUTIVE, easy detection, SEGMENTATION and visualization of desired object. But oversegmentation is a big drawback of watershed transform, so to reduce it marker based approach is used.
Algorithm used:
In this experiment marker based watershed transform algorithm is used for thermal image analysis of cement and bird deposits. The following figure 13 shows the flowchart of algorithm used in this part of experiment.
The marker based watershed algorithm used in experiment can be explained by following steps:
Step 1: First of all thermal image containing cement and bird deposits is captured from thermal imaging camera.
Step 2: Since watershed transform can be applied to gray scale image, so it is obtained from RGB input thermal image.
Step 3: Gradient magnitude of the converted gray scale image is obtained for the desired deposits. Applying watershed transform at this stage gives oversegmentation, so marker approach given in step 4 is used before applying it.
Step 4: Apply morphological operations to clean image by computing foreground and background markers such as opening-by-reconstruction and closing-byreconstruction.
Step 5: Now apply watershed transform on marked images to get segmented image of desired cement and bird deposits.
Step 6: Obtained the colored watershed transform segmented images of cement and bird deposits.
S tep 7: Visualize the superimposed segmented images of cement and bird deposits for better understanding.
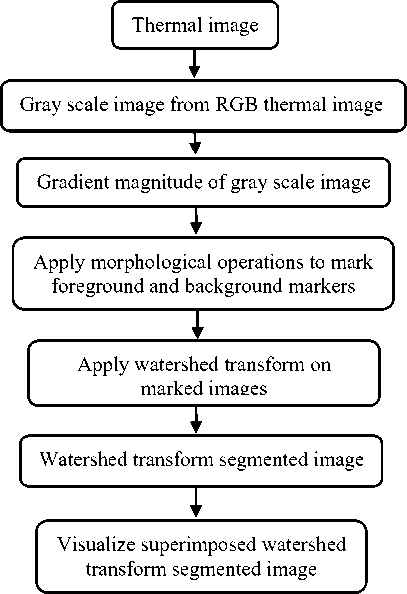
Fig.13. Flowchart of marker based watershed algorithm
Watershed transform for cement deposits of thermal image:
After applying marker based watershed algorithm on thermal image fig. 9(b) of cement deposit, the result are shown in fig. 14(a) to fig. 14(f).
(a) (b)
(c) (d)
(e) (f)
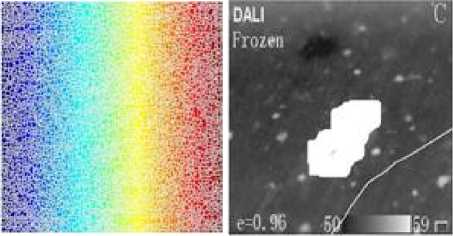
Fig.14(a) Shows gray scale image of original thermal image, Fig. 14(b) gradient magnitude image, Fig. 14(c) over-segmentation of watershed transform, Fig. 14(d) markers and object boundaries super imposed on original thermal image, Fig. 14(e) colored segmented watershed transform label matrix, Fig. 14(f) superimposed segmented image of watershed transform
The watershed transform can only be applied to binary or gray scale image so original RGB thermal image of cement deposit obtained from a thermal camera is converted into gray scale image through MATLAB function rgb2gray. The fig. 14(a) is the converted gray scale image of cement deposit.
After obtaining gray scale image a gradient magnitude is calculated as a segmentation function to detect the image whose dark regions are the desired segmented objects. It is done using SOBEL edge masks with IMFILTER. The fig. 14(b) shows the magnitude gradient of gray scale image.
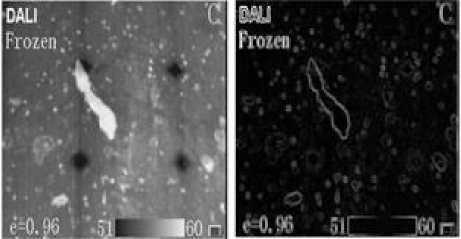
Applying watershed transform without markers leads to over-segmentation, the next fig. 14(c) shows watershed transform applied directly to magnitude gradient image resulting into over-segmentation.
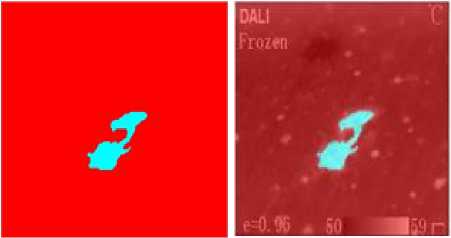
Now after using marker based approach (foreground and background markers by morphological operations) to identify the region of MAXIMA in marked objects the resultant image is obtained with foreground markers, background markers and boundaries. Now applying watershed transform to the modified segmentation function obtained in previous step and superimposing foreground markers, background markers, and segmented object boundaries on the original image, the resultant image fig. 14 (d) is obtained. It shows image with markers and boundaries superimposed on original image with watershed ridge line and surface area of segmented cement deposit.
Using watershed transform the segmented cement deposit is shown by SKYBLUE color image on red background with label matrix (LRGB) and is shown in fig. 14(e).
Watershed transform for bird deposits of thermal image:
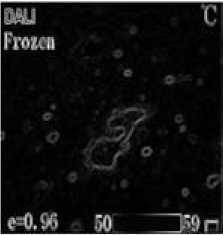
When marker based watershed algorithm is applied on thermal image fig. 12(b) of bird deposit, the result are shown in fig. 15(a) to fig. 15(f).
(a) (b)
(c) (d)
(e) (f)
Fig. 15(a) Shows gray scale image of original thermal image, Fig. 15(b) gradient magnitude image, Fig. 15(c) over-segmentation of watershed transform, Fig. 15(d) markers and object boundaries super imposed on original thermal image, Fig. 15(e) colored segmented watershed transform label matrix, Fig. 15(f) superimposed segmented image of watershed transform
The figures obtained for bird deposits are due to similar procedure described for cement deposit. The fig. 15(a) is the gray scale image obtained from RGB thermal image
The fig. 15(b) shows the magnitude gradient of gray scale image to detect the dark regions of desired segmented bird deposits. The fig. 15(c) shows oversegmented image when applying watershed transform to gradient magnitude image without markers.
Fig. 15(d) shows image with markers and boundaries superimposed on original image after using marker based approach through morphological operations.
The fig. 15(e) shows the watershed transform label matrix (LRGB) with pseudo-colors to display the segmented bird deposited area more clearly. The blue area shows the segmented image of bird deposit with red background. The green colored area is a segmented image of other small deposit highlighted with bird deposit.
The fig. 15(f) is the superimposed image obtained after transparently superimposing the obtained watershed transform label matrix (LRGB) on original image. This figure shows the segmented bird deposit on original image for better view.
-
VIII. Results And Discussions
The measurements show that as temperature of cement and bird deposits rise the power output of solar panels reduce. The temperature variation for ambient temperature and temperature of solar panel string containing deposits is also shown with the help of graphs. As the temperature of solar cell having deposits, temperature of solar panel string is also affected when these depositions occur on solar panel surface.
The image segmentation is used to find the region of interest. Thermal image of cement and bird deposits contain many small pellets of cement and other type of dirt, so image segmentation provides the desired region of cement and bird deposits from thermal image using marker based watershed transform. Finally the segmented image is superimposed over real image to get a real time view of the segmented cement and bird deposits. Therefore watershed transform is a good technique for image segmentation.
The above table 4 shown below represents the area, perimeter, major axis length and minor axis length, obtained from binary image of original thermal images for cement and bird depositions are calculated in pixels. These pixel concentration of segmented image show the intensity of hot regions for cement and bird depositions in segmented thermal image.
Table 4. Features of segmented image
|
Heated Portions / Values |
Area (pixels) |
Perimeter (pixels) |
Major Axis (pixels) |
Minor Axis (pixels) |
|
Cement deposits |
88.031 |
32.220 |
11.573 |
6.4822 |
|
Bird deposits |
56.297 |
22.755 |
7.613 |
4.240 |
-
IX. Conclusion
This paper explains the effect of temperature on the performance of solar panels having cement and bird deposits on its surface. These deposits rise temperature of deposited area and produce heating, which result into loss of electrical power generation so thermal images captured by thermal imaging camera are utilized for analysis because these images captures the infrared radiations emitted by cement and bird deposits in heat form. The heat emitted by these deposits is not visible in normal camera photograph but is clearly visible thermal image in terms of temperature.
The first part of experimental work include analysis of cement and bird deposits through principle of thermal imaging. The normal camera photographs and thermal images of both deposits are compared along with electrical and thermal parameters to show the heat produced by these deposits. The electrical parameters along with temperature of cement and bird deposits and other parameters are shown in table 2 and table 3, indicating there is a decrease in generation of electrical power output of solar panels as temperature of deposits as well as temperature of other parameters increase. This variation of temperature due to these deposits with ambient temperature is shown in fig. 8 and fig. 11 with the help of temperature curves.
The second part of work deals with thermal image segmentation of cement and bird deposits for better visual analysis through MATLAB digital image processing. The desired cement and bird deposits are segmented from original thermal images through marker based watershed transform approach of image segmentation. The final segmented images of cement and bird deposits give colored images for better visualization.
Therefore the work done presents a novel method of analyzing effect of cement and bird deposits by combining thermal imaging with image segmentation in order to better provide a better view of understanding.
References Thermal image analysis and segmentation to study temperature effects of cement and bird deposition on surface of solar panels
- Redfield, D., “Solar energy and conversion”,Technology and Society, IEEE Journals and Magazines, vol. 6, no. 23, pp. 4-9, 1978
- Biran, D., Braunstein, A., “Solar radiation and energy measurements”, IEEE Trans. Power Apparatus and Systems, vol. 95, no. 3, pp. 791-794, 1976
- Al-Tabtabaei, J.A., “Studying the Factors Affecting the Solar Power Generation Systems Performance (SPGSP)”, Int. J. Engineering Research and Applications, vol. 4, no. 12, part-2, pp. 30-58, 2014
- Al-Tabtabaei, J.A., “Reviewing the factors of the Renewable Energy systems for Improving the Energy Efficiency”, Int. J. Engineering Research and Applications, vol. 5, no. 8, part-4, pp. 57-64, 2015
- Rizwan, M., Jamil, M., Kothari, D.P., “Generalized Neural Network Approach for Global Solar Energy Estimation in India”, IEEE Trans. on Sustainable Energy, vol. 3, no. 3, pp. 576-584, 2012
- Pant, S., “Resources of Renewable Energy in India”, Int. J. Engineering Research and Applications, vol. 6, no. 8, part-3, pp. 60-64, 2016
- Manchanda, H., Kumar, M., “A Comprehensive Decade Review and Analysis on Designs and Performance Parameters of Passive Solar Still”, J. Renewables: Wind, Water and Solar, Springer, vol. 2, no. 17, pp. 1-21, 2015
- Davarifar, M., Rabhi, A., Hajjaji A.E., “Comprehensive Modulation and Classification of Faults and Analysis Their Effect in DC Side of photo-voltaic System”, J. Energy and Power Engineering, Scientific Research, vol. 5, pp. 230-236, 2013
- Chaudhary, A.S., Yadav, A., “An Overview of Faults and Health Monitoring Estimation of Solar photo-voltaic Power Generation”, Int. J. Power Electronics Controllers and Converters, vol. 2, no. 2, pp. 19-23, 2016
- Elminir, H.K., Benda, V., Tousek, J., “Effect of Solar Irradiation Conditions and other Factors on the Outdoor Performance photo-voltaic Modules”, J. Electrical Engineering, vol. 52, no. 5-6, pp. 125-133, 2001
- Sun, Y., Chen, S., Xie, L., et al., “Investigating the Impact of Shading Effect on the Characteristics of a Large-Scale Grid-Connected PV Power Plant in Northwest China”, Int. J. Photoenergy, Hindawi Publishing Corporation, vol. 2014, no. 4, pp. 1-9, 2014
- Dorobantu, L., Popescu, M.O., Popescu, C.L., et al., “Depositions Effects and Losses Caused by Shading on photo-voltaic Panels”, IEEE Conf. Proceedings, 3rd Int. Youth Conf. on Energetics (IYCE), Leiria, pp. 1-5, 2011
- “Hand Book for Solar photo-voltaics (PV) Systems” by Organisations-Solar Energy Research Institute of Singapore, Grenzone Pte Ltd, Phoenix Solar Pte Ltd, Singapore Polytechnic, SP Power Grid, Urban Redevelopment Authority, pp. 7-9
- Rogalski, A., “History of Infrared Detectors”, Opto-Electronics Review, Springer, vol. 20, no. 3, pp. 279-308, 2012
- Barreira, E., de Freitas, V.P., Delgado, J.M.P.Q., et. al.,“Thermography Applications in the Study of BuildingsHygrothermal Behaviour”, Dr. Raghu V Prakash (Ed), pp. 171-192, 2012
- Bhavna, D., Rajesh, V., Ravi Tej, D., et. al., “Scene Based Two-Point Non-Uniformity Correction of Thermal Images”, Int. J. Engineering and Technology, vol.5, no. 2, pp. 1748-1754, 2013
- Shekhawat, R.S., “Infrared Thermography- A Review”, Int.J. Engineering Trends and Technology, vol. 35, no.6, pp.287-290, 2016
- Gonzalez, R.C., Woods, R.E., Eddins, S.L., “Digital Image Processing using MATLAB”, Pearson Education, Inc., pp.16-19, 2006
- E. Kaplani, “Detection of Detection of Degradation Effects in Field-Aged c-Si Solar Cells through IR Thermography and Digital Image Processing”, Int. J. Photoenergy, vol.2012, Hindawi Publishing Corporation, pp. 1-11, 2012
- Harishkumar,S., Mohammad, V.R., Mujtaba, V.M., “Detection of Hot Spots by Thermal Imaging to Protect Power Equipments”, Int. J. Students Research in `Technology and Management, vol. 2, pp. 64-66, 2014
- Aghaei, M., Gandelli, A., Grimaccia, F., et. al., “IR real-time Analyses for PV system monitoring byDigital Image Processing Techniques”, Int. Conf. Event-based Control, Communication, and Signal Processing (EBCCSP), IEEE, Krakow, pp. 1-6, 2015
- Mahajan, P., Madhe, S., “Morphological Feature Extraction of Thermal Images for Thyroid Detection”, Int. J. Electronics Communication and Computer Engineering, vol. 5, no. 4, pp. 11-14, 2014
- Mon, K.L., “Automatic Image Segmentation Using Edge and Marker-Controlled Watershed Transformation”, Int. Conf. Advances in Engineering and Technology (ICAET'2014), Singapore, pp. 100-104, 2014
- Kongkham, G., Santhosh Kumar, K.L., “Analysis of Image Segmentation Techniques”, Int. Research J. of Computer Science (IRJCS), vol. 2, no. 6, pp. 45-53, 2015
- Kulkarni, N., “Color Thresholding Method for Image Segmentation of Natural Images”, Int. J. Image, Graphics and Signal Processing, MECS Press, vol. 1, pp. 28-34, 2012
- Bhim, K., Jagan, A., “An Improved Method for Automatic Segmentation and Accurate Detection of Brain Tumor in Multimodal MRI”, Int. J. Image, Graphics and Signal Processing, MECS Press, vol. 5, pp. 1-8, 2017
- Tsanakas, J.A., Ha, Long., Buerhop, C., et al., “Faults and Infrared Thermographic Diagnosis in operating c-Si photo-voltaic Modules: A Review of Research and Future Challenges”, Reneable and Sustainable Energy Reviews, vol. 62, pp. 695-709, 2016
- Rahman, M.M., Hasanuzzaman, M., Rahim, N.A., “Effects of Various Parameters on PV-Module Power and Efficiency”, J. Energy Conversion and Management, Elsevier, 103, pp. 348-358, 2015
- Dorobantu, L., Popescu, M.O., Popescu, Cl., et. al., “The Effect of Surface Impurities on photo-voltaic Panels”, Int. Conf. Renewable Energies and Power Qualit (ICREPQ’11), Las Palmas de Gran Canaria (Spain), vol. 1, no. 9, pp. 622-626, 2011
- Chakraborty, S., Kumar, R., Haldkar, A.K., et. al., “Mathematical method to find best suited PV technology for different climatic zones of India”, Int. J. Energy and Environmental Engineering, Springer, vol. 8, no. 2, pp. 153-166, 2017
- Usamentiaga, R., Venegas, P., Guerediaga, J., et. al., “Infrared Thermography for Temperature Measurement and Non-Destructive Testing”, J. Sensors, MDPI (Multidisciplinary Digital Publishing Institute), Basel, Switzerland, vol. 14, no. 7, pp. 12305-12348, 2014
- Munoz. M.A., Alonso-Garcia, M.C., Vela, N., et. al., “Early degradation of silicon PV modules and guaranty conditions”, J. Solar Energy, Elsevier, vol. 85, issue 9, pp. 2264-2274, 2011
