Thermal image processing for high temperature regions with image segmentation and 3D temperature plot in solar battery

Author: Akash Singh Chaudhary, Isha, D.K.Chaturvedi
Journal: International Journal of Image, Graphics and Signal Processing @ijigsp
Article in issue: 7 vol.10, 2018.
Free access
Solar batteries are the essential component in an off-grid solar photovoltaic generation system and used for the purpose of storage. Normally lead acid batteries are used for solar applications and are placed in a battery room where the temperature must be maintained with in safe working limits. The temperature of battery depends on several factors like ambient temperature, load current drawn by the battery, sulphur deposition terminals, charging and discharging cycles. When temperature of a battery increases beyond safe limit problems of heating arises. Heating reduces the battery life and may be one of the reasons of explosion in batteries. The ambient temperature measuring device used in battery room is not sufficient to measure the heat generated by batteries. Installation of a normal camera in battery room is capable to monitor the smoke or spark in battery components but not the amount of temperature so it is also not fulfilling the need. Thermal imaging camera captures heat coming out from a battery and produces a thermal image with temperatures associated with it. This thermal image is used for representing high and low temperatures with a range of maximum and minimum values of temperature. In this paper a heated battery is identified in a battery room for solar photovoltaic generation system and thermal image analysis is performed to determine the regions of high temperature with the help of image segmentation and 3D temperature plot. The image segmentation is done using marker based watershed transform technique to achieve the heated region of interest from thermal image and 3D temperature plot shows the area of maximum temperature with location in thermal image of heated solar battery.
Image Segmentation, Solar Battery, Thermal Image Processing, Watershed Transform, 3D Temperature Plot
Short address: https://sciup.org/15015977
IDR: 15015977 | DOI: 10.5815/ijigsp.2018.07.03
Text of the scientific article Thermal image processing for high temperature regions with image segmentation and 3D temperature plot in solar battery
Published Online July 2018 in MECS DOI: 10.5815/ijigsp.2018.07.03
Electrical energy from sun is obtained through photoelectric effect. This energy obtained from sun is clean, inexhaustible and available in abundance. The general components of a solar photovoltaic generation system are solar panels, solar battery, solar charge controller, solar inverter and load [1]. The main purpose of using solar batteries is to store the electrical power generated by photovoltaic panels. Normally lead acid batteries placed in transparent plastic SAN (STYROLACRYLNITRIL) container are installed for solar photovoltaic applications but flooded cell type batteries are most common. For reliable and safe operation of batteries the monitoring of battery temperature, SULPHUR deposition and corrosion on electrodes, acid stratification, charging and discharging rates must be done with a special care [2]. Ambient temperature affect the loss of water from battery, as water loss from a battery increases the temperature of battery also increases [3].
The heat emitted due to rise in high temperature in batteries is captured by thermal imaging camera. Thermal camera works on technique of thermal imaging which sense the infrared radiations coming out of the heated object [4]. The applications of image processing with thermal images give better results to analyze the heated objects [5]. Image segmentation is an efficient tool to extract the hot region for clear visualization with pseudocolours. Watershed transform is one of commonly used method for image segmentation [6]-[7]. The regions having high temperature in batteries are clearly shown by 3D plot [8].
-
II. Solar Batteries
The batteries used in solar photovoltaic system must have good reliability, low maintenance, cheap, high capacity and wide range for operating temperature. The standalone photovoltaic system uses lead acid batteries with tubular plates. The problem in battery arises due to poor operation, lack of maintenance, over-charging followed by explosion if conditions become serious [9]. The co-relations of battery parameters such as battery voltage, battery current, capacity rate, state of charge etc can be studied with the help of 3D (three dimensional) curves using matlab software easily [10].
-
III. Thermal Image Analysis with Image Segmentation
Thermal imaging is a technique used to capture Infra-red radiations emitted by any object above absolute zero by thermal imaging camera and produce thermal images [11]. Thermal imaging detects the heated region and displays temperature. The fig. 1 shows the block diagram of thermal image analysis with image segmentation [12].
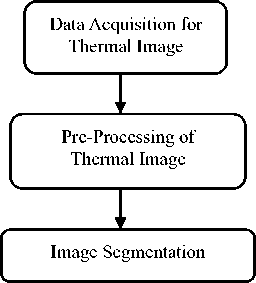
Image segmentation of thermal images makes use of digital image processing to achieve desired segmented object [13]. The 3D temperature plot for a thermal image can also be obtained for better results [14]. Watershed transform is one of commonly used method for image segmentation [15]. The historical background of watershed transform was introduced in 1977 by S. Beucher and C. Lantuejoul. Due to the problem of over-segmentation marker controlled approach is used to mark foreground objects and background locations [16]-[17]. Application of watershed transform on thermal images provides an efficient segmented image for the heated regions with pseudo-colors. Technique of watershed transform helps to clearly visualize desired hot regions in segmented thermal image. [18]-[19].
-
IV. Algorithm Used for Thermal Image Analysis in Solar Batteries
Thermal image obtained by thermal imaging camera is processed through the image segmentation procedure with marker based watershed transform to achieve a superimposed segmented image. This superimposed segmented thermal image highlights areas having heat only in a solar battery. Now a 3D temperature plot is obtained to show a three dimensional view of heated regions in solar battery for better visualization effect. The following fig. 2 shows algorithm of the work done used for thermal image analysis in solar batteries in this experiment. MATLAB R2014a tool is used for image processing analysis.
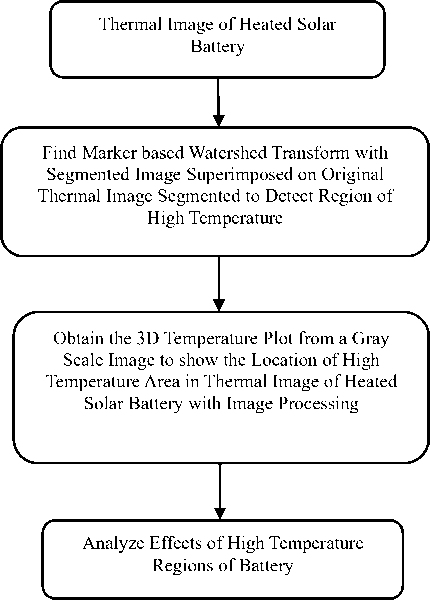
Fig.2. Flowchart of Algorithm used for Image Processing based Thermal Image Analysis in Solar Batteries
-
V. Experimental Work Done
Out of 180 batteries installed in battery room one battery is found to have high temperature, so experimental work is performed on one heated battery and one healthy battery. The voltage, current and temperature variations of the heated battery, healthy battery and atmospheric temperature of battery room are obtained with the help of KUSAM MECO CLAMPMETER. The normal photographs and thermal images are captured with normal camera and thermal imaging camera respectively. KUSAM MECO thermal imaging camera is used to capture thermal images of the batteries. The total voltage and current of battery bank are noted from the battery bank panel display. The other parameters such as humidity, wind velocity, wind pressure are measured via global services. After measuring the required parameters and data acquisition from thermal imaging camera, the thermal images are processed through image processing to obtain the segmented heated area from the thermal images of heated battery. The depth of heating is also shown by obtained a 3D (three dimensional) images. The 3D contour of the segmented heated area of heated battery shows the effect of heating on the surface of battery.
The specifications of thermal imaging camera and batteries used in experiment are mentioned in table 1 and table 2 respectively.
Thermal Image Processing for High Temperature Regions with Image Segmentation and
3D Temperature Plot in Solar Battery
Table 1. Specifications of Thermal Camera
|
Thermal Camera Info |
Value |
|
Type of Detector |
UNCOOLED FPA Micro-Bolometer |
|
Min. Focus Distance |
0.3m |
|
Spectral Range |
8-14μm |
|
Measurement Temp. |
-20 °C to +350° C |
|
Environment Operating Temp. |
-15 °C to +50 °C |
|
Environment humidity |
≤ 90 % Non-Condensing |
|
Accuracy |
± 2°C |
|
Thermal Sensitivity |
≤ 0.1C @ 30 °C |
|
Color Palette |
11 Changeable |
|
Laser Pointer |
Class 2, 1mw/635 nm (red) |
Table 3. Temperature Variation of Heated Battery, Healthy battery and battery room with time
|
T battery (°C) / Time |
T healthy battery (°C) |
T heated battery (°C) |
T battery room (°C) |
|
11.30 am |
34 |
36 |
33 |
|
12.30 pm |
46 |
47 |
34 |
|
1.30 pm |
33 |
37 |
33 |
|
2.30 pm |
34 |
36 |
33 |
|
3.30 pm |
36 |
37 |
34 |
|
4.30 pm |
35 |
37 |
33 |
The table 4 shows variation of battery voltage, battery current in a heated battery, healthy battery along with voltage and current of complete battery bank.
Table 2. Specifications of Solar Batteries used in Experiment
|
Battery Information |
Value / Details |
|
Company |
EXIDE |
|
Model |
OPZS 700 |
|
Other Details |
Tubular Battery with Transparent SAN Container |
|
Manufacturing Year |
2010 |
|
Rating: |
2V, 700 AH |
|
No. of Cells |
01 |
|
No. of Terminals |
04 (2 positive, 2 negative) |
|
Voltage per cell |
2 volt |
-
A. Data Acquisition for Thermal Analysis:
The table 3 shows temperature variation of heated battery, healthy battery and battery room for one complete day from 11.30 am to 4.30 pm. The maximum temperature of heated battery is noticed as 47°C at 12.30 pm.
Table 4. Variations of Battery Voltage, Battery Current in a Heated Battery, Healthy Battery along with Voltage and Current of Complete Battery Bank
|
Battery Parameters/ Time |
Healthy battery (volt/Amp) |
Heated battery (volt/Amp) |
Battery bank (volt/Amp) |
|||
|
V |
I |
V |
I |
V |
I |
|
|
11.30 am |
2.37 |
2.85 |
1.50 |
3.06 |
172 |
3.2 |
|
12.30 pm |
2.06 |
2.91 |
1.20 |
3.30 |
218 |
3.0 |
|
1.30 pm |
2.34 |
3.35 |
0.39 |
1.41 |
195 |
6.7 |
|
2.30 pm |
2.36 |
3.57 |
1.86 |
3.42 |
107 |
3.45 |
|
3.30 pm |
2.30 |
3.19 |
0.62 |
2.91 |
200 |
2.99 |
|
4.30 pm |
2.36 |
3.06 |
2.31 |
3.12 |
93.6 |
3.39 |
The fig. 3(a), fig. 3(b) and fig. 3(c) shows original image of healthy battery, heated battery and graph for temperature variation of batteries with time respectively.
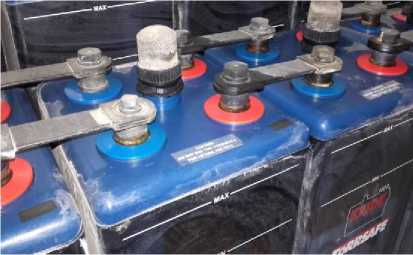
Fig. 3(a)
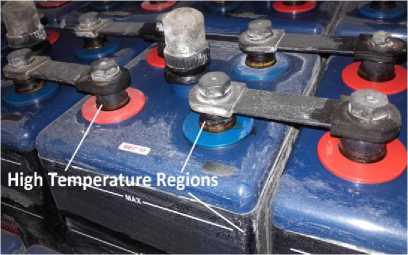
Fig. 3(b)
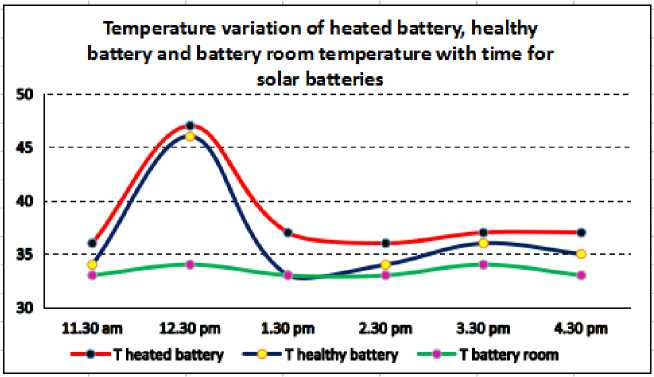
Fig. 3(c)
The fig. 4(a) and fig. 4(b) shows high rise and fall in the voltage and current of heated battery as compared to healthy battery during the experimental period (11.30 am to 4.30 pm). As a result high rise and fall are also noticed in battery bank voltage and current in fig. 4(c) and fig. 4(d) respectively.
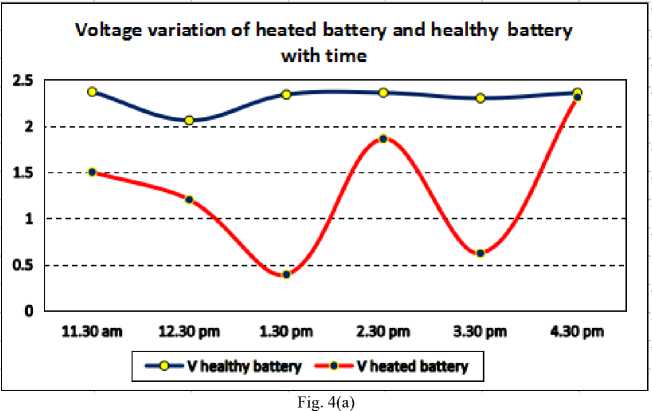
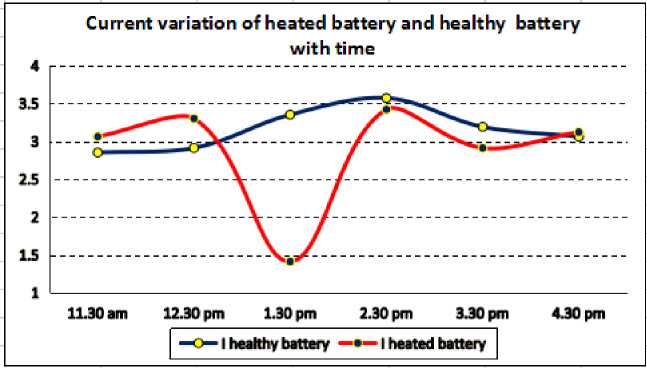
Fig. 4(b)
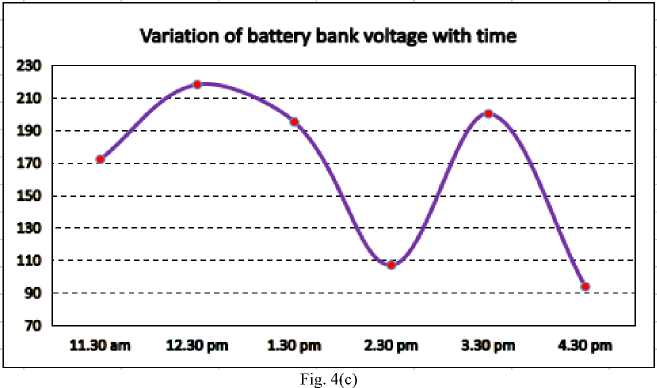
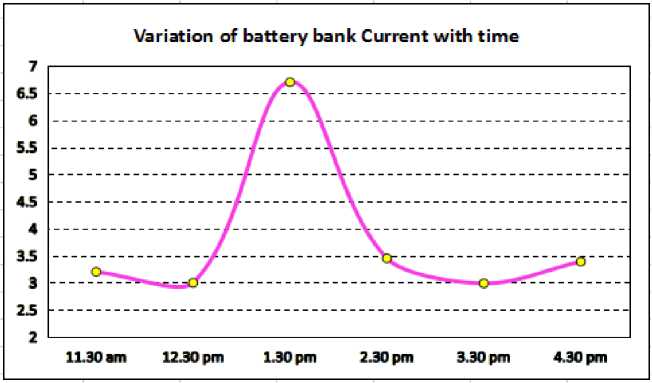
Fig. 4(d)
The atmospheric parameters in the battery room are mentioned in the table 5.
Table 5. Atmospheric Parameters in the Battery Room
|
Time |
Humidity (%) |
Wind Speed (mps) |
Wind Pressure (K Pa) |
UV |
|
11.30 am |
84 |
W 3.6 |
100.6 |
8 |
|
12.30 pm |
75 |
SW 3.6 |
100.5 |
7 |
|
1.30 pm |
67 |
SW 3.6 |
100.5 |
7 |
|
2.30 pm |
60 |
SW 3.1 |
100.4 |
5 |
|
3.30 pm |
60 |
SW 3.6 |
100.4 |
1 |
|
4.30 pm |
56 |
W 2.6 |
100.3 |
1 |
-
B. Image Processing for Marker based Watershed Transform and Image Segmentation:
The procedure to obtain desired high temperature regions in thermal image of heated solar battery using marker based watershed transform and image segmentation is discussed through the flowchart shown in the figure 5 and steps explained in association with it:
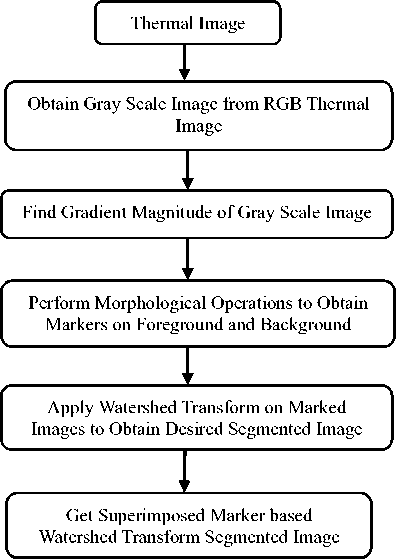
Fig..5. Flowchart of Marker based Watershed Algorithm and Image Segmentation using Image Processing
Step 1: Thermal image is acquired from thermal imaging camera.
Step 2: Convert RGB thermal image into Gray scale image.
Step 3: The Gray scale image is processed to find gradient magnitude.
Step 4: To avoid over-segmentation, watershed transform is not applied after step 3. Before applying watershed transform get marked images, so perform morphological operations in this step 4 to find foreground and background markers.
Step 5: Obtain segmented image by applying watershed transform on marked images.
Step 6: Pseudo-Colors are added to view the watershed transform segmented image.
Step 7: At last segmented images are superimposed on original images to obtain the final superimposed segmented image for better visualization.
(g) (h)
(i) (j)
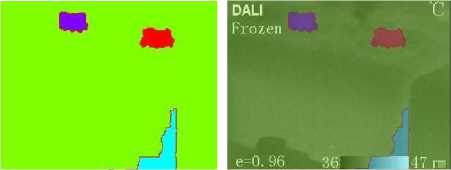
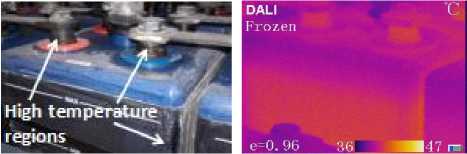
The normal photograph and thermal image of the heated solar battery installed in battery room is shown in the following fig. 6(a) and fig. 6(b).
The regions with high temperature are not visible in the normal photographs and thermal image shows the hot portions but the high temperature regions are not specified specifically. Therefore MATLAB R2014a image processing is applied to get marker based watershed transform and image segmentation. The following fig. 6(c) to fig. 6(l) shows complete result from processing of thermal image to superimposed marker based watershed transform segmented image for the desired high temperature regions in a heated solar battery.
(k) (l)
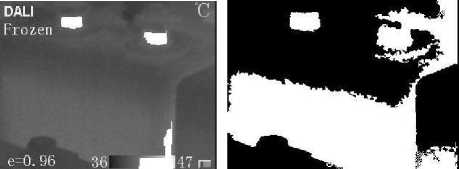
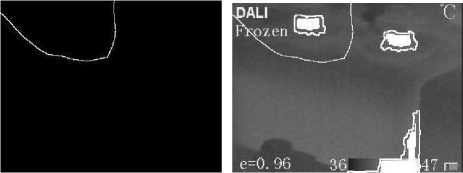
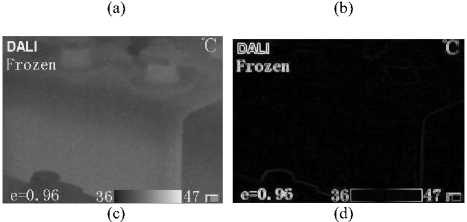
Fig.6.(c) gray scale image, fig. 6(d) gradient magnitude image, fig. 6(e) over-segmented watershed transform, Fig. 6(f) regional maxima of opening-closing by reconstruction, fig. 6(g) regional maxima superimposed on original image, fig. 6(h) threshold opening-closing by reconstruction, fig. 6(i) watershed ridge lines, fig. (j) Markers and object boundaries superimposed on original image, fig. 6(k) colored watershed transform segmented image, fig. 6(l) superimposed colored watershed transform segmented image
The fig. 6(l) is the superimposed colored watershed transform segmented image for the heated solar battery showing only the high temperature regions. The maximum and minimum temperatures recorded by thermal image for the heated solar battery are 47°C and 36°C respectively. The high temperature regions occur at terminals and at interfacing of battery and are shown by pseudo-colored segmented image in fig. 6(l).
C. 3D Temperature Plots for High Temperature Regions of Heated Solar Battery:
The following block diagram fig.7 represents the procedure to obtain the 3D temperature plot for high temperature regions in heated solar battery.

(e) (f)
Gray-Scale Image of Thermal Image
Obtain High Temperature Regions in 3D Plot
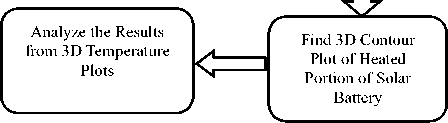
Fig.7. Block Diagram for Obtaining 3D Temperature Plots for Heated Solar Battery
The dark red color shows high temperature points and blue color shows the low temperature points in image. The scale at the right represents the temperature according to the color pattern of the image. After applying image processing to the gray scale image for the heated solar battery the 3D temperature plot is obtained. The location of maximum temperature point at 47°C is found by determining columns and rows of maximum in the 3D image matrix which is shown in fig. 8(a)
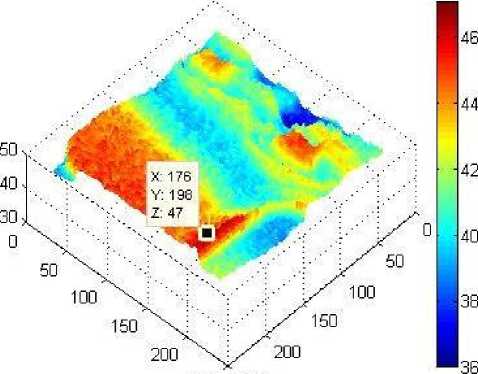
250 250
(a)
(b)
Fig.8.(a) 3D Temperature Plot with High Temperature Regions and Maximum Temperature Point, (b) 3D Contour Plot for Heated Solar
Battery
The high temperature regions consist of certain other maximum temperature points which are listed in table 6.
Table 6. Location of Maximum Temperature Points in 3D Image Matrix
|
S. No |
Columns of max. |
Rows of max. |
Max. Temp. point value |
|
1. |
[173; 173; 174; 176; 177; 177] |
[197; 211; 211; 198; 189; 198] |
47.00008871110 8250 |
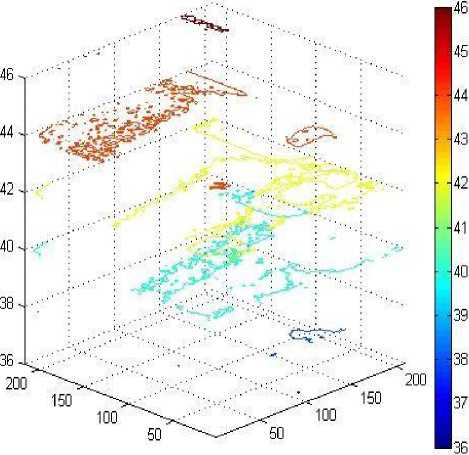
Rise in temperature causes deterioration in solar battery. Therefore a 3D contour plot analyzes the depth of penetration from surface of the battery. Fig 8(b) shows 3D contour for the heated solar battery. The red color in image shows the points of heating and corresponding temperature are shown by temperature scale placed at right.
-
VI. Results And Discussion
The paper focuses on one day thermal analysis on heated battery installed in battery room from 11.30 am to 4.30 pm. Variations of temperature in a healthy battery and heated battery with battery room temperature are shown by graphs. The effect of heating on battery voltage, battery current, battery bank voltage and battery bank current is also shown in the graphs.
The thermal images are captured with thermal imaging camera and are processed with digital image processing through MATLAB R2014a toolbox. Marker based watershed transform provides the segmented pseudo-colored image of the heated terminals and body of the heated solar battery. The gray scale images are processed again to find the location of maximum temperature points in 3D temperature plots. The 3D contour plot shows the depth of heating in the heated solar battery with colors and temperature scale.
-
VII. Conclusion
The paper presents an algorithm to detect the high temperature regions in a heated solar battery by applying image processing to the thermal images. The desired heated portions in the battery are segmented successfully with marker based watershed transform and image segmentation technique. Further analysis on the high temperature regions is extended to yield the maximum temperature points and depth of penetration in the 3D temperature plot and 3D contour respectively. Therefore paper provides an attempt to study the high temperature thermal analysis with digital image processing techniques for better results.
3D Temperature Plot in Solar Battery
References Thermal image processing for high temperature regions with image segmentation and 3D temperature plot in solar battery
- Biran, D., Braunstein, A., “Solar radiation and energy measurements”, IEEE Trans. Power Apparatus and Systems, vol. 95, no. 3, pp. 791-794, 1976
- Manimekalai, P., Harikumar, R., Raghavan, S., “An Overview of Batteries for Photovoltaic (PV) Systems”, Int. J. of Computer Applications, vol. 82, no.12, pp. 0975-8887, 2013
- Dunlop, P.J., Farhi, B.N., “Recommendations for Maximizing Battery Life in Photovoltaic Ststems: A Review of Lessions Learned”, Proceedings of Forum, Solar Energy; The power to choose, pp. 1-8, 2001
- Kim, H., Lee, J., Baek, D., et. al., “A Study on Thermal Performance of Batteries using Thermal Imaging and Infrared Radiation”, J. of Industrial and Engineering Chemistry, Elsevier, vol. 45, pp. 60-65,2017
- Rodrigues, R.O., Gomes, H.T., Lima, R., et. al., Thermal Infrared Image Processing to Assess Heat Generated by Magnetic Nanoparticles for Hyperthermia Applications”, Int. Symposium on Visual Computing, Cham, Advances in Visual Computing, Springer, vol. 9474, pp. 25-34, 2015
- Hassan, E., Aboshgifa, A., “Detecting Brain Tumor from MRI Image using Matlab GUI Programme”, Int. J. Computer Science & Engineering Survey (IJCSES), vol.6, no.6, pp. 47-60, 2015
- Rizvi, S.T., Sandhu, M.S., Fatima, S.E., “Image Segmentation using Improved Watershed Algorithm”, Int. J. of Computer Science and Information Technologies, (IJCSIT), vol. 5, no.2, pp. 2543-2545, 2014
- Beckert, W., Freytag, C., Wolter, M., et. Al., “Analysis of Electro-Thermal Hot Spot Formation in Li-Ion-Battery-Cells”, Excert from Proceedings of COMSOL Conference, Rotterdam, 2013
- Chaurey, A., Daembi, S., “Battery Storage for PV Power Systems: An overview”, J. Renewable Energy, ELSEVIER, vol. 2, no. 3, pp. 227-235, 1992
- Haddad, R., Shahat , A.E., Kalaani, Y., “Lead Acid Battery Modelling for Solar Photovoltaic Applications”, J. Electrical Engineering, pp. 1-8
- Usamentiaga, R., Venegas, P., Guerediaga, J., et. al., “Infrared Thermography for Temperature Measurement and Non-Destructive Testing”, J. Sensors, vol. 14,pp. 12305-12348, 2014
- Ansari, S., Salankar, S., “An Overview on Thermal Image Processing”, Proc. 2nd Int. Conf. Research in Intelligent and Computing in Engineering, pp. 117–120, ACSIS, vol. 10, 2017
- Jaffery, Z.A., Dubey, AK., “Design of Early Fault Detection Technique for Electrical Assets using Infrared Thermograms”, J. Electrical Power and Energy Systems, vol. 63, pp. 753-759, 2014
- Tsanakas, J.A., Chrysostomou, D., Chrysostomou, P.N., et. al., “Fault diagnosis of photovoltaic modules through imageprocessing and Canny edge detection on field thermographic Measurements”, Int. J. Sustainable Energy, Taylor & Franscis, vol. 34, n0. 6, pp. 1-22, 2013
- Gobindchandra, K., Santhosh Kumar, K.L., “Analysis of Image Segmentation Techniques”, Int. Research Journal of Computer Science (IRJCS), vol 2, no. 6, pp. 45-53, 2015
- Goshal, D., Acharjya, P.P., “MRI Image Segmentation Using Watershed Transform”, Int. J. of Emerging Technology and Advanced Engineering, vol. 2, no. 4, pp. 373-376, 2012
- Bala, A., “An Improved Watershed Image Segmentation Technique using MATLAB”, Int. J. of Scientific & Engineering Research, vol. 3, no. 6, pp. 1-4, 2012
- Chaudhary, A.S., Chaturvedi, D.K., “Thermal Image Analysis and Segmentation to Study Temperature Effects of Cement and Bird Deposition on Surface of Solar Panels”, I.J. Image, Graphics and Signal Processing, MECS Press, vol. 9, no. 12, pp. 12-22, 2017
- Chaudhary, A.S., Chaturvedi, D.K., “Efficient Thermal Image Segmentation for Heat Visualization in Solar Panels and Batteries using Watershed Transform”, I.J. Image, Graphics and Signal Processing, MECS Press, vol. 9, no. 11, pp. 10-17, 2017
