Three-dimensional Morphological Analysis for Geological Bodies and Application

Author: Yanhong Zou, Xiancheng Mao, Wenfeng Xi
Journal: International Journal of Image, Graphics and Signal Processing(IJIGSP) @ijigsp
Article in issue: 4 vol.3, 2011.
Free access
To address the spatial Morphological analysis of complex geological bodies in stereoscopic quantitative prediction of concealed ore bodies, a three-dimensional morphological analysis method for geological bodies based on 3-dimensional raster model under visualization environment was put forward by combining mathematical morphology with Euclidean distance transform theory. Firstly, the 3-dimensional visualization models for geological bodies were constructed on the basis of the 3-dimensional geological modeling (3DGM) technology; Secondly, the algorithm for extracting the surface shape trend of geological body with the 3-dimensional raster model was proposed by using mathematical morphology filtering. By the combination of morphological filtering, global set operation and three-dimensional Euclidean distance transform, the models for the quantitative analysis and hierarchical extraction of the shape undulance were established. Lastly, as a case study, the three-dimensional morphological analysis method was applied in analyzing quantitatively the Xinwuli magmatic body in Fenghuangshan ore field in Tongling, Anhui Province. By means of the calculation model of Euclidean distance field, the quantitative extraction of the shape trend and shape undulance as well as the angle between geological interface and trend surface, as the quantitative indexes of geological ore-controlling factors, were achieved after building the 3D raster models of the magmatic body. The results show that the morphological analysis method is feasible to calculate various morphological parameters of complex geological bodies and extract quantitative indexes of geological ore-controlling factors successfully for stereoscopic quantitative predication of concealed ore bodies.
Geological body, 3-dimensional visualization, morphological analysis, mathematical morphology, Euclidean distance transform
Short address: https://sciup.org/15012164
IDR: 15012164
Text of the scientific article Three-dimensional Morphological Analysis for Geological Bodies and Application
Published Online June 2011 in MECS
The formation of deposits has relation with various geological actions. Magmatic rock, faults, folding structures and other geological bodies are often the main controlling factors for the formation and distribution of deposits. The shape trend of geological body reflects its major characteristics in the space, while the shape undulance reflects that of local in a certain spatial direction. In the deposit, the shape trend and the shape undulance of the geological body always have an
Wenfeng Xi1
2 Key Laboratory of Metallogenic Prediction of Nonferrous Metals, Ministry of Education
Central South University
Changsha, Hunan Province, 410083, China
important impact on the ore-formation actions. Hence, with the development of the quantitative prediction of mineral resources in three-dimension space [1-2], three-dimensional geological modeling and spatial analysis technology are applied to depict the geological bodies and extract the ore-controlling geological indexes quantitatively.
Currently, there are many researches on 3-dimensional geological modeling and visualization, which include 3-dimensional reconstruction and digital geological model, simulation and visualization of geological processes etc. [3-6]. But the 3-dimensional spatial analysis method is mostly used in the field of computer graphics and image processing and these methods focus on the geometric accuracy and efficiency. The existing work includes 3D distance calculation [7-8], 3D superposition analysis [9] and 3D field of search [10] etc. In recent years, scholars in domestic and foreign have made many studies on the 3D images by using mathematical morphology and models, which include the interactive medical image segmentation [11-13], spatial morphological filtering [14-16], the extraction of construction in Radar cloud [17] etc. However, these methods have not been very well applied in metallogenic quantitative prediction in the real three-dimensional geological space. According to the actual need for the spatial morphological analysis of the geological bodies in stereoscopic quantitative prediction of concealed ore bodies for Fenghuangshan ore field in Tongling, Anhui province, combined with mathematical morphology and Euclidean distance transform theory, a three-dimensional morphological analysis method based on the three-dimensional raster model is presented to gain the shape trend and the shape undulance for the geological body. This method is adaptable to the shape analysis of bend geological bodies or other complex geological bodies with overlap surfaces, and meets the real three-dimensional requirements of quantitative prediction of concealed ore-body.
-
II. Three-dimensional Modelling And Visualization For Geological Bodies
-
A. Three-dimensional model of the geological body
Geological bodies have obvious various shapes which could be described by discrete geometric models. But the ore-controlling action of geological bodies is continuous in geological space and the ore-controlling distribution is fit to be represented by the field model.
Geological data include not only coordinate data and sample data which are achieved from exploration engineering, but also geological survey record, geological maps and so on. The data can be chose to construct the geometric model of geological body. For example, the three-dimensional shape of geological body could be inferred by the wire frame model based on geological section maps. The wire frame model has the advantages of simple structure, less storage space and can better reflect the surface structure of spatial objects.
The voxel model divides the model space into a set of regular cubic three-dimensional arrays. Hence, it can be called three-dimensional raster model. With the advantages of hidden location, simple structure and easy operation, the three-dimensional raster model is conductive to the spatial analysis and calculation. The model is also adaptable to represent the spatial continuous distribution field. In this paper, the three-dimensional raster model is selected to express the ore-controlling distribution of geological bodies.
-
B. Three dimensional visualization of geological bodies
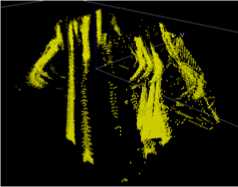
3-dimensional geological modeling (3DGM) technology makes it possible to simulate the 3-dimensional geological objects visually such as strata, structures, magmatic bodies, ore bodies and so on. Currently, many three-dimensional geological modeling softwares provide the wire frame modeling functions. In 3D visualization environment, the boundary of geological body could be delineated based on prospecting line profile in exploration and engineering by human-computer interaction. And the wire-frame model can be outputted to the three-dimensional raster model by means of block (voxel) division. For instance, the three-dimensional visualization models of Xinwuli magmatic body in Fenghuangshan ore field constructed by the 3DGM software Datamine are shown in Fig. 1. According to the analysis of Metallogenic law for Fenghuangshan ore field, the rock mass is a main ore-controlling geological body. Obviously, the rock mass exits many overlap phenomena in multiple directions.
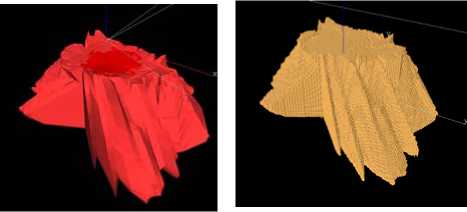
( a ) The wire frame model ( b ) The raster model Fig. 1 The 3D visualization model of rock mass
-
III. The Morphological Analysis Methods For Geological Bodies
The shape of geological body can be depicted by the geological boundary undulance and the undulance can be conveyed by the relief intensity from geological boundary to its trend surface or lower order trend surface, which reflects the curve changes of geological boundary. Ordinarily, the relief intensity is achieved by trend surface mathematical equations, however, this trend-residue method can not meet the need for the complex shape analysis of geological bodies with overlap surfaces. Based on the 3-dimensinal visualization models of complex geological bodies, a new 3-dimensional shape analysis method is presented by using mathematical morphology and Euclidian distance transform theory and the corresponding shape trend and undulance extraction models are established.
-
A. The Morphological analysis Methods for the Geological Body Based on Mathematical Morphology
Mathematical morphology depicts binary image with sets, which includes four basic morphological operations, that is Erosion, Dilation, Opening and Closing. When A is corroded by B, it can be expressed as A 0 B . A dilated by B then can be expressed as A © B , while A o B and A • B can respectively represent Opening and Closing transform.
Suppose that A is a binary image, B is a structure element:
A 0 B = { x : b + x e A }
A © B = [ A c 0 B ] c A o B = ( A 0 B ) © B A • B = ( A © B ) 0 B
In above formulas, Ac is the complementary set of
-
A, B rotated 180°around the coordinate origin is B .
Geological bodies’ boundary expressed by voxel model is a closed surface which is constructed by 3-dimensional discrete voxels. Consequently, it is similar to 3-dimensional binary image, and we could analyze the geological bodies’ shape with mathematical morphology theory.
Considering sphere is isotropic in three-dimensional space, the ball structure element is chose to carry out open or close operators on geological bodies. When the ball rolls in the whole three-dimensional space, it will include the scroll inside and outside the geological-body boundary. The open operator will take effect when the ball is inside geological-body boundary. The results of an open operator will be a thin shell of the outer boundary formed from the rolling track. While the ball rolling on the insider boundary will scapple the peak on the boundary (in Fig.2 (b) (c)). Consequently, compared to the original geological boundary, the closed surface has filtered out the peak part which could not be rolled into by the ball. Similarly, the Close operator will take effect when the ball rolls outside geological-body boundary and the scroll will fill up the saddle on the boundary (in Fig.2
-
(d) (e)), thereby, an outline with the saddle is gotten. Therefore, combining the two operations on the geological bodies, the geological boundary of the convex peak and concave valley can respectively be scappled and filled so as to get a smooth trend patterns.
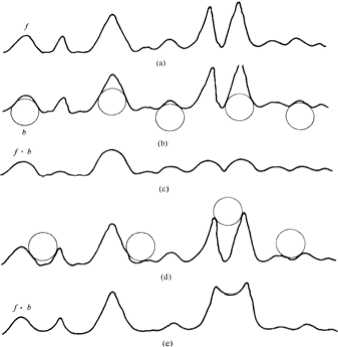
Figure2 Opening and Closing operation of spherical structure element on geological body’s boundary
Suppose that A is a geological body object , B ball is a spherical structure element, and define the two operations combination as morphological filtering transform :
-
(1) Opening then Closing
filter ^(A)= A o B^ • Bbai (5)
-
(2) Closing then Opening filter
M(A)= A • BbaU o Bbai (6)
Both of the two transforms can help us get the shape trend and undulance of geological body. The transformed shape smoothness depends on the spherical element radius. The larger the radius is, the more part of the convex peak and concave valley can be filled, and the smoother the shape is. By set operation, these sets can be obtained: the retained shape trend set, the set that constitutes the convex part and the set that fills up the concave part.
-
B. Euclidean Distance Transform and the Morphological Extraction model
A new quantitive extraction model for the shape trend and undulance of geological body is presented with the help of Euclidean distance transform technique after mathematics morphological filtering. Referring to the 3-dimensional Euclidean distance transform method based on eight templates proposed by Lin Hong-wei [18], the Euclidean distance field is rendered by scanning all voxels of the raster models, and the concave and convex shape impact on every voxel of the boundary are quantified
In this method, morphological filtering is carried out once, Euclidean distance transform once, global set operation twice, then the concave and convex attributions and the undulance degree for every voxel can be obtained, the steps are as follows:
Step1: Initialize the raster model of the geological body as the 3-dimensional binary image A which is to make shape analysis, define a ball structure element that has the certain radius r, the radius can determine the size of the available filtering wave, which can show the undulance degree;
Step2: Take B ball (r) as structure element, and use Opening and Closing operations combination to make morphological filtering on A, then get the shape trend set M ( A ) .
Step3: Obtain the convex set D peak ( A ) and the concave set D valley ( A ) :
. Dpeak (A ^ MA) ^ A) - M(A) = A ^ M(A) ( 7 )_Dvalley (A) = ИA) - MA) П A) = ИA) П A
Step4: By means of Euclidean distance transform, define the Euclidean distance field E outer outside the set object i//( a ) and the Euclidean distance field E mner inside the set j / ( a ) .
Step5: For every voxel on geological bodies’ boundary, v £ A, judge that which set v belongs to :
If v £ Dpeak ( A ) , v belong to the convex, and v £ m ( a ) , turn Step6;
If v £ D vailey ( A ) , v belong to the concave, and v £ l/( a ) , turn Step7;
Otherwise, v would not belong to geological bodies’ boundary.
Step6: Calculate the distance field value E outer and turn Step5. The value on the voxel v can illustrate the degree of local convex.
Step7: Calculate the distance field value E inner and turn Step5. The value on the voxel v can illustrate the degree of local concave.
-
C. The hierarchical extraction of geological shape undulace feature
Similarly, improving the steps above properly can make grading extraction for geological shape undulance feature. As the radius r of the ball structure element determines the size of the filterable wave, by changing the value of r, it can extract different degrees of undulance. The detailed steps of grading extraction of algorithmic are as follows:
Step1: Initialize the three dimensional geological binary image from the raster model of the geological body which is to make shape analysis, define the r values of all ball structure elements for hierarchical extraction of the shape undulance. a certain r value is according to a grade of the hierarchical extraction.
Step2: Suppose that the original geological image is A 0, Define the max grade I max and the maximum threshold for r value of ball structure element. take the r value for the grade i of the hierarchical extraction, make the morphological filtering on the previous shape trend filtering result A ,-i , then get A i = v ( A i - 1 )
Step 3: Obtain the convex set and the concave set of the grade i:
. Dpeak (4-1 ) = (4 ^ 4-1 )- 4 = 4-1 ^ 4 ( 8 )
_ D valey ( 4 - 1 ) = 4 - ( 4 ^ 4 - 1 ) = A^ 4 - 1
Step 4: For every voxel v 0,k on geological bodies’ boundary, obtain the nearest voxel v -1 ,k on A -1 n d stance f eld of E outer ( , j , k ) or E inner ( , j , k ) and store every mapping of v 0,k ↔ v -1 ,k;
Step5: By Euclidean distance transform, update E outer ( , j , k ) and E inner ( , j , k ) : create the Euclidean distance field in E outer( , j , k ) outside Ai and the Euclidean distance field in E inner inside A i;
Step6: For every voxel v -1 ,k, judge that which set v belongs to:
-
a. if v ,-1 Л e D peak ( 4 , - 1 ) , v belongs to the
convex, and v e 4 ,turn Step 7;
-
b. if vM ,k e D u ) , v belongs to the
valley i - 1
concave, and v e 4 ,turn Step 8;
-
c. Otherwise, v -1 ,k belongs to the flat;
Step7: Calculate the distance field value E outer , value on the v -1 ,k coordinate, which can illustrate the local convex degree of vi-1,k.Obtain the voxel v0,k on geological boundary by the mapping of v 0,k ↔ v -1 ,k , and the value is the hierarchical undulance in the grade I for the voxel v 0,k . Define the E outer value is above zero and store it, turn Step 6;
Step8: Calculate the distance field value E inner, value on the v -1 ,k coordinate, which can illustrate the local concave degree of v i-1,k . Obtain the voxel v 0,k on geological boundary by the mapping of v 0,k ↔ v -1 ,k , and the value is the hierarchical undulance in the grade I for the voxel v 0,k . Define the E outer value is below zero and store it, turn Step 6;
Step9: If r value for the next grade is not exceeding the maximum threshold, let i=i+1, and turn Step2. Otherwise end. A i is the ultimate shape trend part.
The hierarchical undulance for any voxel on the geological boundary can be obtained by the steps above. The hierarchical undulance extracted would be increased with the higher grade by the method.
D The extract on of the angle between geolog cal bod es’ surface and trend surface
Some metallogenic factors are controlled by the angle of geological bodies’ surfaces (e.g. The contact zone between magmatic rock and country rock). To express this kind of ore-controlling factor quantitatively, the extraction of angle between interface and trend surface is needed, as well as the extraction of angle between interface and regional field direction. When the geological body is discretized into voxels by three-dimensional raster model, the problem of angle extraction is translated into calculating the angle between the tangent planes of two voxels which are corresponding to two spatial entities. For example, in Fig. 2, if there is a point p in the geological interface (in solid line), the nearest point p in the geological trend surface (in dotted line), the angle θ of two tangent planes, which are respectively across the two points, needs to be calculated. Aiming at the angle extraction problem, this paper presents an angle quantitative extraction method based on Euclidean distance field.
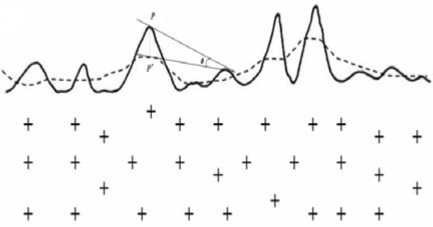
Figure.2 The angle between interfaces
The tangent plane can be defined by a normal vector N ( 4 , B , C ) that is across through the tangent point., which can be seen as the center coordinate (( x 0 , y 0 , z 0 ) of voxel v . Given that the surface is defined by the following equation:
F ( x , У , z ) = 0 (9)
P ( x 0 , y 0 , z 0 ) is a point of curved surface S ,supposed that the partial derivative of the function F ( x , y , z ) is continuous on this point and not equals zero at the same time. In the curved surface S , draw a curve Г that is across an arbitrary point M, supposed that the parametric equation of the curved surface S is :
x = ф(t), у = ^(t), z = ^(t),(a < t < в) (10)
Let t=t 0 that is corresponding to the point P ( x 0 , y 0 , z o ) and <4( t o ), ^ '( 1 0 ), ^ '( t o ) are not all equal zero. The tagent of the curved surface’s equation is
-
x - x 0 = У - У 0 = z - z 0 (11)
^ '( t 0 ) ^ (. t 0 ) ® '( t 0 )
It can be proved that any curve whose tangent passing through point p is in the curved surface, and all these tangent are in the same plane. The equation of tangent plane passing through point M in the curved surface is Fx ( x 0 , У 0 , z 0)( x - x 0 ) + Fy ( x 0 , У 0 , z 0)( У - У 0 ) + F z ( x 0 , У 0 , z 0)( z - z 0 ) = 0 (12) Its normal vector is
-
n = ( F x ( x 0 , У 0 , z 0 ), F y ( x 0 , У 0 , z 0 ), F z ( x 0 , У 0 , z 0 ) ) = N (13)
This paper simulates approximately function F ( x , y , z ) with Euclidean distance field method. By performing the Euclidean distance transform inside and outside of the geological body, the Euclidean distance field of all space can be obtained. Still suppose that when the center coordinate (x 0 ,y 0 ,z 0 ) of voxel v is inside the geological body, distance below zero( F ( x 0 , y 0 , z 0 )<0); when on the geological body, distance is zero( F ( x 0 , y 0 , z 0 )=0); when outside the geological body, distance is above zero( F ( x 0 , y 0 , z 0 )>0). While for Fx , Fy and F z , they can be simulated by gradient operator, this paper adopts Sobel operator[19] to perform approximately calculation. Suppose that the template size of operator is 3×3×3.
Calculate three vector gradient Gx , Gy and Gz of x,y,z, and then the normal vector( G x , G y , G z ) of point p is obtained .
The detailed steps are as follows, which calculates the angle a ofa certain voxel on original interface and the corresponding tangent plane on trend morphology.
Given that there is a voxel v on the interface S ( A ) of original rock mass A, its corresponding voxel v' on the trend surface A' , the respectively normal vectors which is across v and v ‘ are n and n ' ,then the steps are as follows:
Step1: Calculate the interface of rock mass. With the Mathematical morphological method, the equation S ( A ) = A ( A © B ) is obtained. Among them, B is a square structure element, calculate geological bodies’ trend morphology by the method in paragraph 1.3.1 . Meanwhile, with the same method, another equation S ( A') = A' - ( A' © B )
is obtained;
Step2: Calculate Euclidean distance field values outside and inside S(A), which are respectively Eouter(i,j,k) and Einner(i,j,k) and calculate Euclidean distance field values outside and inside S( A ),which are respectively E outer(i,j,k) and E inner(i,j,k). Simulate the function F(x,y,z) with distance expressed by Eouter(i,j,k) and Einner(i,j,k), the distance value of Eouter(i,j,k) is above zero, while the distance value of Einner(i,j,k) is below zero, the distance value of S(A) is zero. Similarly, simulate the function of F1(x,y,z) with distance of E outer(i,j,k) and E inner(i,j,k);
Step3: For any voxel which is be needed to calculate the angle in S(A), find its corresponding voxel v of S( A ) according to the shortest distance of E outer(i,j,k) and E inner(i,j,k);
Step4: Conduct convolution operation for the function F(x,y,z) with a template, obtain three vector gradient Gx,Gy and Gz of x, y, z for the voxel v, that
ur is n=(Gx,Gy,Gz). Similarly, conduct the same operator
uur to the function F1(x,y,z) and obtain n ;
Step5: Calculate the angle a between two tangent
planes: ur uur n • n'
a = arc c o s
II n n
Step6: Judge whether there is a voxel that has not been calculated the angle yet, if yes, turn Step3; if no, end.
-
IV. Experiment
The above method is applied to the shape analysis of Xinwuli magmatic body in Fenghuangshan ore field for stereoscopic quantitative prediction of concealed ore bodies. In the light of the analysis of the ore-formation law in Fenghuangshan ore field, Xinwuli magmatic body and its shape undulance, other geological structures play an important role in controlling the distribution of ore body. At the same time, the mineralized fracture in Fenghuangshan ore field has a property of obvious slanting north west, which is mainly relevant to regional tectonic stress field. In order to express regional extruding far crustal stress effects on mineralization distribution, take the angle of tectonic extrusion stress direction and original interface of rock mass in Xinwuli as the ore-controlling index. Based on the 3-dimensioanal raster model shown in fig.1, the aforementioned 3-dimentional morphological analysis method for geological bodies and the morphological extraction model are adopted to extract the shape trend and undulance of Xinwuli magmatic body. Finally, the quantitative simulation of the shape undulance is achieved by the Euclidean distance field model. The models are solved by computer program.
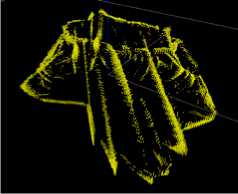
Fig. 3 shows the shape trend with the radius of 400m ball structure element by taking Opening and Closing filtering on the basis of 3-dimensional raster model of Xinwuli magmatic body. Fig. 4 shows the first grade extraction model of the concave and convex parts of the shape undulance for the rock mass. Fig. 5 shows the second grade extraction model of the concave and convex parts of the shape undulance for the rock mass. Fig. 6 shows the quantitative model (from -200m to -700m elevation) of the shape undulance factor, that is the Euclidean distance field model for the concave and convex parts by 3-dimensional Euclidean distance transform. Fig. 7 shows the quantitative model of the angle between extrusion stress surface and original interface. the angle index on a certain voxel in the geological space is considered as the angle value for the voxel on the interface which is nearest to that certain voxel.
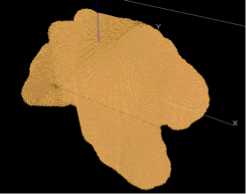
Fig. 3 The The shape trend of Xinwuli magmatic body
(a) the concave parts
( b ) the convex parts
Fig. 4 Hierarchically extracted the first grade concave and convex parts
of the shape undulance
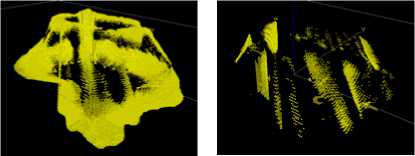
(a) the concave parts
( b ) the convex parts
Fig. 5 Hierarchically extracted the second grade concave and convex parts of the shape undulance
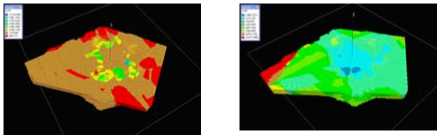
(a) the first grade factor wr1G ( b ) the second grade factor wr2G Fig. 6 The raster quantitative model (from -200m to -700m elevation) of the shape undulance factors ( wr1G and wr2G )
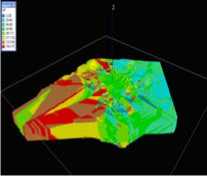
Fig. 7 The raster quantitative model (from -200m to -700m elevation) of regional extruding far crustal stress field factor (aIP)
-
V. Conclusions
With the complex shape analysis of the ore-controlling geological bodies with overlay surfaces in stereoscopic quantitative prediction of concealed ore bodies, a new 3-dimensional morphological analysis method is proposed by applying mathematical morphology and Euclidean distance transform theory in this paper. Based on the 3-dimensional discrete raster models of geological bodies in the real 3-dimensional visualization environment, the corresponding morphological analysis algorithm and mathematical model are established. This method is applied to the morphological analysis for XinWuli magmatic body in Fenghuangshan ore-field in Tongling, Anhui province. The shape trend and shape undulance are extracted, as well as the angle between geological interface and trend surface is calculated for the purpose of achieving the geological ore-controlling factors. The trend extraction avoids the trend surface reconstruction for the complex geological body, which is not adaptable to be analyzed by the traditional trend-residue method. By dint of mathematical morphology filtering, when the radius of ball structural elements is changed, a further Hierarchical extraction of the shape undulate classification could be taken by only several times of Opening and Closing filtering operations.
The 3-dimensional morphological analysis method for the complex geological bodies provides a way to extract geometric parameters of geological bodies for implementing the quantitive extration of ore-controlling factors. Therefore, it is very significant for the quantitative prediction of concealed ore bodies in 3-dimensional space.
References Three-dimensional Morphological Analysis for Geological Bodies and Application
- ZHAO Peng-da. Three-Component Quantitative Resource Prediction and Assessments: Theory and Practice of Digital Mineral Prospecting [J]. Earth Science-Journal of China University of Geosciences, vol. 27, no. 5, pp. 482-489, 2002. (in Chinese).
- MAO Xian-cheng, ZOU Yan-hong, LU Xiao-qin, et al. Quantitative analysis of geological ore-controlling factors and stereoscopic quantitative prediction of concealed ore bodies [J]. J Cent South Univ Technol, vol. 16, no.6, pp. 987−993, 2009.
- Simon W. H, 3D geoscientific modeling computer Technique for geological characterization [M], 1994, South Sea Int Press Ltd., Hongkong.
- Wu Li-xing. Topological relations embodied in a generalized tri-prism (GTP) model for a 3D geoscience modeling system [J]. Computers & Geosciences, vol. 30, no. 4, pp. 405-418, 2004.
- Gong Jian-ya, Cheng Peng-gen and Wang Yan-dong. Three-dimensional modeling and application in geological exploration engineering [J]. Computers & Geosciences, vol. 30, no. 4, pp. 391-404, 2004.
- Jing Ming, Mao Pan, Qu .Hong-gang, et al. GSIS: A 3D geological multi-body modeling system from netty cross-sections with topology [J]. Computers & Geosciences, vol. 36, pp. 756-767, 2010.
- Sud A, Govindaraju N, Gayle R, Manocha D. Interactive 3D distance field computation using linear factorization[C]. Proceedings I3d 2006 - ACM SIGGRAPH Symposium on Interactive 3D Graphics and Games. USA: Association for Computing Machinery, 2006, pp. 117-124.
- Jones M W, Baerentzen J A, Sramek M. 3D distance fields: A survey of techniques and applications [J]. Transactions on Visualization and Computer Graphics, vol. 12, no. 4, pp. 581-599, 2006.
- Sakuragi F, Nakamoto M, Sasama T, Nakajima Y, Sato Y, Tamura S. System simulator for structural description and error analysis of multimodal 3D data integration systems [J]. Electronics and Communications in Japan, vol. 90, no. 8, pp. 325-338, 2007.
- Zuliansyah M, Supangkat S H, Priyana Y, Machbub C. 3D topological relations for 3D spatial analysis[C]. 2008 IEEE International Conference on Cybernetics and Intelligent Systems, CIS 2008. USA: Inst. of Elec. and Elec. Eng. Computer Society, 2008.
- Fetita C, Brillet P-Y, Prêteux F J. Morpho-geometrical approach for 3D segmentation of pulmonary vascular tree in multi-slice CT[C]// Pluim J. P. W, Dawant B. M. Medical Imaging 2009 - Image Processing. USA: Proc. SPIE, 2009.
- Felix J H S, Cortez P C, Holanda M A, Albuquerque V H C, Colaco D F, Alexandria A R. Lung and chest wall structures segmentation in CT images[C]. Proceedings of VIPIMAGE 2007 - 1st ECCOMAS Thematic Conference on Computational Vision and Medical Image Processing. Netherlands: Taylor and Francis/Balkema, pp. 291-294, 2008,
- Naegel B. Using mathematical morphology for the anatomical labeling of vertebrae from 3D CT-scan images [J]. Computerized Medical Imaging and Graphics, vol. 31, no. 3, pp. 141-156, 2007.
- Kiwanuka F N, Ouzounis G K, Wilkinson M H F. Surface-area-based attribute filtering in 3D[C]. Mathematical Morphology and Its Application to Signal and Image Processing. Netherlands: Springer Berlin / Heidelberg, pp. 70-81, 2009.
- Tankyevych O, Talbot H, Dokladál P, Passat N. Spatially-variant morpho-hessian filter: Efficient implementation and application[C]. Mathematical Morphology and Its Application to Signal and Image Processing. Netherlands: Springer Berlin / Heidelberg, pp. 137-148, 2009.
- Li Yong, WU Hua-yi. Filtering airborne LIDAR data based on morphological gradient [J]. Journal of Remote Sensing, vol. 12, no. 4, pp. 633-639, 2008. (in Chinese).
- TAO Jin-hua, SU Lin, LI Shu-kai. Method of extracting building model from lidar point cloud [J]. Infrared and Laser Engineering, vol. 38, no. 2, pp. 340-345, 2009. (in Chinese).
- LIN Hong-Wei, WANG Guo-Jin. Three dimensional signed Euclidean distance transform and its applications [J]. Chinese Journal of Computers, vol. 26, no. 12, pp. 1645-1651, 2003. (in Chinese).
- Gonzalez R G, Woods R E. The digital image processing (The second edition) [M]. Beijing: China Electronic Industry Press, 2003: 463-474. (in Chinese).
