Three-dimentional modelling of external mechanical effects on devices and machinery in SolidWorks Simulation

Author: Martyushev S.G., Dementev A.A.
Journal: Сибирский аэрокосмический журнал @vestnik-sibsau
Section: Авиационная и ракетно-космическая техника
Article in issue: 1 т.19, 2018.
Free access
The applications of space vehicles in the modern world are extensive enough: satellite communication, broadband and narrowband broadcasting, meteorology, scientific research and others. For this reason, modern space vehicles use the latest achievements of science and technology. It allows us to create easy, compact space vehicles with a wide functional. The devices developed in the Research and Production Center “Polus” should meet the requirements of advanced reliability both for regular and for emergency operating modes. One of the scopes of application of such devices is designing of space vehicles. The main task at designing and manufacturing of devices and their components is reliability maintenance. This is a primary requirement to custom-made products for which repair at major failures is extremely labor-consuming. At the same time, serious demands are made to mass, dimensional characteristics, power consumption, payloads, noise characteristics of separate blocks and devices, and other technical parameters. However, it is necessary to consider that at high requirements to characteristics the process of creation of products should be technological. There are various techniques to define reliability of technical devices and their components. One of such ways is carrying out the whole complex of tests simulating a full cycle of operation of the device or a mechanism. However, experimental techniques have essential disadvantages, namely: high cost and long duration. Mathematical modelling allows us to reduce expenses on mock-up designing, engineering time, risks, to reveal weak points, to develop recom- mendations for strengthening the design and to give preliminary conclusions about firmness of the device to loads. Along with thermal, electrostatic and frequency characteristics, mechanical effects play an important role, i. e. dynamic and static loads. In this paper, the results of modelling of external mechanical effects on the device are pre- sented. Numerical modelling of quasi-static loading and effect on the device of random vibration is conducted and the modal analysis is carried out. Oscillation modes of the first three resonant frequencies of the device, stress, displace- ments and accelerations diagrams are obtained. Load factors, the maximum values of displacements and accelerations at impact actions are determined.
Modelling, mechanical analysis, durability, quasi-static loading, vibration, shock load
Short address: https://sciup.org/148177806
IDR: 148177806 | UDC: 004.38:62
Трехмерное моделирование внешних механических воздействий на приборы и устройства в SolidWorks Simulation
Области применения космических аппаратов в современном мире достаточно обширны: спутниковая связь, широкополосное и узкополосное вещание, метеорология, научные исследования и пр. Именно поэтому современные космические аппараты используют все последние достижения науки и тех- ники. Это позволяет создавать легкие, компактные космические аппараты с широким функционалом. К приборам, разрабатываемым в АО «НПЦ «Полюс», предъявляются требования повышенной надежности как в штатных, так и нештатных режимах работы. Одной из сфер применения подобных приборов является проектирование космических аппаратов. Главной задачей при проектировании и изготовлении приборов и узлов является обеспечение надежности. Это первостепенное требование к штучным несерийным изделиям, для которых ремонт при серьезных неис- правностях чрезвычайно трудоемок. В то же время к ним предъявляются серьезные требования к массовым, габаритным характеристикам, энергопотреблению, полезным нагрузкам, шумовым характеристикам отдельных блоков и приборов, а также прочим техническим параметрам. Однако следует учитывать, что при высоких требованиях к характеристикам процесс создания изделий должен быть технологичен. Существуют различные методики определения надежности приборов и узлов технических устройств. Одним из таких способов является проведение целого комплекса испытаний, имитирующих полный цикл функ- ционирования прибора или устройства. Однако экспериментальные методики имеют существенные недос- татки, а именно, высокую стоимость и большую временную длительность. Математическое моделирование позволяет уменьшить расходы на макетное проектирование, сократить время разработки, уменьшить риски, выявить слабые места, разработать рекомендации по усилению конструкции и дать предварительное заклю- чение о стойкости прибора к нагрузкам. Наряду с термическими, электростатическими и частотными характеристиками важную роль играют механические воздействия. Динамические и статические нагрузки. Представлены результаты моделирования внешних механических воздействий на прибор. Проведено численное моделирование квазистатического нагру- жения и воздействия на прибор случайной вибрации, проведен модальный анализ. Получены моды колебаний первых трех резонансных частот прибора, эпюры напряжений, перемещений и ускорений. Определены коэф- фициенты запаса прочности, максимальные значения перемещений и ускорений при ударных воздействиях.
Text of the scientific article Three-dimentional modelling of external mechanical effects on devices and machinery in SolidWorks Simulation
Introduction. At present, when developing radioelectronic and electronic equipment, much attention is paid to the creation of three-dimensional models of devices. This allows you to reduce the cost of breadboard design and development time, to identify weak points, to develop recommendations for strengthening the design and to give a preliminary conclusion about the resistance of the device to loads. In this regard, numerical modelling is widely used in the design as an initial stage of complex testing of devices. With the help of specialized software the problems of strength, stability, dynamics, composites mechanics, hydrodynamics and heat transfer are solved [1–13].
The specific features of the devices, being developed in the Research and Production Center “Polus”, is that they must be rigid and strong. The load-bearing elements of the structure consist of plates and frames. In conditions of weight limitations, it is necessary to ensure the structural strength of devices and machinery in accordance with the specification.
Thus, the purpose of this work is to analyze the design of the device for resistance to external mechanical effects.
The analysis extends to the automation unit (AB). Mechanical loads are defined according to the specifications. The analysis was carried out by means of the SolidWorks software [14; 15].
The design of the automation unit (AB). According to the dimensional outline the AB has dimensions 340×200×200 mm and weight (6.7 ± 0.2) kg.
The automation unit is structurally composed of four unified bases of the torque control channels (TCC) and a filter located on the upper surface of the TCC, tightened at the corners by pins. The cases of the TCC are made of the alloy MA2-1 State Standard 21990–76 and have a wall thickness of 2 mm and a base of 3 mm. On each of the four bases, PCBs of glass fiber textolite STF-2-35-OS technical specification TU 16-503.161–83 are pressed. The side surfaces of the AB are covered with covers of the alloy MA2-1 State Standard 21990–76 with the thickness of 3 mm. To mount the device on its body on both sides there are six mounting feet.
Finite element model of the device. The modelling process begins with the creation of a geometric model of the AB (fig. 1), performed in accordance with the set of design documentation. In the model there are no elements that lack the effect of strengthening of the structure, but
their mass and the mass of radioelectronic devices are taken into account.
The software automatically creates a combined grid on a geometric model (fig. 2). The number of grid nodes is 1 501 193, and the elements – 888 873. The quality of the grid is determined by means of the Jacobian. For the given grid with a minimum (2 mm) and maximum (25 mm) side dimensions of its elements, the Jacobian is 29.4 (fig. 3). Its acceptable value is considered not more than 40.
The following material parameters were taken into account in the analysis (tab. 1): density; Poisson’s ratio; modulus of elasticity (Young’s modulus); tensile yield strength; strength limit.
The requirements for resistance to external effects. In accordance with the requirements specification the device must remain operational after various mechanical effects. During the modelling quasi-static effects, impact loads specified in the form of a shock spectrum and random and sinusoidal vibrations were used.
Modal Analysis. The eigenfrequencies, forms (modes) of vibrations of the AB model (fig. 4–6) and the resulting coefficient of mass participation are determined by the modal analysis (fig. 7).
Modelling of quasi-static effect and sinusoidal vibration. Border conditions:
– all elements of the model have a global contact with one another;
– the effect of gravity (acceleration of gravity) is taken into account;
– type of material model – linear, elastic, isotropic;
– the device is rigidly fixed over the entire surface of the mounting feet;
– the impact is applied to the base of the model consecutively in each of the three mutually perpendicular directions.
The natural frequencies of the AB model, obtained as a result of the modal analysis, exceed 150 Hz. Therefore, the calculation of sinusoidal vibration can be replaced by calculation for a quasi-static effect, since the stress arising in the elements of the model under the effect of a sinusoidal vibration will correspond to the stress under quasi-static loads.
In the case of quasi-static effect on the AB model, the maximum stress appears in the bases of the TCC (tab. 2).
As a result of the calculation, the values of the maximum stress and displacements under the effect along each of
the three mutually perpendicular directions were obtained.
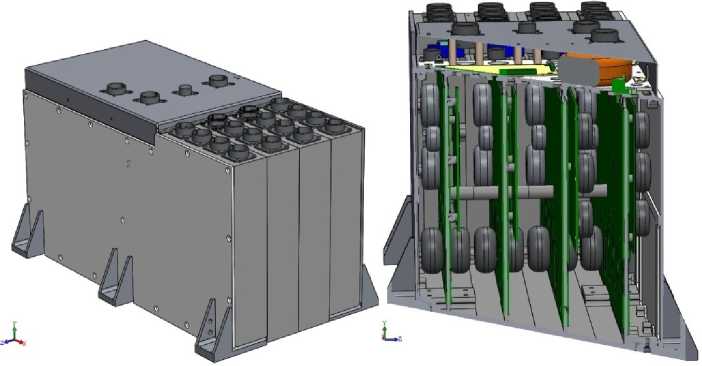
Fig. 1. Geometrical model of automation block (AB)
Рис. 1. Геометрическая модель БА
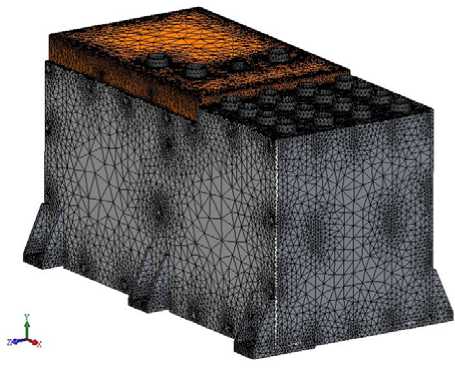
Fig. 2. A grid on geometrical model AB
Рис. 2. Сетка на геометрической модели БА
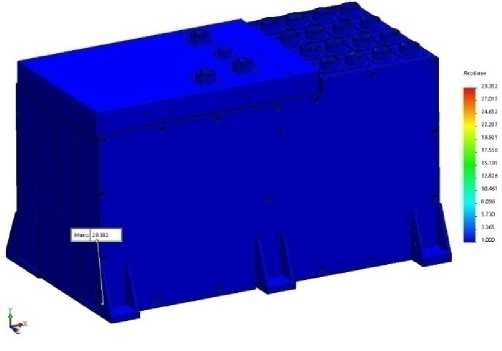
Fig. 3. Jacobian distribution
Рис. 3. Эпюра якобиана
Table 1
|
Material parameter |
Parameter value |
|||
|
Steel 10 shorttime strength, State Standard 1050–88 |
Magnesium alloy MA2-1, State Standard 21990–76 |
Aluminum alloy AMg6 2, State Standard 21631–76 |
Glass textolite, STF-2-35-OS technical specification TU 16-503.161–83 |
|
|
Density kg/m3 |
7 856 |
1 790 |
2 640 |
1700 |
|
Elastic modulus MPa |
186 000 |
41 160 |
69 500 |
21 000 |
|
Poisson’s ratio |
0.3 |
0.33 |
0.33 |
0.15 |
|
Tensile yield strength, MPa (kgf/mm2) |
205 (20.9) |
137.3 (14) |
147 (15) |
– |
|
Ultimate strength, MPa (kgf/mm2) |
333 (34) |
245.25 (25) |
294 (30) |
300 (30.6) |
Physical-mechanical characteristics of used materials
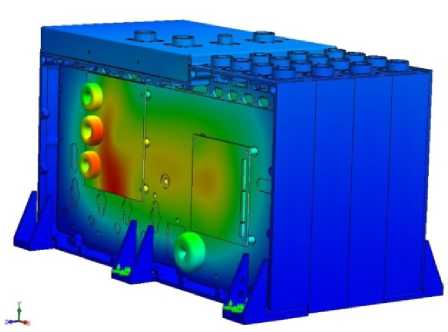
Fig. 4. First form of oscillations of model AB on frequency of 286 Hz
Рис. 4. Первая форма колебаний модели БА на частоте 286 Гц
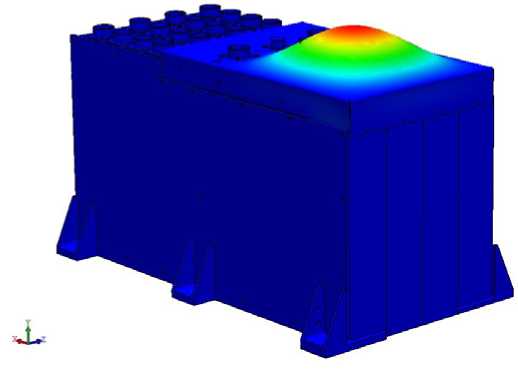
Fig. 5. Second form of oscillations of model AB on frequency of 316 Hz
Рис. 5. Вторая форма колебаний модели БА на частоте 316 Гц
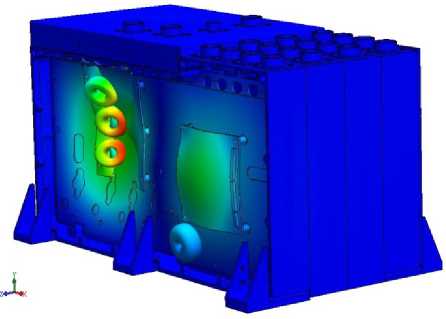
Fig. 6. Third form of oscillations of model AB on frequency of 362 Hz
Рис. 6. Третья форма колебаний модели БА на частоте 362 Гц
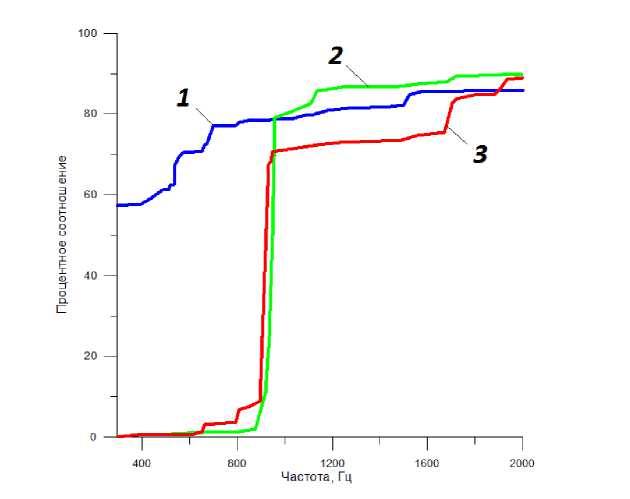
Fig. 7. Result factor of mass participation:
1 – mass participation in a direction of OZ axis; 2 – mass participation in a direction of OY axis; 3 – mass participation in a direction of OX axis
Рис. 7. Результирующий коэффициент массового участия: 1 – массовое участие в направлении оси OZ ; 2 – массовое участие в направлении оси OY ; 3 – массовое участие в направлении оси OX
Values of maximum stress and displacements OX , OY , OZ axes at quasi-static load
The load factor of η elements of the AB model is calculated by the formula
η = σ b ≥ 1, (1)
σ von Mises
where σ b is the yield strength of the material, MPa; σ von Mises is the calculated value of the stress according to Mises, MPa.
For principal stresses σ1, σ2, σ3, the Mises stress is expressed as
Table 2
|
Direction of effect |
The maximum stress, MPa |
The maximum displacement, mm |
|
Along OX axis |
9.7 |
0.012 |
|
Along OY axis |
7.3 |
0.063 |
|
Along OZ axis |
15.9 |
0.072 |
-
= (О1 - О2 )2 + (О2 -Оз )2 + (О1 -Оз )2
-
О von Mises у 2 .
The minimum load factor in the base of the TCC along the OZ axis is n = 8-6 -
Stress and displacement distributions in the AB model under the effect of quasi-static accelerations along three mutually perpendicular axes are obtained (fig. 8–13). The maximum stress along the OZ axis occurs at the base of the TCC.
Modelling of the effect of random vibration. Border conditions:
-
– all elements of the model have a global contact with one another;
-
– damping in the model is 2 % of the critical;
-
– type of material model – linear, elastic, isotropic;
-
– the device is rigidly fixed over the entire surface of the mounting feet;
– the impact is applied to the base of the AB model consecutively in each of the three mutually perpendicular directions.
The maximum stress occurs at the base of the TCC at random vibration in the direction of the OX axis (tab. 3). The values of the maximum stress, accelerations and displacements at the level σ under the effect along each of the three mutually perpendicular directions are obtained.
The damping factor with respect to the critical damping was assumed to be 0.02. The finite element model of the device is presented in Section 2.
The minimum load factor in the base of the TCC along the OZ axis at the level 3σ, calculated by the formula (1), is η = 1.39.
Forms and values of accelerations, displacements and stress in the AB model at the effect of random vibration in the direction of the axes in accordance with tab. 3 are shown in fig. 14–22. In some drawings several elements of the design are hidden for the better visualization of maximum accelerations, displacements and stress.
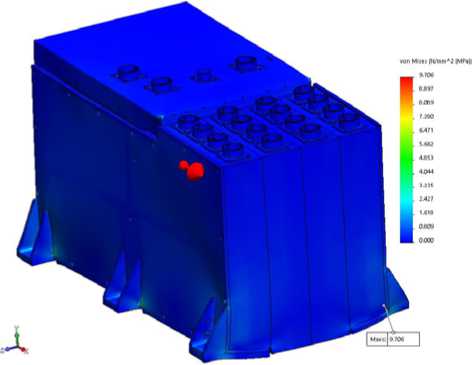
Fig. 8. Distribution of stress in AB model at quasi-static load along OX axis
Рис. 8. Распределение напряжений в модели БА при квазистатическом воздействии по оси ОХ
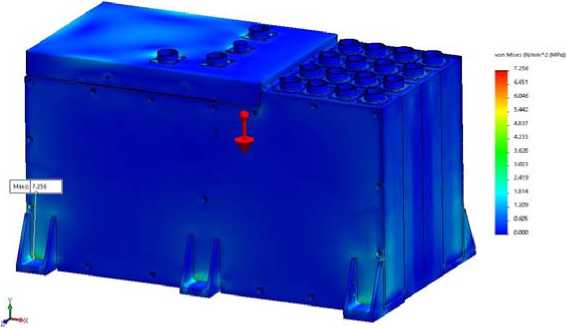
Fig. 9. Distribution of stress in AB model at quasi-static load along OY axis
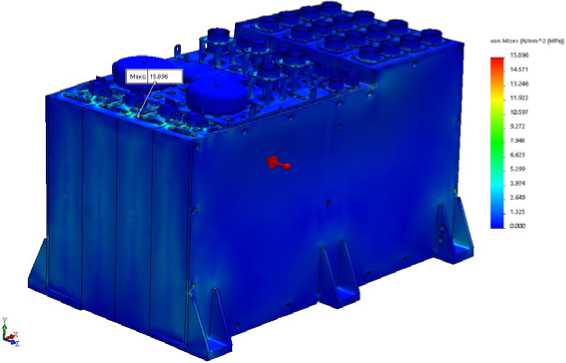
Fig. 10. Distribution of stress in AB model at quasi-static load along OZ axis
Рис. 10. Распределение напряжений в модели БА при квазистатическом воздействии по оси ОZ
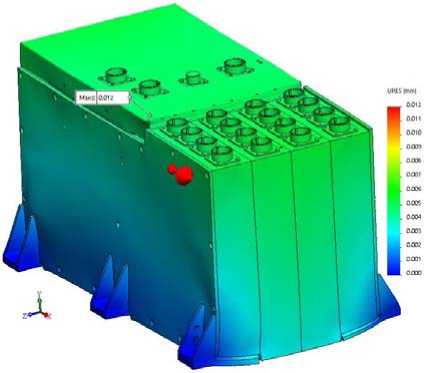
Fig. 11. Distribution of displacement in AB model at quasi-static load along OX axis
Рис. 11. Распределение перемещений в модели БА при квазистатическом воздействии по оси ОХ
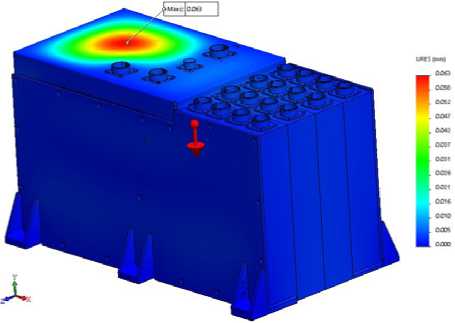
Fig. 12. Distribution of displacement in AB model at quasi-static load along OY axis
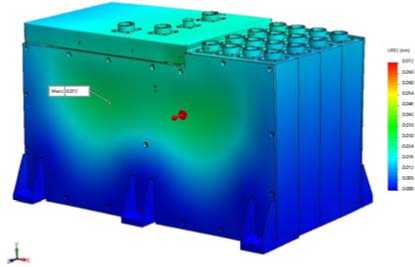
Fig. 13. Distribution of displacement in AB model at quasi-static load along OZ axis
Рис. 13. Распределение перемещений в модели БА при квазистатическом воздействии по оси ОZ
Table 3
Values of maximum stress, displacements and accelerations along OX , OY , OZ axes at effect of random vibration
|
Direction of impact |
The maximum stress, MPa |
The maximum displacement, mm |
The maximum acceleration, g |
|
Along OX axis |
29.8 |
0.006 |
10.98 |
|
Along OY axis |
5.66 |
0.177 |
72.09 |
|
Along OZ axis |
32.9 |
0.135 |
56.05 |
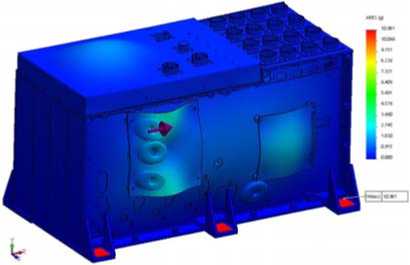
Fig. 14. Distribution of accelerations in AB model at effect of random vibration along OX axis
Рис. 14. Распределение ускорений в модели БА при воздействии случайной вибрации по оси ОХ
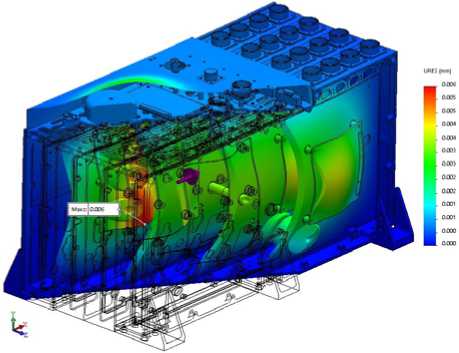
Fig. 15. Distribution of displacements in AB model at effect of random vibration along OX axis
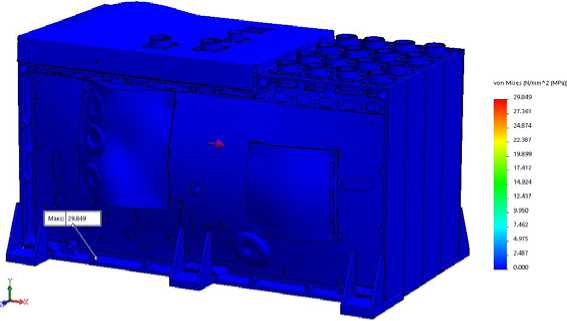
Fig. 16. Distribution of the stress in AB model at effect of random vibration along OX axis
Рис. 16. Распределение напряжений в модели БА при воздействии случайной вибрации по оси ОХ
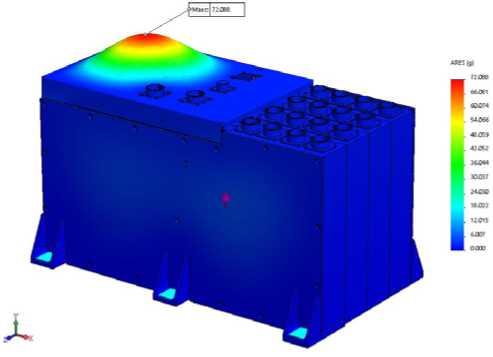
Fig. 17. Distribution of accelerations in AB model at effect of random vibration along ОY axis
Рис. 17. Распределение ускорений в модели БА при воздействии случайной вибрации по оси ОY
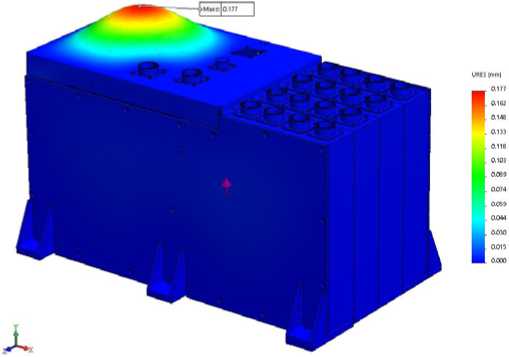
Fig. 18. Distribution of displacements in AB model at effect of random vibration along ОY axis
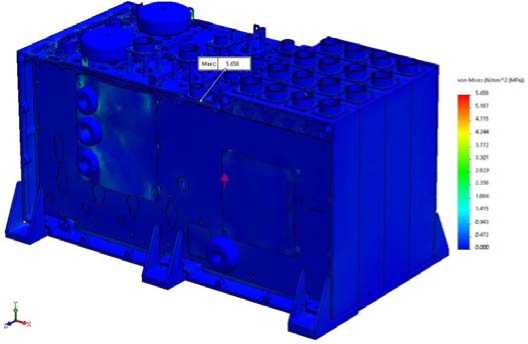
Fig. 19. Distribution of the stress in AB model at effect of random vibration along ОY axis
Рис. 19. Распределение напряжений в модели БА при воздействии случайной вибрации по оси ОY
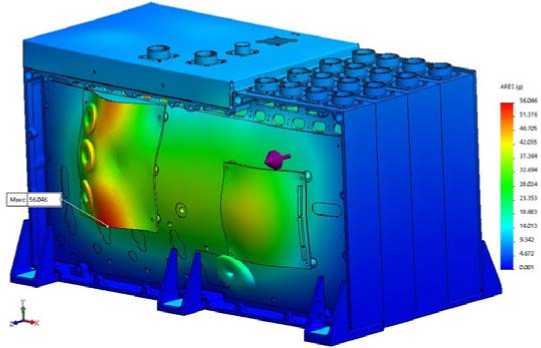
Fig. 20. Distribution of accelerations in AB model at effect of random vibration along ОZ axis
Рис. 20. Распределение ускорений в модели БА при воздействии случайной вибрации по оси ОZ
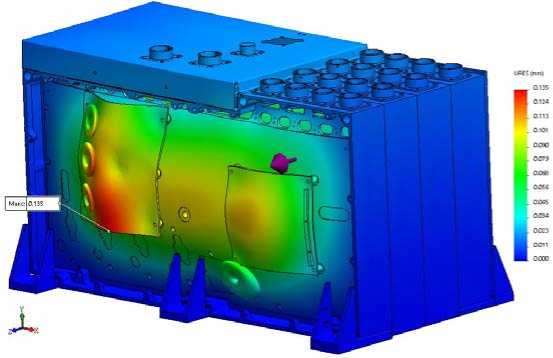
Fig. 21. Distribution of displacements in AB model at effect of random vibration along ОZ axis
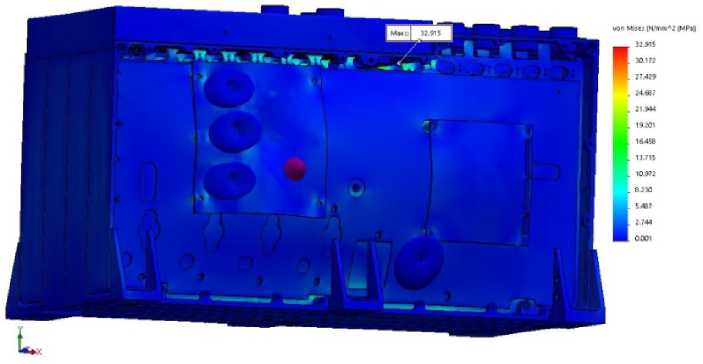
Fig. 22. Distribution of stress in AB model at effect of random vibration along ОZ axis
Рис. 22. Распределение напряжений в модели БА при воздействии случайной вибрации по оси ОZ
To predict the fatigue strength of the AB at given levels of effect of broadband random vibration, the predicted service life of the device can be determined from the formula
Т =------В-----, (2)
F0(σ/σД)m where ТВ is the number of loading cycles; F0 is the lower resonance frequency of the structure, Hz; σ is the maximum stress at the effect of broadband random vibration, MPa; σД is the fatigue strength endurance of the material, MPa; m is the index of the slope of the fatigue curve of the material.
For the bases of the TCC, the following parameters [16] were applied in the calculation: Т В = 1 - 10 7 s; F 0 = 286.6 Hz; m = 9.55. Steel MA2-1 has the following characteristics: σ = 32.915 MPa; σ Д = 100 MPa.
Substituting the values of the parameters in formula (2), we get the predicted service life of the device Т = 1.4 - 10 9 s.
Modelling of the shock action. Modelling of the shock action on the AB, given in the form of an amplitude-frequency spectrum according to tab. 4, is carried out separately along each of the three mutually perpendicular axes: OX , OY , OZ (fig. 23–31).
Border conditions:
-
– all elements of the model have a global contact with one another;
-
– damping in the model is 2 % of the critical;
-
– type of material model – linear, elastic, isotropic;
-
– the device is rigidly fixed over the entire surface of the base;
-
– the impact in the form of a frequency spectrum is applied to the base of the AB consecutively in each of the three mutually perpendicular directions.
The maximum stress at the effect on the OZ axis occurs at the base of the TCC.
The most loaded element of the AB model is the base of the TCC at shock action along the OZ axis. The load factor of the side plate is n = 1.25.
Conclusion. The results of the analysis showed the following:
-
– the calculated minimum eigenfrequency of the AB model is f 01 = 286.6 Hz, which meets the requirements of the technical specifications;
-
– the minimum load factor at quasi-static action and sinusoidal vibration is 8.64 in the direction of the OZ axis;
-
– the minimum load factor at random vibration is 1.39 in the direction of the OZ axis;
-
– the maximum accelerations at random vibration along the OX , OY , OZ axes at the level of 3σ are 32.94g, 216.27g and 168.14g respectively;
-
– the minimum load factor at shock action along the OZ axis is 1.25;
-
– the maximum displacements at shock action along the OX , OY , OZ axes are 0.213, 0.56 and 0.76 mm respectively;
-
– the maximum accelerations at shock action along the OX , OY , OZ axes are 158.51g, 247.53g and 297.55g respectively.
The most critical types of loading are impact in the direction of the OZ axis and the impact of random vibration in the direction of the OZ axis. At the same time, the load factor in the base of the TCC is 1.25 and 1.39 respectively.
Based on the results of the analysis, locations for the installation of vibration-survey converters have been determined to measure the changes in the amplitude-frequency characteristics of the AB before and after the dynamic effects. When carrying out mechanical tests, the vibration-survey converters are installed on the side cover of the TCC, on the side of the base of the TCC located in the middle of the device (fig. 32), and on the upper part of the base of the TCC between the connectors at points 1 , 2 and 3 .
Thus, the analysis has shown that the design of the AB model meets the requirements of the technical specifications for resistance to external mechanical effects.
Table 4
|
Direction of impact |
The maximum stress, MPa |
Safety factor, η |
The maximum displacement, mm |
The maximum acceleration, g |
|
Along OX axis |
29.222 |
4.7 |
0.213 |
158.512 |
|
Along OY axis |
79.083 |
1.74 |
0.555 |
247.531 |
|
Along OZ axis |
109.84 |
1.25 |
0.758 |
297.549 |
Values of maximum stress, displacements and accelerations along OX , OY , OZ axes at shock action
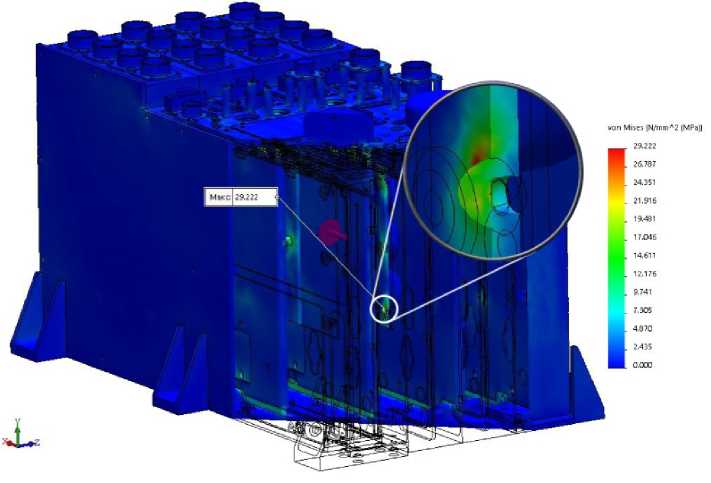
Fig. 23. Distribution of stress in AB model at shock action along OX axis
Рис. 23. Распределение напряжений в модели БА при ударном воздействии по оси OX
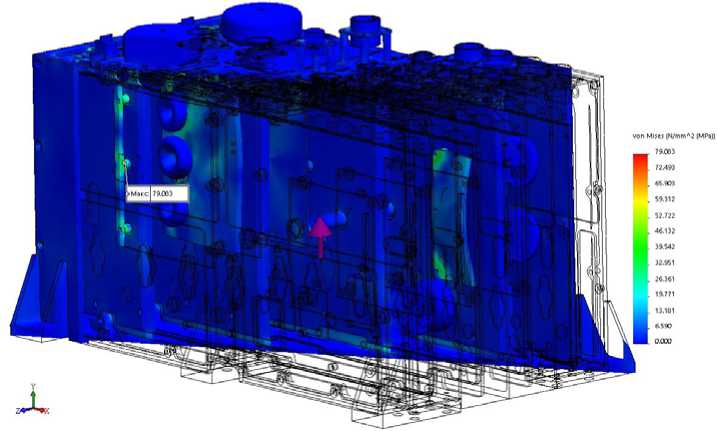
Fig. 24. Distribution of stress in AB model at shock action along OY axis
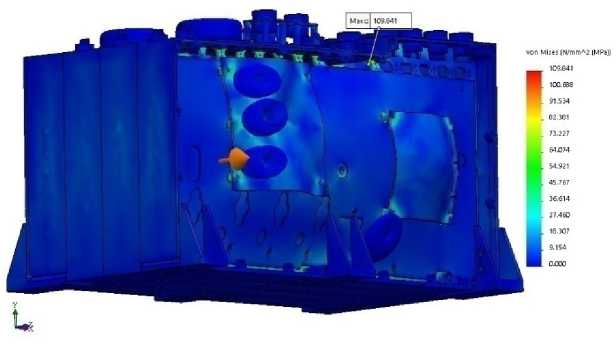
Fig. 25. Distribution of stress in AB model at shock action along OZ axis
Рис. 25. Распределение напряжений в модели БА при ударном воздействии по оси OZ
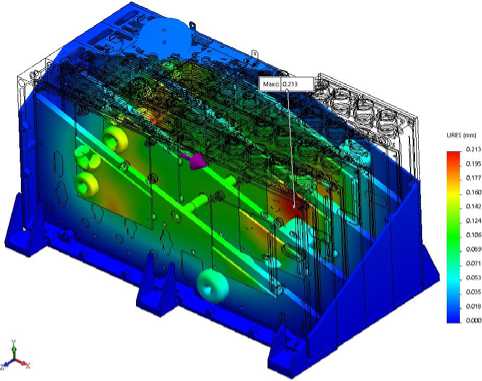
Fig. 26. Distribution of displacements in AB model at shock action along OX axis
Рис. 26. Распределение перемещений в модели БА при ударном воздействии по оси OX
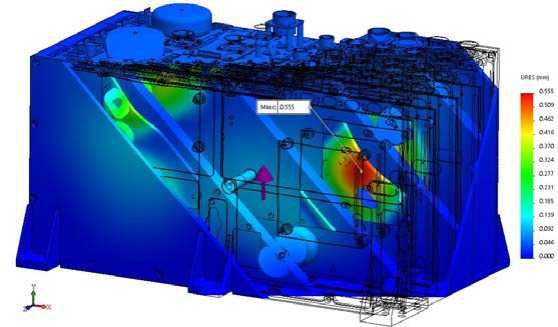
Fig. 27. Distribution of displacements in AB model at shock action along OY axis
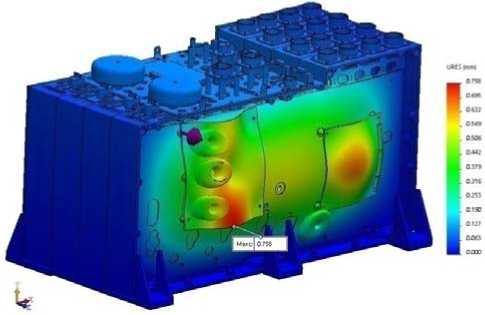
Fig. 28. Distribution of displacements in AB model at shock action along OZ axis
Рис. 28. Распределение перемещений в модели БА при ударном воздействии по оси OZ
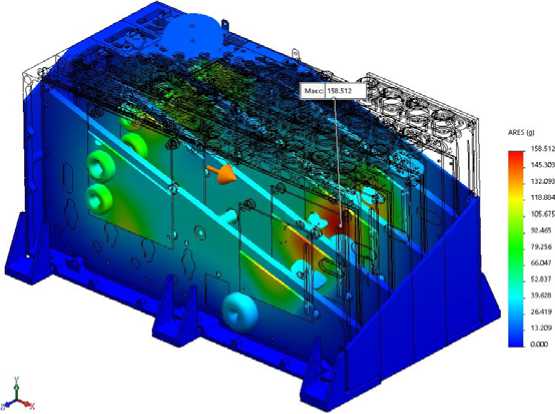
Fig. 29. Distribution of accelerations in AB model at shock action along OX axis
Рис. 29. Распределение ускорений в модели БА при ударном воздействии по оси OX
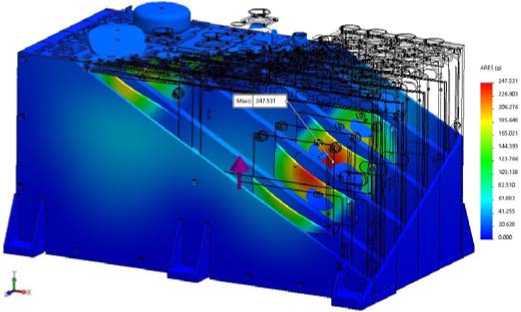
Fig. 30. Distribution of accelerations in AB model at shock action along OY axis
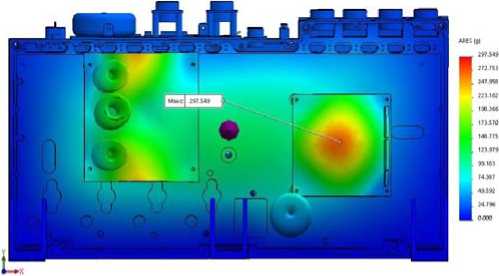
Fig. 31. Distribution of accelerations in AB model at shock action along OZ axis
Рис. 31. Распределение ускорений в модели БА при ударном воздействии по оси OZ
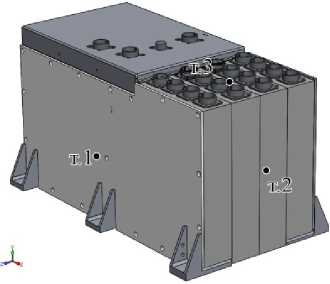
Fig. 32. Installation location of vibration-survey converters on AB
Рис. 32. Места установки виброизмерительных преобразователей на БА
References Three-dimentional modelling of external mechanical effects on devices and machinery in SolidWorks Simulation
- Simulation and Modeling of Single Point Incre-mental Forming Processes within a Solidworks Environment/L. M. Gómez-López //Procedia Engineering. 2013. Vol. 63. P. 632-641.
- Glodová I., Lipták T., Bocko J. Usage of Finite Element Method for Motion and Thermal Analysis of a Specific Object in SolidWorks Environment//Procedia Engineering. 2014. Vol. 96. P. 131-135.
- Hong-yang Zhang, Tong-chun Li, Zong-kun Li. Modeling in SolidWorks and analysis of temperature and thermal stress during construction of intake tower//Water Science and Engineering. 2009. Vol. 2. P. 95-102.
- CFD simulation study of shell and tube heat exchangers with different baffle segment configurations/A. S. Ambekar //Applied Thermal Engineering. 2016. Vol. 108, 5 Sep. P. 999-1007.
- 3D FEM for Sintering of Solar Cell with Boron Back Surface Field Based on Solidwork Simulation/Liang Yu //IERI Procedia. 2012. Vol. 1. P. 81-86.
- Design, simulation and optimization of a compound parabolic collector/E. Bellos //Sustainable Energy Technologies and Assessments. 2016. Vol. 16. P. 53-63.
- The impact of internal longitudinal fins in parabolic trough collectors operating with gases/E. Bellos //Energy Conversion and Management. 2017. Vol. 135. P. 35-54.
- Kinematic and Dynamic Analysis of Planar Mechanisms by Means of the SolidWorks Software/J. Vavro Jr. //Procedia Engineering, 2017. Vol. 177. P. 476-481.
- Direct Numerical Simulation on Melting Phase Change Behavior in Open-cell Metal Foam/Xiaohu Yang //Energy Procedia. 2017. Vol. 105. P. 4254-4259.
- Numerical Simulation of Forced External Circulation Standing Column Well Based on CFD/Song Wei, //Procedia Engineering. 2017. Vol. 205. P. 3178-3185.
- Finite Element Analysis for Stress Distribution of Hand Tool Harvester/M. A. H. A. Ssomad //Procedia Engineering. Vol. 68. 2013. P. 219-224.
- I. S. S. Sharifah, A. T. B. S. Tengku Nurul, M. K. Nor Khairusshima. Thermal Modelling and Analysis of Batik Canting Design//Procedia Engineering. 2017. Vol. 184. P. 326-333.
- Numerical Simulation of Fluid Flow inside the Valve/Qin Yang //Procedia Engineering. 2011. Vol. 23. P. 543-550.
- Алямовский А. А. Инженерные расчеты в Solid-Works Simulation. М.: ДМК Пресс, 2010. 464 с.
- Алямовский А. А. SolidWorks Simulation. Инженерный анализ для профессионалов: задачи, методы, рекомендации. М.: ДМК Пресс, 2015. 562 с.
- Физическое материаловедение. В 3 т. Т. 3. Физико-механические свойства металлов и сплавов: пер. с англ./под ред. Р. У. Кана и П. Хаазена. М.: Металлургия, 1987.
