Throughput and Delay Analysis of Database Replication Algorithm

Author: Sanjay Kumar Yadav, Gurmit Singh, Divakar Singh Yadav
Journal: International Journal of Modern Education and Computer Science (IJMECS) @ijmecs
Article in issue: 12 vol.5, 2013.
Free access
Recently, (PDDRA) a Pre-fetching based dynamic data replication algorithm has been published. In our previous work, modifications to the algorithm have been suggested to minimize the delay in data replication. In this paper a mathematical framework is presented to evaluate mean waiting time before data can be replicated on the requested site. The idea is further investigated and simulation results are presented to estimate the throughput and average delay.
Database replication, throughput, average delay
Short address: https://sciup.org/15014613
IDR: 15014613
Text of the scientific article Throughput and Delay Analysis of Database Replication Algorithm
Published Online December 2013 in MECS DOI: 10.5815/ijmecs.2013.12.07
Database management systems are among the most important systems that are driving the information transfer and storage functionality [1-11]. In Internet applications, a large number of users that are geographically dispersed all over the world may routinely query and update the same database. In this environment which generally changes with time, the location of the data can have a significant impact on application response time and availability. In a centralized approach only one copy of the database is managed. This approach is simple since contradicting views among replicas are not possible. However, the centralized replication approach suffers from two major drawbacks:
-
• High server load or high communication latency for remote clients.
-
• Sometime server may not be available due to the down time or lack of connectivity. Clients in portions of the network that are temporarily disconnected from the server cannot be serviced.
The server load and server downtime problems can be addressed by replicating the database servers to form a cluster of peer servers that coordinate updates. Wide area database replication coupled with a mechanism to direct the clients to the best available server (networkwise and load-wise) [12] can greatly enhance both the response time and availability. A fundamental challenge in database replication is maintaining a low cost of updates while assuring global system consistency. The problem is magnified for wide area replication due to the high latency and the increased likelihood of network partitions in wide area settings [13].
Therefore, in database replication, the location of nodes and their availability is important. In our previous work, PDDRA (Pre-fetching Based Dynamic Data Replication Algorithm [14]) has been modified to reduce the network based latency and a mathematical model is presented to evaluate the throughput and average delay [15]. This paper further investigates the proposed scheme, and simulation results are presented to evaluate the throughput and average delay.
The rest of the paper is organized as follows: In section 2, the PDDRA algorithm is described for the completeness of the paper. The proposed scheme is detailed in section 3. The mathematical model is detailed in section 4. The simulation results are presented in section 5. The major conclusions of the paper are discussed in section 6.
-
II. RELATED WORK
-
A. PDDRA: Pre-fetching Based Dynamic Data Replication Algorithm [14]
In [14] a pre-fetching based dynamic data replication algorithm is presented. In this algorithm the basic idea is to increase the throughput and minimize the latency by pre-fetching of the some of the required data, these replicas will be requested in the near future with a high probability and it is better to replicate these files to requester node so the next time that the grid site needs them, it will access them locally, decreasing access latency and response time. The architectural layout of the algorithm is illustrated in Fig. 1. Here, the grid sites are located at the bottom of the architecture, and consist of storage and/or computing elements. The collection of multiple grid sites constitutes a Virtual Organization (VO). A Local Server (LS) for every Virtual Organization (VO) and the Replica Catalog (RC) is located at Local Server. It must be remembered that the available bandwidth between the sites within a VO is higher than bandwidth between Virtual Organizations. Hence, accessing a file that is located in the local VO is faster in comparison to one that is located in the other VO. The upper layer consists of a Regional Server (RS) and each RS consists of one or more VOs. These regional servers are connected through the internet, so it may be possible that the transferring of files between them takes a long time. There is also a Replica Catalog located at each RS that is a directory of all the files stored at that region. Whenever a file that is not stored in the current VO is required, the RC of RS is asked for determining which VOs have the requested file. Suppose that grid site ‘A’ requests a file that is not stored locally. It asks the RC to determine which sites have the requested file. For reducing access latency, bandwidth consumption and response time, it is better to pre-fetch replicas that are probable to be requested by the requester grid site in the near future. When a required file is not in the current VO and is stored in the other VOs, a request is sent to RS. Then RS searches on its Replica Catalog table and determines the locations of the requested file in other VOs. In such situations only the required file will be replicated and because of low bandwidth between VOs, high propagation delay time and consequently high replication cost, pre-fetching will not be advantageous and will not be done. In addition in this paper [14] the authors have assumed that members in a VO have similar interests of files, so file access patterns of different VOs differ and consequently a file from a different VO should not be pre-fetched for the requester grid site in other VO, because their requirements and access patterns are different. So only the required file will be replicated and pre-fetching will not be performed.
The algorithm is constructed on the basis of following assumptions:
-
1. Members in a VO have similar interest in files.
-
2. For predicting the future accesses, past
-
3. Files that will be accessed in the near future can be predicted by mining the past file access patterns. PDDRA consists of three phases:
sequence of accesses should be stored.
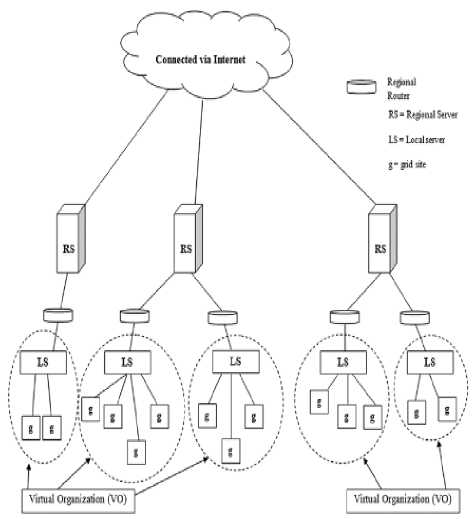
Figure. 1: existing pre-fetching based dynamic data replication algorithm (PDDRA)
-
1) Phase 1: Storing file access patterns
In phase 1, file access sequences and data access patterns are stored in a database.
-
2) Phase 2: Requesting a file and performing replication and pre fetching
In the second phase a grid site asks for a file and replication is accomplished for it, only if it is beneficial. Adjacent files of the requested file are also pre-fetched for the requester grid site in this phase.
-
3) Phase 3: Replacement
If there was enough space in storage element for storing a new replica, it will be stored; otherwise an existing file should be selected for replacement. In the replacement old files that are not used for some time are replaced.
-
B. Limitations of Existing PDDRA
-
1) The PDDRA algorithm tries to minimize the access time using pre-fetching mechanism. However, due to the limited bandwidth of the access network sometimes it may not be possible to fetch data as per our will, and request will be in queue, this leads to further waiting and in turn will increase the replication time. In pre-fetching artificial neural network based algorithms are used, which are not 100% efficient.
-
2) Members of VO may have different interests.
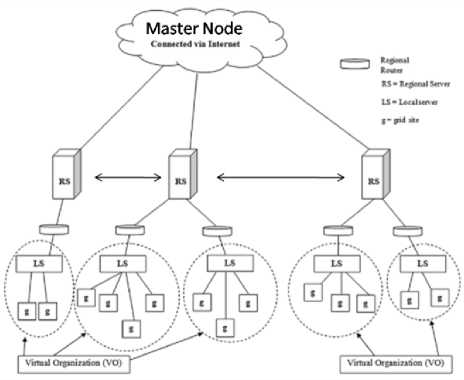
Figure. 2: modified pre-fetching based dynamic data replication algorithm (PDDRA)
-
III. MODIFIED SCHEME [15]
-
1. In the modified scheme the internet cloud will be considered as master node as it can be assumed that the data is available on the internet for replication (Fig. 2).
-
2. If any VO searches for any data first it will search in RS and then it will search on internet. If data is locally available at any RS then it will be replicated and there will not be any need to connect through the master node.
-
3. There is a possibility that the data may not be available at RS, hence, a simultaneous request is sent to both RS and master node, if access of master node is in queue for let’s say time t q then
-
4. The three phases of the above PDDRA will be implemented as explained above.
local search at RS will be done for time sq .
-
IV SIMPLIFIED MATHEMATICAL FRAMEWORK
The replicated data is either available locally or it is available globally i.e., at the internet. Therefore, when requests are generated, some of the generated requests will be full-filled locally and leftover requests will be fetched from internet (master node). In this section a mathematical framework is detailed to estimate the average response time of all the transactions.
-
A. Transaction Processing and Arrival Rates
The arrival of the updates and query transactions are in general random in nature. However, where the arrival of updates and query transactions are frequent, then, Bernoulli model is used. Here, we assumed that update transactions are to be propagated asynchronously to the secondary copies. Furthermore, transactions are also assumed to be executed at a single site, either the local or a remote site.
Taking locality, update propagation, and relaxed coherency into account, the total arrival rate of transactions of type i , (1 < i < n ) , at a single site is given by [15], and is represented by equation 1.
TABLE 1: List of Parameters
|
Parameters |
Meaning |
|
n |
Number of cites |
|
n |
Transaction type |
|
Z |
Percentage of transactions of type i |
|
A |
Transaction arrival rate |
|
M i |
Mean service time for i th transaction |
|
pi |
Probability of local transaction execution |
|
t send |
Mean time to send a transaction type |
|
t return |
Mean time to return query result |
|
B |
Buffer Size (in terms of number of requests) |
|
N |
Request generating nodes |
|
M |
Number of server |
A = PAi + (n-1)(1 -pi)A ~(---7Г (1)(n - 1)
The first term p z describe a share of the incoming A transactions which can be executed locally, whereas the remaining transactions ( 1 — p. ) A are forwarded to nodes where appropriate data is available. The other ( n -1) nodes also forward ( 1 — p. ) of their A transactions, which are received by each of the remaining databases with equal probability 1 . The above formula
( n — 1)
simplifies to A = A nn
ATo = 2 Ao = 2 A(2)
=1
The mean waiting time W at a local database is found to be:
n
-
_ 2 ATo -Mi
W = ^=1 n ------- (3)
-
1 — 2 AAT0 -Mi i=1
The mean waiting time at local database site is the time that user or transaction spends in a queue waiting to be serviced. Meanwhile, the response time is the total time that a job spends in the queuing system. In other words, the response time is equal to the summation of the waiting time and the service time in the queuing system. On average, a transaction needs to wait for W seconds at a database node to receive a service of ^ seconds. Additionally, with probability (1 — pt) a transaction needs to be forwarded to a remote node that takes W seconds to wait for plus the time to be sent and returned. Thus, the response time is given by
R = W + ^i+ (1 - pYW + tiend + tieturn ) (4)
And the average response time over all transaction types results in
П
R =L ZR (5)
i = 1
-
V. RESULTS AND DISCUSSION
In this section, simulation results are presented, in terms of throughput and average delay. The simulation is performed in MATLAB.
The simulation is based on random discrete event generator, and Monte Carlo simulation is done to average out the random events. In the simulation Bernoulli traffic arrival is considered.
In the simulation, it is assumed that all the generated requests cannot be fulfilled locally. Moreover, generated requests will surely be served at the network. In the network it may be possible that more than one request can arrive at any servicing node. If that particular servicing node can store some of the requests, then they will be served on priority (FCFS: First Come first Service) basis. If number of requests crosses the storage capacity of that particular node, then rest of the requests will be dropped. Hence, it may possible that, all of the requests may not be served due to the limited storage capacity of the node. Under these assumptions the equation 4, will be simplified to
Ri = (WC + tSend + tireturn ) (6)
In the further assumption we can also assume that t s i end and t r i eturn are the propagation delays and independent of queuing delay.
R= (Wc ) (7)
In the simulation, we have assumed that the local delay is very less in comparison to the network delay. The main parameters for simulation are:
Network Throughput: It refers to the volume of data that can flow through a network, or in other words, the fraction of the generated requests which can be served.
Network Load: In networking, load refers to the amount of data (traffic) being carried by the network.
Network Delay: It is an important design and performance characteristic of a data network. The delay of a network specifies how long it takes for a request to travel across the network from one node or endpoint to another. Delay may differ slightly, depending on the location of the specific pair of communicating nodes. In the results load represents the fraction of requests generated by the node and throughput is the fraction of the generated requests which are successfully served. Average delay is the amount of average time required to serve a request which is stored in buffer of a server node.
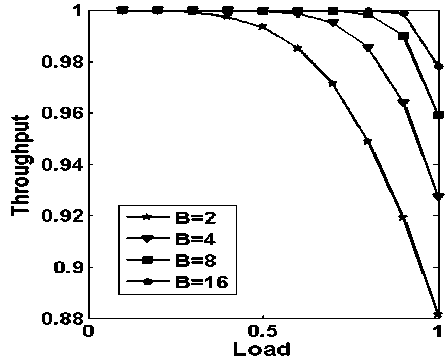
Figure. 3: throughput vs. load with varying buffering capacity, considering number of request generating nodes (N) are 4
In Fig.3, the throughput vs. average load is plotted with varying storage capacity, while considering that the request generating nodes are four and server nodes are also four. It is evident from the Fig., to get at least 90% throughput, we need buffering capacity of 4. It is also noticeable that as the storage capacity is increased, the throughput increases. It is observed from the Fig. 3 that throughput of up to 98% can be achieved, with buffering capacity of 16 requests.
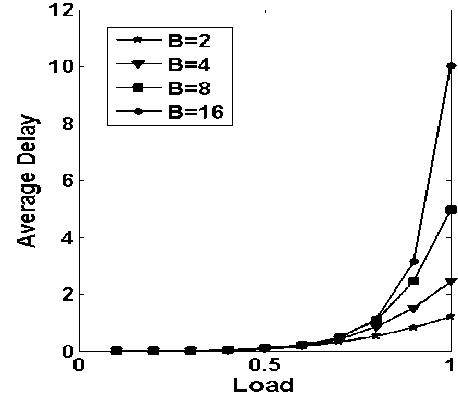
Figure.4: average delay vs. load with varying buffering capacity while considering number of request generating nodes (N) are 4
In Fig. 4, the average delay vs. average load is plotted with varying number of storage capacities. As expected as the storage capacity increases, more number of requests can be stored and thus average delay increases. In broad-sense throughput and average delay are inversely related.
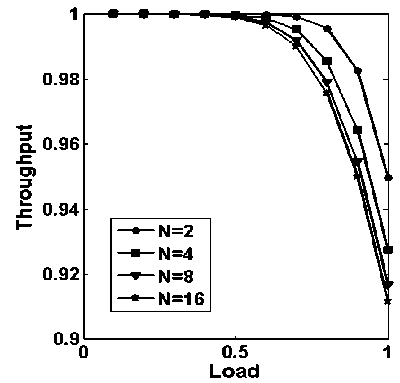
Figure.5: throughput vs. load with varying number of inputs (N, the number of request generating nodes) while considering storage capacity (B) of 16
In Fig. 5, throughput vs. load with varying number of inputs while considering storage capacity of each node i.e. B=16, is plotted. It is observed from Fig. 5, that as the numbers of generated requests are increasing, while keeping storage capacity fixed, throughput is decreasing.
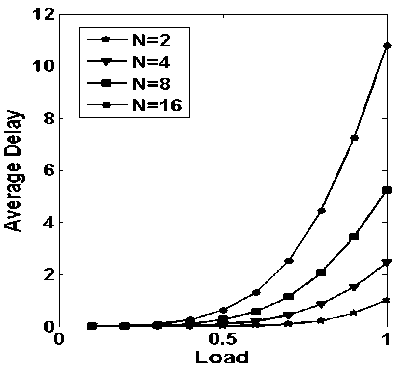
Figure.6: average delay vs. load with varying number of inputs (N, the number of request generating nodes) while considering storage capacity (B) of 16
In Fig. 6, Average delay vs. load with varying number of inputs while considering storage capacity, B=16, is plotted. It is observed from Fig. 6, that as the number of generated requests are increasing, while keeping storage capacity is fixed, the average delay is increasing.
In Fig. 7, throughput vs. load with request generating nodes 4 in number and server nodes 1 and 2 in number, while considering storage capacity (B=0) is nil, is plotted. It is observed from the Fig., that as the server nodes decrease, the throughput also decreases.
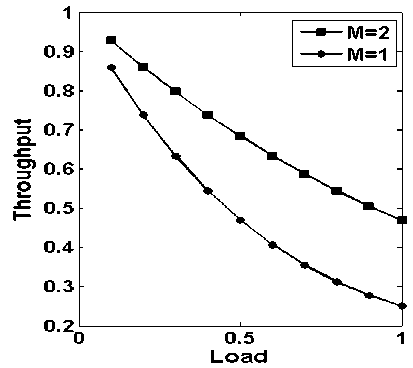
Figure.7: throughput vs. load with varying number of inputs while considering storage capacity (B) of 0
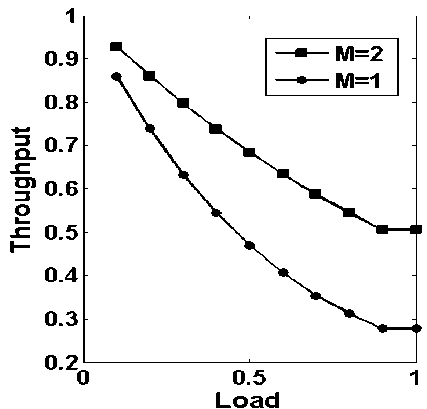
Figure.8: throughput vs. load with request generating nodes are 4 and server node are as 1 and 2 while considering storage capacity (B) of 0
Comparing this Fig. with Fig. 3, it is clearly observed that on the overall throughput, buffering has deep impact. As in Fig. 7, with buffering capacity nil and with only one server, the throughput value is below 0.3. In the above cases, there is no need to calculate average delay as buffering capacity is zero; the average delay will be zero.
In Fig. 8, throughput vs. load with request generating nodes 4 in number and server nodes as 1 and 2 in number, while considering storage capacity (B=0) is nil and 20% of the generated requests can be served locally is plotted. It is observed that, that as the server nodes decrease, the throughput also decreases. Comparing the Fig. 8 with Fig. 7, it is clearly observed that on the overall throughput, with one server does not change much, but with two servers, the throughput improves slightly.
-
VI. CONCLUSIONS
In this paper, simulation results are presented to obtain the mean waiting time and throughput for a database replication algorithm. It is found form the paper, that storage capacity has deep impact on the throughput and average delay. In the future work, the network propagation delay and local database serving delay will also be considered in the results.
References Throughput and Delay Analysis of Database Replication Algorithm
- R.Elmasri and S. B. Navathe. Fundamentals of Database Systems [B]. The Benjamin/Cummings Publishing Company, Inc., 1994.
- Fredrik Nilsson, Patrik Olsson. A survey on reliable communication and replication techniques for distributed databases [B].
- A. Dogan, A study on performance of dynamic file replication algorithms for real-time file access in data grids, [J] Future Generation Computer Systems 2009, 25 (8): 829–839.
- R. S. Chang, P. H. Chen, Complete and fragmented selection and retrieval in data grids, [J] Future Generation Computer Systems, 2007, 23 : 536–546.
- Marius Cristian MAZILU, "Database Replication", [J] Database Systems Journal 2010, 1(2), 33-38.
- I. Foster, K. Ranganathan, Design and evaluation of dynamic replication strategies a high performance Data Grid, [C] in: Proceedings of International Conference on Computing in High Energy and Nuclear Physics, China, September 2001.
- M. Tang, B.S. Lee, C.K. Yao, X.Y Tang, Dynamic replication algorithm for the multi-tier data grid, [J] Future Generation Computer Systems 2005, 21 (5) : 775–790.
- M. Shorfuzzaman, P. Graham, R. Eskicioglu, Popularity-driven dynamic replica placement in hierarchical data grids, [C] in: Proceedings of Ninth International Conference on Parallel and Distributed Computing, Applications and Technologies, 2008, 524–531.
- R.-S. Chang, H.-P. Chang, Y.-T. Wang, A dynamic weighted data replication strategy in data grids, [J] The Journal of Supercomputing , 2008, 45 (3) : 277–295.
- A.R. Abdurrab, T. Xie, FIRE: a file reunion data replication strategy for data grids, [C] in: 10th IEEE/ACM International Conference on Cluster, Cloud and Grid Computing, 2010, 215–223.
- K. Sashi, A.S. Thanamani, Dynamic replication in a data grid using a modified BHR region based algorithm, [J] Future Generation Computer Systems 2010, 27 :202–210.
- Yair Amir, Claudiu Danilov, Michal Miskin-Amir, Jonathan Stanton and Ciprian Tutu. Practical Wide-Area Database Replication [R]. Technical Report CNDS-2002-1 Johns Hopkins University, http://www.cnds.jhu.edu/publications.
- Y. Amir. Replication Using Group Communication Over a Partitioned Network. Ph.D. thesis, The Hebrew University of Jerusalem, Israel 1995. www.cs.jhu.edu/~yairamir.
- N.Saadat and A.M. Rahmani. PDDRA: A new pre-fetching based dynamic data replication algorithm in data grids. [J] Springer: Future Generation Computer Systems, 2012, 28:666-681.
- Sanjay Kumar Yadav, Gurmit Singh, Divakar Singh Yadav, "Mathematical Framework for A Novel Database Replication Algorithm",[J] International Journal of Modern Education and Computer Science (IJMECS), vol. 5, no. 9, pp. 1-10, 2013, DOI:10.5815.
