Time-Frequency Wavelet Based Coherence Analysis of EEG in EC and EO during Resting State

Author: Lal Hussain, Wajid Aziz
Journal: International Journal of Information Engineering and Electronic Business(IJIEEB) @ijieeb
Article in issue: 5 vol.7, 2015.
Free access
The electrophysiological brain activities are nonlinear in nature as measured by Electroencephalography (EEG). There are coherent activities in brain not only seen during explicit tasks but also during rest. This article aims to employ most robust nonlinear dynamics Time - Frequency representation (TFR) techniques such as wavelet phase coherence to investigate brain activity in different frequency bands at temporal and spatial scale dynamics in form of topographic maps in resting state networks. The TFR has the advantages to study the combined effect of time and frequency domains simultaneously. The wavelet coherence computed in this way exhibit high precision to detect the phase coherence in different frequency intervals to analyze highly complex non-autonomous and non-stationary EEG signals. The spatiotemporal dynamics of resting state networks are investigated by computing coherence. We have investigated the Wavelet based Phase coherence of oscillations of eye closed and eye open signals during resting states. The wavelet coherence is computed for selected 19 electrodes according to 10-20 system from 129 channel EEG signals. The significance was obtained using Wilcoxon Signed Rank test and pairwise wavelet coherence was computed for each possible combination. The Wavelet Phase Coherence using Wavelet Transform gives significantly high results (P<0.05) in EC and EO signals during resting states in frequency interval 0.5-50 Hz overall as well as in the band intervals such as delta (05-4 Hz), theta (4-7 Hz), alpha (7-13 Hz), beta (13-22 Hz) and gamma (22-50 Hz). By computing the spatial wavelet phase coherence, we observed significant pathways including sagittal factor (anterior-posterior interhemispheric) and lateral factor (perpendicular to anterior-posterior axis). The lateral factor differences have less affect than the sagittal factor. Each band was involved in different activities in some way, however alpha band showed distinct anterior-posterior activity when the eye-closed coherence was higher than the eye open coherence.
Wavelet Phase Coherence, Resting State, Electroencephalography (EEG)
Short address: https://sciup.org/15013370
IDR: 15013370
Text of the scientific article Time-Frequency Wavelet Based Coherence Analysis of EEG in EC and EO during Resting State
Published Online September 2015 in MECS DOI: 10.5815/ijieeb.2015.05.08
-
I. Introduction
The nonlinear dynamics in normal resting state EEG are primarily concerned to study the dynamics in normal EEG particularly in alpha rhythm. The previous studies [1] reveal that normal EEG are reflecting weak but significantly nonlinear structure (Gautama et al., 2003; Gebber et al., 1999; Maurice et al.,2002; Meyer-Lindenberg, 1996; Palus, 1996c; Pritchardet al., 1995a; Rombouts et al., 1995; Stam et al., 1999; Stepien, 2002). Previous studies also reveal that alpha activity in EEG is dominant in normal individuals during eye-closed resting condition and suppresses as visual stimulation. Alpha activity decreased during occipital regions (Berger, 1933; Adrian and Matthews, 1934; Jasper, 1936; Smith, 1938) and also in posterior regions when the individuals open their eyes (Chapman et al., 1962; Volavka et al., 1967; Legewie et al., 1969; Glass and Kwiatkowski, 1970; Gale et al., 1971). These studies suggest that alpha desynchronization reflects the increased visual system functioning due to visual stimulation being mediated by the Reticular Activating System (Volavka et al., 1967; Gale et al., 1971; Hardle et al., 1984). (Deco et al., 2008, 2009; Ghosh et al., 2008 also found a surprising degree of complexity and coherent activities in human brain during resting states EEG.
The brain dynamics systems recently studied using millisecond temporal resolution of EEG and MEG (Elbert et al., 1994; Birbaumer et al., 1995; Müller et al., 2003a; Allefeld et al., 2009 and Jirsa et al., 2013) characterized as bifurcations, multistability, multiscale behaviors and deterministic chaos. During the pathological and physiological brain states, the brain oscillatory activities are considered to get synchronized by executing certain tasks (e.g. sleep-wake states, increased attention tasks, epileptic seizures and optical stimulation etc.) and diverse pathologies during resting states. Recently, there is a great interest in neurophysiological research to study the functional connectivity between different brain regions during resting state. A surprising degree of complexity and coherent activities were seen in human brain during resting states [10,11]. We have investigated the nonlinear dynamics using Wavelet Phase in healthy EEG signals with eye open and eye-closed during resting state to investigate the different coherent activities in brain. The several recent studies reveals that applications of restingstate EEG for investigation and analysis at earlier stages equally important for neurologists, clinicians and physicians. (Scott et al., 2000) examine the biological and clinical concomitants in resting state EEG power abnormalities, ventricle enlargement and frontal lobe resting EEG abnormalities in Schizophrenia. Resting state EEG studies are also important at early stage analysis of Autism Spectrum Disorder (ASD) and attention-deficit/hyperactivity disorder (ADHD).
These interactions can be measured using the novel time-frequency methods such as “wavelet coherence” most widely used technique to study the EEG/MEG relations and brain dynamics. Single generator activity within brain can be seen in many channels outside the head thoroughly using mapping and topographic maps depending upon volume conduction (Nolte et al ., 2004). It is very crucial to analyze and understand the functionality of complex systems because their dynamics consists of several complex processes. To analyze the interrelationships between the times series, we require an appropriate method of time series analysis. In the last decades, a multivariate nature of data has paid much attention including applications such as synchronization analysis [12], wavelet-base time frequency coherence to study the neuronal oscillatory pattern (Rodrigo et al., 2008), interhemispheric, intrahemispheric and distal EEG coherence in Alzheimer’s disease (AD) [13], waveletbase phase coherence to investigate the relationship between temperature, blood flow, instantaneous heart rate , harmonic detection in nonsinusodial oscillations and time-localized coherence [14,15], Cardiorespiratory interaction with aging [16], fault diagnosis of rotary machines using wavelet (Yan et al., 2014) and Wavelet Phase coherence analysis of arterial blood pressure and cerebral tissue oxyhemoglobin concentrations signals to assess the dynamic cerebral autoregulation (dCA) in response to posture change (Gao et al ., 2015).
In this paper we aimed to investigate the nonlinear dynamics in EEG signals in healthy subjects with eye open and close using Wavelet Phase coherence during resting state. Coherence measure is the phase difference between two signals weighted by amplitude and measured over time in particular frequency. The values of coherence range from 0 to 1, if the value of coherence is 1, it shows the complete agreement in phase difference, and 0 shows the completely random phase difference. This study is aimed to study the EEG coherence by computing topographic and frequency structure. For topographic information, the coherence will be computed over different location such as inter-hemispheric and intra-hemispheric locations, local and global, sagittal and literal etc. in different frequency ranges and relationships in different coherence pairs.
-
II. Material and Methods
-
A. Data sets
EEG data with eye–closed (EC) and eye open (EO) during resting states comprising of 129 channels was taken from Neurophysiological Biomarker Toolbox accessible from URL:
XEKkaLXEs) as used and discussed in [2]. The Data contains 16 healthy volunteers (ten females, median age: 27 years, range 21–48) with no history of neurological or psychiatric illness, illegal substance abuse or use of psychotropic medication”.
-
B. Methods
Wavelet is a different form of decomposition to EMD using windowing functions. The major advantages of using wavelet is that it gives optimal time-frequency localization by identifying the frequency of a component at any given time with high accuracy using window function known as mother wavelet [18]. The frequency response is acquired in the desired frequency ranges by stretching of compressing of wavelet function.
A Morlet mother wavelet transform (Goupillaud et al., 1984) is applied. It is a complex plan wave obtained by multiplying a Gaussian envelop function л —l2Ktoot f2
Ψ(s, t) = ^/- e s e 2s2 (1)
The wavelet characteristics frequency is for
where e 2s2 part specifies the windows’ Gaussian shape
-I 2Utoot and stretches the wavelet w.r.t. scale s and e s is the basis of Fourier Transform. Here, too is known as the central frequency parameter which gives the timefrequency resolution of wavelet; low value of too gives good time resolution but bad frequency resolution and high value gives good frequency but bad time resolution. The wavelet transform may encounter same problems of high harmonics as by Fourier transform, however due to its ability to obtain time dependent phase information it can detect the relation between two oscillations and can identify the harmonics caused by nonlinearity. Morlet wavelet is different than Fourier transform in such a way that Morlet is continuous though having same amplitude analogous to Fourier but power spectrum is much different can be computed as:
Pw ( to , t )=∫ | WT ( , t )| 2dto (2)
The significant improvement made by WT over STFT can be seen on frequency scale as the scale of wavelet transform is logarithmic whereas of STFT has linear scale. We can divide the low frequency energy into many more coefficients, thereby distinguishing the many low frequency nonstationary components; these components may be merged in same frequency interval using STFT.
In time-frequency plane [17], we can know the frequency of an oscillation at every point in time that is influenced by time dependent component. Thus in phase space, the complexity and frequency domain may fail to interpret the useful information of non-autonomous system [3]. The wavelet transform is of time series is then obtained by convolving the complex wavelet of equation 1) with the time series at each scale s. i.e.
w ( s , t )=∫ Ψ (s,(t, τ)) f (T) de (3)
The Morlet wavelet transform as defined in 1) was applied to EC and EO in resting states for 19 electrodes according to 10-20 international system. We have used the central frequency of (Oo =2 and rescaling in increments of 5 % between s=0.5 and 80 Hz.
When there are two noisy signals interacting to each other with different spectra in power at same frequency, their oscillation whether related or unrelated can be detected significantly over time using the phase coherence. The phases and their differences between two signal are computed for any given frequency component. Suppose the phase difference is the unit phasor, the phase coherence is the amplitude of the mean phasor. We obtained complex wavelet coefficient numbers with complex wavelet denoting the instantaneous relative phase and absolute amplitude for each time and frequency. The relationship between oscillations of different time series can be investigated using the phase information. Thus phase coherence is defined as the relationship between two oscillatory processes at specific frequency. The high phase coherence between two time series is maintained if the characteristic phase difference is maintained between them. Finally, Wavelet Phase coherence determines the possible relationship by estimating the match between the instantaneous phases of two time series.
Consider a complex spectral function with frequency tok and time t n i.e. X(tn)=p( )+iq( ) representing the spectral property of signal x(t) in the time-frequency domain.
The
amplitude
|
X( to к,tn) |=√р2( )+q2( ) and phase φ( )= arctan. ( )/ are computed for each signal tn and frequency 03 k . Similarly, we can compute the phases for two signals as φ 1 ( ) =arctan. ( )/ and φ2()=
Vqi( tn )
arctan. ( )/ and their phase difference as ф()=
φ1( )-φ2( ) [4], then.
cos ф()
p1( ) p2( )+q1 ( )q2()
( pI2( )+qI2 ( ))1/2( p2 2( )+q2 2 ( ))1/2()
p1( ) p2( )-ԛ1( )q2()
( pI2( )+qI2 ( )) 2( p2 2( )+q2 2 ())
averaging the coefficients COSΔ , and sinΔ , in time for whole length of time series we can define:
Thus time-averaged wavelet phase coherence as defined by [4].
Пр = √({∑ n=l sin[ Ф ( )]} 2 +{∑ n=l cos[ Ф ( )]} 2 ) (5)
The wavelet values of equations (4) can be replaced with a normalized phasor as defined by (Sheppard et al., 2011):
The averaged phase coherence is defined as:
=
0.A∑n=l ® Ф1 ( tn ) е-1ф2 ( tn ) /×
. J_ ∑
p=Ye-i'
\Lkn /J
We can find E ( Hp ) to calculate autocorrelation and Gk statistics using wk ( ) of the unit phasor for the new time series. The phase coherence between two signals is expressed in form of correlation between their components characterize by their amplitude and phase. The coherence increases when the correlation between the envelops also increases and phase difference has small variations in time. There are some experiments such as heartbeat or respiration may produce amplitude modulation, thus one may exclude such sources of coherence and focus on phase only [19]. The tendency of phase difference is thus measured from the magnitude of phase coherence between two signals either zero or fixed phase delay over fixed time. Thus greater the total (mean) phasor shows that there are more similar phase difference values are found between the singles under investigation. Whereas, the small values of phase difference merely shows the random walk in complex plane. The unrelated signals may even exhibits finite phase coherence [14] over finite period of time, and estimated that wavelet phase monotonically increased and grows at rate of instantaneously frequency of component. Thus phase coherence distribution for unrelated signals may gauge significance at each frequency and require to be tested for significance using surrogates with mean, plus one and two standard deviation of surrogate distribution.
Using the Morlet mother wavelet with f 0 =2, lowest frequency wavelet of 0.5 Hz and highest frequency of wavelet of 80 Hz are used to include the all the delta, theta, alpha, beta and gamma oscillations. The wavelet phase coherence was computed from the phases of Eye closed and Eye open during resting states for each 19 electrodes such as C3, C4, Cz, F3, F4, F7, F8, Fp1, Fp2, Fz, O1, O2, P3, P4, Pz, T7, T8, P7 and P8 according to 10-20 system among all possible pairs, where the phase in each case was computed using the wavelet transform.
The electrophysiological brain activities are nonlinear in nature as measured by Electroencephalography (EEG). There are coherent activities in brain not only seen during explicit tasks but also during rest.
-
III. Discussions
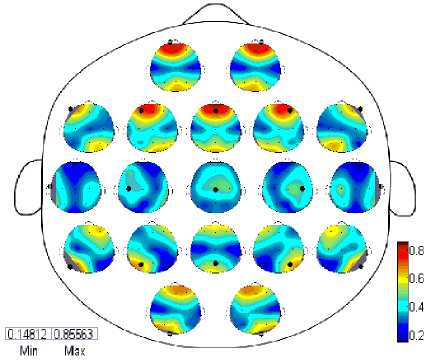
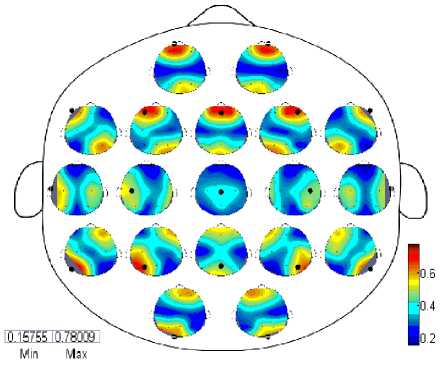
The coherence was computed for 19 electrodes as mentioned above for all possible combinations and resultant matrices contains enormous information which required to be shown in form of topographic maps in one plot. We have computed coherence for each frequency band such as delta, theta, alpha, beta and gamma for both eye-closed and open during resting states. Each large circle in these figures shows the whole scalp where a small topographic map is placed at each electrode position also repressing a scalp and contains the coherence with all possible combination of electrodes.
Мак
(EC)
Fig. 1. Spatial Wavelet Phase Coherence (WPC) during EC in resting state
Min Мак
(EO)
Fig. 2. Spatial Wavelet Phase Coherence (WPC) during EO in resting state
The Figures 1,2 and 3 contain 19 small topographic maps according to 10/20 international system inside a single head display. The map provide full picture of 129 electrodes of EC subject during resting state in delta frequency band (red: EC>EO; blue: EC (Significance) Fig. 3. Spatial Wavelet Phase Coherence (WPC) Significance differences between EC and EO state using paired test for each 19 electrodes in topographic maps IV. Discussions And Conclusion The aim of present study is to investigate the temporal dynamics of resting state EEG using coherence and topographic maps. We have computed wavelet coherence and examined in detail the topography and frequency structure of EEG coherence during resting state in EC and EO subjects. The topographic changes have been observed in delta, theta, alpha, beta and gamma bands however most significant differences were seen in alpha band as reflected in Figure 1 and detailed results for other bands are shown in Table 1. Generally, coherence in EC subjects increases in some bands and decreases in other. Pairwise coherence was computed excluding self-coherence in the form of topographic maps. The highest coherence was observed in EC in frontal regions in alpha band. Whereas other bands such as delta, theta, beta also exhibit high coherence in frontal regions in both EC and EO subjects and gamma shows high coherence in EC in Fz and Fp2 only. The parietal regions also shows high coherence in Alpha and Beta bands for both EC and EO and few parietal regions also shows coherent activity in delta and gamma bands. Most of the immediate adjacent electrodes show the higher coherence at all frequency bands [5]. It was also observed overall that when the spatial distance between the electrodes increases the coherence also decreases for both EC and EO at all frequency bands (In Table 1, the * denote that where coherence of EC was higher than EO). During EC, the highest pairwise coherence in alpha band was observed in frontal regions (F3-Fp1, F4-Fz, Fp1-Fz, Fp2-Fz, Fz-Fp2), the other bands also shows high coherent activities in frontal (F3-fp1, F4-Fz,Fp1-F3, Fp2-F4), occipital-parietal (O2-P8), parietal (P3-P7, P4- P8, P7-P3, P8-P4) and parieto-occipital (P7-O1) regions. A high posterior (P3-P7, P7-P3) coherence is also shown in alpha band with EO. In human, the oscillations with electric potential 8-12 Hz range with greater amplitude in posterior regions usually recorded as sinusoidal waves and present 95% in healthy adults usually during eye-closed resting state [6]. In the neocortex this potential is believed to arise from the oscillation of postsynaptic potentials (Berger, 1929; Cooper et al., 1965; Nunez et al., 2001). The alpha rhythm is considered as idle and diminish when the eyes are open or during mental activity. In alpha band, there is an apparent reduction in activity from eye closed to eye open condition with no topographic change. The global alpha reduction activity is consistent with the previous EEG studies reporting that across the scalp alpha desynchronization take place due to onset of visual stimulation Adrian and Matthews, 1934; Jasper,1936; Smith, 1938; Chapman et al., 1962; Volavka et al.,1967; Legewie et al., 1969; Glass and Kwiatkowski, 1970;Gale et al., 1971). Previous studies only revealed that entire cortex is activated in response to visual stimulation due to desynchronization in alpha activities (Basar and Schurmannn, 1999) and have not distinguished the arousal and activation activities in this way. Delta activity [7] during early development dominates the human EEG and decreases during normal development (John et al., 1980; Gasser et al., 1988; Harmony et al., 1990). Slow wave delta activity in development is deemed important to support brain maturation and prune redundant cortical connections to exhibit positive association between gray matter volume and delta activity (Whitford et al., 2007). Whereas the high wave delta activity recorded during reading tasks is observed in dyslexic school age children (Spironelli et al., 2006; Penolazzi et al., 2008; Spironelli and Angrilli, 2010) and dyslexic young adults (Rippon, 2000). However, increased delta and theta activity is reported in children with reading and writing disabilities and in dyslexics in resting state EEG at the age 9-18 years (Sklar et al., 1972; Colon et al., 1979; Pinkerton et al., 1989; Harmony et al., 1995). The pathological and ordinary human brain functions investigated by [8] measuring the corticocortical connectivity. (Thatcher et al., 1986; Tucker et al., 1986) estimated the coherence in frequency spectrum of EEG studies in resting state subjects and measured the coupling functions across distinct brain regions of human brain. (Scher et al., 1994) studied the coherence of various intrahemispheric and interhemispheric regions and found greater EEG spectra patterns in preterm infants than in full-term infants which indicate the increased neuronal connectivity due to extrauterine experience. (Lowe et al., 1998) investigated the coherence in left and right hemisphere in resting states single and multi-slice echoplanner data in right and left hemisphere, precentral gyri (motor cortex), calcarine fissures (visual cortex), and right and left hemisphere amygdalae. They observed low frequency correlations in resting state data found in left/right symmetric functional cortices and assessed for whole brain functional connectivity as well. Several recent studies (Von 1999; Cisek and Turgeon 1999; Varela et al. 2001; Singer 1993; Womelsdorf and Fries 2007) show that brain contains disparate and multiple neural activities in underlying cognition such distributed information requires a mechanism of multiregional function interaction. (Besthorn et al. ,1994; Locatelli et al., 1998; Babiloni et al. ,2004; Jelles et al.,2008; Sankari and Adeli 2011) investigated EEG coherence in 16, 17 and 19 electrodes according to 10-20 international system. They estimated coherence for individual electrode and all neighboring pair electrodes, fronto-parietal, interhemispheric and intrahemispheric networks, distal and anterior-posterior regions. A decrease in average coherence was seen in frontal and central regions of theta, alpha and beta bands in AD patients. Moreover, particular coherence was identified in AD patients with controls. [5] evaluated the functionality of cortical connectivity and synchronization of regional cortical connectivity in AD patients using EEG coherence measure. The cortical connectivity in AD declined due to decrease in coherence and have potential to distinguish the AD and control subjects. Relative power and coherence used by [9] to analyze the amnestic mild cognitive impairment in diabetes. They investigated alpha coherence and correlations in intra region (parietal) and inter region (right temporo-posterior, fronto-posterior), interhemispheric (LH, RH), Left posterior (LP)-right posterior (RP) regions in aMIC and control groups and found significant results in alpha frequency band while other bands exhibits no significant differences. From the results, it is evident that topographic maps show differences in arousal and activation during EC and EO. Thus these are not considered as baseline conditions. Moreover, topographic maps using wavelet coherent methods high distinguish the conditions using phase synchronization properties computed from wavelet transform. Thus wavelet coherence methods are more robust to analyze the nonlinear dynamical problems. Thus pairwise Wavelet Coherence in all frequency bands was computed and summarized to see the overall affect EEG in EC and EO during resting state. The table and topographic maps also depicts the increase and decrease of coherence in interhemispheric and intera-hemispheric regions. Thus the current researches will insight the future researches as a biomarker for complex and nonlinear physiological markers in EEG with different pathologies. Table 1. Pairwise Wavelet Coherence with statistical significance (p<0.05) using Paired test Electrode Delta Theta Alpha Beta Gamma C3 None O1 F8,Fp1*,P3,T7,P7 None O1 C4 None Cz* Cz*,F7,P4, T7 None None Cz F7 C4*,F4* C4*,F3*,F4*,Fp1*,Fp2*,Fz*,O1* F4* T7,T8,P8 F3 T8* None Cz*,F4*,F8*,Fp2*,Fz*,O1*,P7* None None F4 None Cz* Cz*,F3*,F7*,Fp1*,O2*,P4*,P8* Cz* None F7 Cz None C4,F4*,F8*,Fp1*,Fp2*,Fz*,O1*,P3* None None F8 None None C3,F3*,F7*,Fp1*,P4*,Pz*,P8* None None Fp1 Fp2*,T8* Fp2*,T8* C3*,Cz*,F4*,F7*,F8*,Fp2*,T8*,P7* Fp2* Fp2* Fp2 Fp1*,Fz*,P3*,T7*,P7* Fp1* Cz*, F3*,F7*,Fp1*,Fz*,O2*,P7*,P8* Fp1*,Fz* Fp1*,Fz*,O1* Fz Fp2* None Cz*,F7*,Fp1*,Fp2*,O1*,O2* Fp2* Fp2* O1 None C3 Cz*,F3*,F7*,Fp1*,Fz* None C3,Fp2* O2 None None F4*,F7*,F8*,Fp2*,Fz* None T8 P3 Fp2* None C3,F7* None None P4 None None C4,F4*,F8* None None Pz T8 None F8* None None T7 Fp2*,P8 None C3,C4,P7 None Cz,P8 T8 F3*,Fp1*,Pz Fp1* Fp1* Fp2 Cz,O2 P7 Fp2* None C3,F3*,Fp1*,Fp2*,T7 None None P8 None None F4*,F8*,Fp2* None Cz, T7 In alpha band a very decrease in coherence in EO pairs was observed than in EC pairs. During EC alpha coherence pair was increased in sagittal direction (i.e. from anterior-posterior regions) and prescribing relational characteristics such as anterior, posterior, left, right and central. Specifically, these pairs include frontal, fronto-central, fronto-occipital, fronto-parietal, parieto-occipital. During EO alpha coherence pairs was increased in lateral regions (i.e. perpendicular to anterior-posterior regions) prescribing relational characteristics such as interhemispheric, intrahemispheric and left to right or right to left brain regions. During EO these regions includes fronto-temporal, fronto-central, temporo-frontal, temporo-central, centro-temporal, parieto-central and parieto-temporal. An increase in beta band coherence was found statistically significant during EC only in few pairs such as frontal, central and fronto-temporal while EO showed the increase in coherence in central, centrotemporal, centro-parietal, fronto-temporal, parietotemporal and parieto-central. Gamma band showed an increase in EC coherence in few frontal, fronto-central and fronto-occipital regions while EO in centro-occipital, central, fronto-temporal, occipito-parietal, parietal and parieto-temporal. From the spatial coherence in Alpha frequency band, the large number of electrode pairs shows the statistically significance coherence pairs (more pairs are found using EC>EO). It was most generally observed that in alpha band EC>EO coherence was found in anterior-posterior regions i.e. sagittal factor (Frontal to Parietal and Central regions) and EO>EC, these coherence pairs are found statistically significant in lateral factor i.e. from left hemisphere to right hemisphere and vice versa.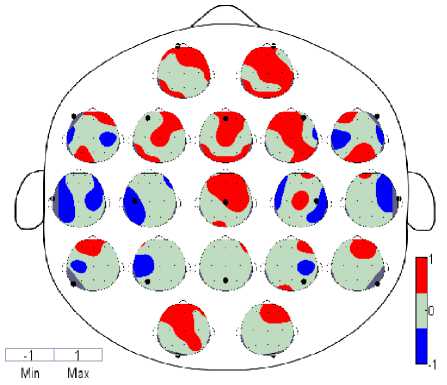
References Time-Frequency Wavelet Based Coherence Analysis of EEG in EC and EO during Resting State
- Barry, R. J., Clarke, A. R., Johnstone, S. J., Magee, C. A., & Rushby, J. A. (2007). EEG differences between eyes-closed and eyes-open resting conditions. Clinical Neurophysiology, 118(12), 2765-2773.
- O'gorman, R. L., Poil, S. S., Brandeis, D., Klaver, P., Bollmann, S., Ghisleni, C., ... & Michels, L. (2013). Coupling between resting cerebral perfusion and EEG. Brain topography, 26(3), 442-457.
- Clemson, P. T., Suprunenko, Y. F., Stankovski, T., & Stefanovska, A. (2014). Inverse approach to chronotaxic systems for single-variable time series. Physical Review E, 89(3), 032904.
- Sheppard, L. W., Stefanovska, A., & McClintock, P. V. E. (2012). Testing for time-localized coherence in bivariate data. Physical Review E, 85(4), 046205.
- Sankari, Z., Adeli, H., & Adeli, A. (2011). Intrahemispheric, interhemispheric, and distal EEG coherence in Alzheimer's disease. Clinical Neurophysiology, 122(5), 897-906.
- Laufs, H., Kleinschmidt, A., Beyerle, A., Eger, E., Salek-Haddadi, A., Preibisch, C., & Krakow, K. (2003). EEG-correlated fMRI of human alpha activity. Neuroimage, 19(4), 1463-1476.
- Schiavone, G., Linkenkaer-Hansen, K., Maurits, N. M., Plakas, A., Maassen, B. A., Mansvelder, H. D., ... & van Zuijen, T. L. (2014). Preliteracy signatures of poor-reading abilities in resting-state EEG. Frontiers in human neuroscience, 8.
- Murias, M., Swanson, J. M., & Srinivasan, R. (2007). Functional connectivity of frontal cortex in healthy and ADHD children reflected in EEG coherence. Cerebral Cortex, 17(8), 1788-1799.
- Bian, Z., Li, Q., Wang, L., Lu, C., Yin, S., & Li, X. (2014). Relative power and coherence of EEG series are related to amnestic mild cognitive impairment in diabetes. Frontiers in aging neuroscience, 6.
- Deco, G., Jirsa, V. K., Robinson, P. A., Breakspear, M., & Friston, K. (2008). The dynamic brain: from spiking neurons to neural masses and cortical fields. PLoS computational biology, 4(8), e1000092.
- Deco, G., Jirsa, V., McIntosh, A. R., Sporns, O., & Kötter, R. (2009).Key role of coupling, delay, and noise in resting brain fluctuations. Proceedings of the National Academy of Sciences, 106(25), 10302-10307.
- Rosenblum, M. G., & Pikovsky, A. S. (2001). Detecting direction of coupling in interacting oscillators. Physical Review E, 64(4), 045202.
- Sankari, Z., & Adeli, H. (2011). Probabilistic neural networks for diagnosis of Alzheimer's disease using conventional and wavelet coherence. Journal of neuroscience methods, 197(1), 165-170.
- Sheppard, L. W., Vuksanović, V., McClintock, P. V. E., & Stefanovska, A. (2011a). Oscillatory dynamics of vasoconstriction and vasodilation identified by time-localized phase coherence. Physics in medicine and biology, 56(12), 3583.
- Sheppard, L., Stefanovska, A., & McClintock, P. V. E. (2011b). Detecting the harmonics of oscillations with time-variable frequencies. Physical Review E, 83(1). 016206.
- Iatsenko, D., Bernjak, A., Stankovski, T., Shiogai, Y., Owen-Lynch, P. J., Clarkson, P. B. M., & Stefanovska, A. (2013). Evolution of cardiorespiratory interactions with age. Philosophical Transactions of the Royal Society A: Mathematical, Physical and Engineering Sciences, 371(1997), 20110622.
- Iatsenko, D., McClintock, P. V., & Stefanovska, A. (2015). Linear and synchrosqueezed time–frequency representations revisited: Overview, standards of use, resolution, reconstruction, concentration, and algorithms. Digital Signal Processing, 42, 1-26.
- Kaiser, G. A friendly guide to wavelets. pp. 60-77, 1994
- Lachaux, J. P., Lutz, A., Rudrauf, D., Cosmelli, D., Le Van Quyen, M., Martinerie, J., & Varela, F. (2002).Estimating the time-course of coherence between single-trial brain signals: an introduction to wavelet coherence. Neurophysiologie Clinique/Clinical Neurophysiology, 32(3), 157-174.
