Time Series Forecasting Enhanced by Integrating GRU and N-BEATS

Author: Milind Kolambe, Sandhya Arora
Journal: International Journal of Information Engineering and Electronic Business @ijieeb
Article in issue: 1 vol.17, 2025.
Free access
Accurate stock price prediction is crucial for financial markets, where investors and analysts forecast future prices to support informed decision-making. In this study, various methods for integrating two advanced time series prediction models, Gated Recurrent Unit (GRU) and Neural Basis Expansion Analysis Time Series Forecasting (N-BEATS), are explored to enhance stock price prediction accuracy. GRU is recognized for its ability to capture temporal dependencies in sequential data, while N-BEATS is known for handling complex trends and seasonality components. Several integration techniques, including feature fusion, residual learning, Ensemble learning and hybrid modeling, are proposed to leverage the strengths of both models and improve forecasting performance. These methods are evaluated on datasets of ten stocks from the S&P 500, with some exhibiting strong seasonal or cyclic patterns and others lacking such characteristics. Results demonstrate that the integrated models consistently outperform individual models. Feature selection, including the integration of technical indicators, is employed during data processing to further improve prediction accuracy.
Time Series, Stock Price Prediction, N-BEATS Model, GRU Model, Financial Indicators, Information Engineering
Short address: https://sciup.org/15019663
IDR: 15019663 | DOI: 10.5815/ijieeb.2025.01.07
Text of the scientific article Time Series Forecasting Enhanced by Integrating GRU and N-BEATS
Published Online on February 8, 2025 by MECS Press
Stock price prediction is regarded as a challenging task [1-2] in financial markets, where significant financial gains can be achieved by accurately forecasting future prices. Traditional approaches to stock price prediction have often struggled with capturing the complex patterns [3-4] present in financial time series data, such as trends, seasonality, and abrupt changes. To address these challenges, various machine learning models have been proposed by researchers, including ARIMA, Support Vector Regression (SVR), Random Forest Regressor, XGBoost, Temporal Convolutional Networks (TCN), K-Nearest Neighbors (KNN) for regression, and Long Short-Term Memory (LSTM), among others. It has been observed that LSTM consistently outperforms other models in most experiments [5-9], particularly when applied to financial datasets. Based on this observation, we focused on LSTM and explored several of its advanced variants. Among these, the Gated Recurrent Unit (GRU) proved to be more effective than the others we tested also confirmed by literature survey [10-14]. Additionally, the Neural Basis Expansion Analysis Time Series Forecasting (N-BEATS) model, a relatively new algorithm, is gaining popularity due to its strong performance. Both GRU and N-BEATS have unique strengths in time series forecasting. GRU, a variant of the Recurrent Neural Network (RNN), is known for being particularly adept at learning from sequential data [15-17], making it suitable for modeling the temporal dependencies [18-19] inherent in stock prices. The gated structure of GRU mitigates the vanishing gradient problem [20], enabling the capture of long-term dependencies, which are essential in predicting stock prices based on historical data.
N-BEATS [21], on the other hand, have been designed as a deep learning model explicitly for univariate time series forecasting [22]. Unlike traditional RNNs, sequential processing is not relied upon in N-BEATS, as a fully connected architecture is used instead to predict future values.
N-BEATS is known for being particularly powerful in handling trend and seasonality components [23], common in financial data. Its interpretable nature allows for a clearer understanding of underlying data patterns, making it a valuable tool in financial forecasting.
However, while the GRU model is excellent at capturing temporal dependencies, and N-BEATS excels in modeling trends and seasonality, limitations are present in each. GRU may struggle with non-linear patterns [24] that do not solely depend on previous time steps, whereas N-BEATS may not fully capture the intricate dependencies between consecutive data points. Therefore, it is suggested that the combination of these two models can potentially harness their strengths and mitigate their weaknesses, leading to more accurate and robust predictions. Existing methods for stock price prediction often rely on standalone models or basic ensemble approaches that fail to capture the complexities of diverse time series patterns, such as trends, seasonality, or irregular fluctuations.
Several hybrid techniques to combine the GRU and N-BEATS models for stock price prediction are proposed in this study. It is hypothesized that by integrating the predictions from these two models, a more accurate forecast can be achieved than when either model is used individually. The hybrid approaches are tested on datasets from ten companies, chosen to represent a diverse set of time series characteristics. These companies are categorized into two groups: five with strong seasonal, cyclic, or trend patterns, and five without these patterns. This categorization allows the effectiveness of the hybrid approaches across different types of financial data to be evaluated.
The research question is whether popular prediction models used separately or in combination, produce varying results depending on whether the time series data has patterns like trends and seasonality or lacks such patterns. Additionally, it explores whether combining these popular models improves prediction accuracy, and if so, which combination is the most effective. We also aim to determine which feature selection method is superior among the ones we have employed. The research identifies a gap in leveraging the combined strengths of GRU and N-BEATS in time series forecasting due to inadequate integration strategies and limited exploration of feature selection's impact. This study addresses the gap with innovative methods like feature fusion, residual learning, and ensemble stacking to maximize both models' potential. The integration methods—feature fusion, residual learning, and ensemble stacking— were selected for their ability to address key challenges in time series forecasting. Feature fusion enhances GRU's performance on complex temporal patterns by combining N-BEATS outputs with raw inputs. Residual learning refines predictions by training GRU on N-BEATS residuals, improving accuracy for datasets with trends or seasonality. Simple stacking provides a straightforward ensemble strategy, aggregating predictions from both models to ensure robust forecasting for datasets lacking clear patterns. Our ultimate objective of this study is to develop and evaluate hybrid techniques combining GRU and N-BEATS models to improve stock price prediction accuracy in stock market with varying time series patterns.
2. Related Works
Financial markets, renowned for their intricate dynamics and continual fluctuations, necessitate robust forecasting methodologies to facilitate informed decision-making. Recent advancements in time series prediction are explored in this review, with an emphasis placed on recent models and their enhancements aimed at unraveling the complexities inherent in stock market data.
N-BEATS, a recent advancement in deep learning within this field, represents a deep structure comprising fully connected layers with forward and backward residual links. N-BEATS has been shown to perform exceptionally well on various large-scale datasets. The N-BEATS architecture was applied by Boris N. Oreshkin, Grzegorz Dudek, and Paweł Pełka [40] for mid-term electricity load forecasting. N-BEATS-RNN, an extended ensemble of deep learning networks for time series forecasting, was utilized by Sbrana, ALD Rossi, and MC Naldi [41]. N-BEATS was employed by Bartosz Puszkarski, Krzysztof Hryniów, and Grzegorz Sarwas [42] for heart dysfunction classification. An interpretable data-driven approach using the N-BEATS neural network for short-term macroeconomic forecasting was proposed by Xuanzheng Wang, Changwang Li, Chengqi Yi, Xinan Xu, Jiandong Wang, and Youhui Zhang [43].
3. Modeling Approach
In this research paper, a comprehensive modeling approach to stock price prediction is explored by utilizing the strengths of both GRU (Gated Recurrent Units) and N-BEATS (Neural Basis Expansion Analysis for Time Series) architectures. The research methodology is designed to integrate these two powerful neural network models to enhance stock price prediction accuracy. GRU, as a type of recurrent neural network, is employed to capture temporal dependencies and learn long-term patterns in sequential data, making it suitable for time series forecasting. Similarly, N-BEATS is used as a deep learning model to forecast complex temporal patterns and handle trend and seasonality [4447] components. Technical indicators are integrated to capture market trends [48-50], momentum [51-53], and volatility [54-55], while feature selection techniques [56] are applied to identify the most significant predictors for model training. Various methods are employed to combine the predictions of GRU and N-BEATS models. These include the Hybrid Feature Generator, Feature Fusion [57-58], Residual Learning [59-60] and Simple Stacking (Ensemble technique) [6164]. The effectiveness of each method is evaluated by comparing the prediction accuracy across multiple stocks with varying market behaviors. This analysis allows for the identification of the best-performing approach to stock price forecasting. A detailed discussion is provided on the individual models and their combination strategies, illustrating how these methods enhance prediction accuracy and robustness in financial time series analysis.
-
3.1 GRU (Gated Recurrent Unit)
The architecture of the GRU [65] is comprised of a network of recurring units, each designed to maintain and update a hidden state as sequential input data is processed. The basic structure of a GRU unit involves the following components. The hidden state, at every time step, is reflected as the network’s memory. It serves as a memory cell, capturing relevant information from previous inputs. The input gate is used to determine which parts of the input data should be saved in the hidden state, considering both the current data and the last hidden state. The update gate determines the amount of the prior hidden state that should be retained for the current time step, controlling the data flow from the earlier hidden state to the active hidden state. The equations for the GRU are as follows:
Zt = aWx + Uzht-1 + bz),(1)
rt= a (WrXt + Urht-1 + br),(2)
y, = tanh(WhXt + Uh(ht-1 e r) + bh,(3)
ht = zt e ht-1 + (1 - zt) e у, ,
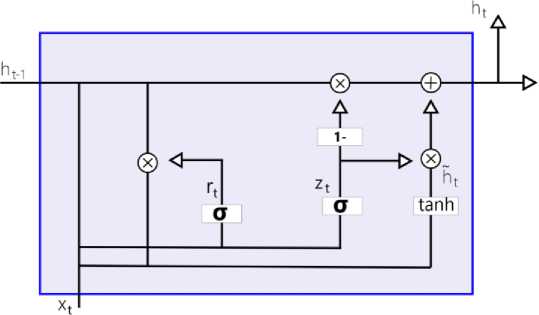
Fig. 1. GRU Architecture
A notable feature of GRU is its simplified structure compared to LSTM [66]. Fewer parameters [67-69] are required, making it computationally more efficient and faster to train. In GRU, the functionalities of the inputting and forgetting gates in LSTM are combined into a single gate for data updating, which reduces the complexity of the architecture. GRU is specifically capable of capturing short-term relationships in sequential data [70], and its strong performance has been observed in tasks where remembering recent information is important. In summary, the GRU architecture is presented as a streamlined version [71] of LSTM, demonstrating efficiency in training and strong performance [72-75], particularly in scenarios requiring the capture of short-term dependencies.
-
3.2 N-BEATS (Neural Basis Expansion Analysis for Time Series Forecasting)
The N-BEATS (Neural Basis Expansion Analysis for Time Series) model has been designed as a state-of-the-art deep learning architecture specifically for univariate and multivariate time series forecasting. Proposed by Oreshkin et al. in 2020, the N-BEATS architecture was introduced for interpretable time series forecasting, with a novel emphasis on a fully data-driven approach that eliminates the need for domain-specific data pre-processing. As shown in Fig.2, the core building block of this architecture consists of a multi-layer fully connected (FC) network, where nonlinearities are provided by the ReLU activation function. Basis expansion coefficients are predicted both forward (forecast) and backward (back cast), allowing complex temporal patterns to be captured. These blocks are organized into stacks using a doubly residual stacking principle, in which a stack may contain layers with shared back cast and forecast blocks. Forecasts are aggregated hierarchically, enabling the construction of very deep neural networks with interpretable outputs. The equations for the N-BEATS are as follows:
xr = Re Lu[xr 1 - xr 1 ],
hr -1 = Cr, i (xr),...., hr, l = Cr, i (hr ’ l-1), xˆr
= Brhr , l , yr = Frh
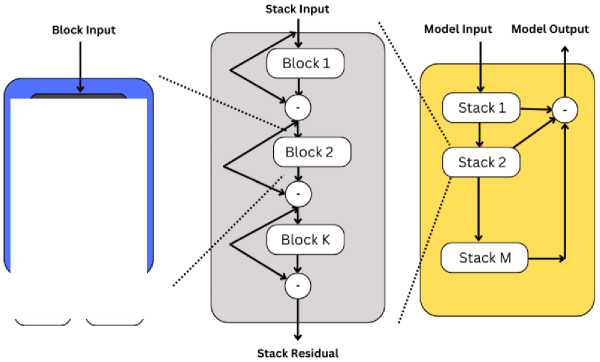
Fig. 2. N-BEATS Architecture
This design enables both long-term trends and short-term fluctuations to be modeled effectively, making N-BEATS particularly well-suited for complex forecasting tasks, such as those in financial markets where intricate temporal dynamics are present. By learning directly from raw data, a versatile and powerful solution is provided by the N-BEATS model for capturing diverse patterns in time series data.
3.3 Integration Approach
4. Experiments and Results4.1 Data Selection, Preparation and Preprocessing
The selection of a dataset for stock market price prediction research depends on the specific objectives of the modeling and the characteristics of the market being analyzed. The S&P 500 dataset is well-suited for stock price prediction in stable and mature markets like the U.S., where market behavior is more predictable due to well-established regulations. This makes it an ideal choice when using models such as N-BEATS, which are known for effectively handling complex trends and seasonality. The stability of the U.S. market ensures that these models can reliably capture and forecast patterns, offering consistent and insightful analysis compared to the higher volatility seen in emerging markets. Stock price data from ten different companies in the S&P 500 was utilized for the experiments, and it was downloaded from Yahoo Finance. These companies were selected to represent a wide range of market behaviors and were divided into two categories: five companies with observable seasonal, cyclic, or trend patterns, and five companies without such patterns. The dataset, spanning a 5-year period from January 2015 to December 2019, was stored in separate CSV files for each stock. Key financial indicators, such as Open, High, Low, Close prices and Volume, were included in each file. This diversity allowed for model performance to be evaluated across different market behaviors.
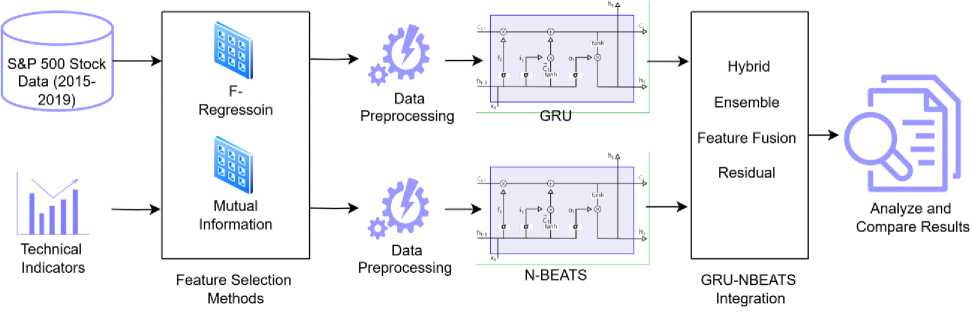
Fig. 3. Methodology Design
In the Hybrid Model, N-BEATS is used to extract features from the stock data, which are then passed into the GRU model for sequential prediction. This approach captures both the long-term trend components from N-BEATS and the short-term temporal dependencies modeled by GRU. This dual-model framework ensures that the model handles both trend-based and sequential fluctuations effectively. Furthermore, a Model Ensemble technique is employed, where predictions from both N-BEATS and GRU are blended using a meta-model, such as Linear Regression, to determine the optimal combination of outputs, resulting in a unified prediction. Another integration method, Feature Fusion, combines the outputs of N-BEATS with the raw input features, forming a comprehensive feature set. This allows the GRU model to make predictions based on a richer set of data representations, improving its ability to capture diverse patterns in the stock data. Additionally, the Residual Learning method refines the residuals (errors) from the N-BEATS model by using a GRU model to further adjust and improve the accuracy of the predictions. This iterative process helps to correct the errors from the initial predictions and fine-tune the final output.
Through these hybrid and integrated approaches, the proposed model demonstrates multiple strategies for combining models, each designed to handle the complexities of stock price prediction. By utilizing both trendextracting and sequential-prediction capabilities, the model effectively balances the nuances of time series components and delivers more reliable and accurate predictions. This layered integration of GRU and N-BEATS ensures that the model adapts to both structured and unstructured stock price data, enhancing its overall predictive performance.
Data from multiple stocks, some of which exhibit clear seasonal and cyclic patterns while others do not, are used to conduct experiments to comprehensively evaluate the model's versatility across different market behaviors. Several hybrid techniques, including simple stacking, averaging, and weighted averaging, are implemented to integrate the predictive capabilities of GRU and N-BEATS. Various technical indicators are included to capture market trends, momentum, and volatility, while feature selection methods are employed to optimize the input features for each model.
To enhance the predictive power of the models, an extensive set of technical indicators (TIs) was generated using the ‘ta’ library (Technical Analysis library). Total 86 different technical indicators, covering categories like trend, momentum, volatility, and volume, were computed. Insights into market direction, speed and magnitude of price changes, price fluctuations over time, and the strength of price movements relative to trading volume were provided by these categories. The incorporation of these diverse indicators allowed multiple dimensions of market behavior to be captured, improving the models' ability to predict future stock prices accurately. Missing data was handled using the nan_to_num function from the yfinance module.
Given the large number of features, feature selection methods were employed to identify the most relevant ones, thereby improving model performance, and reducing computational complexity. Two feature selection techniques were used: f_regression and mutual information. F_regression was used to assess the linear relationship between each feature and the target variable (stock price) and to select features with the strongest correlation. Mutual Information was employed to measure the dependency between variables, identifying features that provided the most information about the target beyond simple linear correlations.
The selected features were used to train the GRU, N-BEATS, and hybrid models, ensuring that only the most informative data was utilized to enhance predictive accuracy. The dataset was split into training and test sets with an 8020 split, where 80% of the data was used for training and 20% for testing. A validation set was created from the training data to fine-tune the models and prevent over fitting.
Table 1. Experimental Setup
|
Aspect |
Details |
|
Dataset |
S&P 500 stock price data for 10 companies (from Yahoo Finance). |
|
Dataset size |
8,87,668 bytes |
|
Data Period |
January 2015 – December 2019 |
|
Data Storage Format |
Separate CSV files for each stock |
|
Financial Indicators Included |
Open, High, Low, Close prices, Volume |
|
Technical Indicators (TIs) |
86 different technical indicators (trend, momentum, volatility, and volume) |
|
Missing Data Handling |
nan_to_num function from the yfinance module |
|
Feature Selection Techniques |
f_regression |
|
Mutual Information |
|
|
Models Used |
GRU, N-BEATS, Hybrid Models (combination of GRU and N-BEATS) |
|
Data Split |
80% training, 20% testing. |
|
N-BEATS Model Architecture |
Two fully connected dense layers (128 and 64 neurons). Optimizer: Adam. Loss: Mean Squared Error (MSE). |
|
GRU Model Architecture |
Two GRU layers (50 units each) and a final dense layer for predicting closing price. Optimizer: Adam. Loss: MSE. |
|
Training Parameters |
- 200 epochs |
|
- Batch size: 32 |
|
|
- Validation split: 20% |
|
|
Activation Function |
Rectified Linear Unit (ReLU) for both GRU and N-BEATS models |
The N-BEATS model was composed of two fully connected dense layers with 128 and 64 neurons, respectively, and trained using the Adam optimizer with Mean Squared Error (MSE) loss. The GRU model consisted of two GRU layers with 50 units each and a final dense layer for predicting the closing price. The GRU model was trained with the Adam optimizer and MSE loss as well. Both models were trained for 200 epochs with a batch size of 32 and a validation split of 20%. The Rectified Linear Unit (ReLU) activation function is used in both the GRU and N-BEATS models.
-
4.2 Results
In this section, the empirical findings from the application of various models and hybrid approaches to stock price prediction are presented. The performance of N-BEATS, GRU, Hybrid Models, Ensemble, Feature Fusion and Residual Learning models was evaluated using the metrics like MAE, RMSE, R-Squared and MAPE.
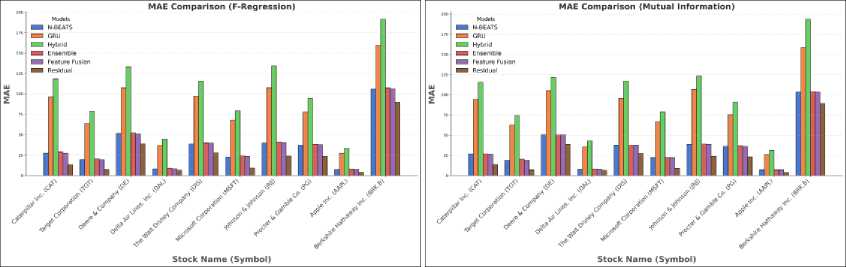
Table 2. Forecasting results (MAE) using F-Regression
|
Stock Name (Symbol) / Model |
N-BEATS |
GRU |
Hybrid |
Ensemble |
Feature Fusion |
Residual |
|
Caterpillar Inc. (CAT) |
27.59 |
96.15 |
118.56 |
29.18 |
27.40 |
13.50 |
|
Target Corporation (TGT) |
19.58 |
63.81 |
78.91 |
20.76 |
19.50 |
7.50 |
|
Deere & Company (DE) |
51.59 |
107.54 |
133.21 |
51.81 |
50.99 |
39.13 |
|
Delta Air Lines, Inc. (DAL) |
8.26 |
36.97 |
44.80 |
9.19 |
8.37 |
6.67 |
|
The Walt Disney Company (DIS) |
38.98 |
97.18 |
115.69 |
40.33 |
39.80 |
28.16 |
|
Microsoft Corporation (MSFT) |
22.83 |
67.92 |
79.26 |
24.34 |
23.56 |
9.36 |
|
Johnson & Johnson (JNJ) |
39.86 |
107.64 |
134.35 |
41.28 |
40.50 |
24.19 |
|
Procter & Gamble Co. (PG) |
37.25 |
77.50 |
94.35 |
38.44 |
37.99 |
23.57 |
|
Apple Inc. (AAPL) |
7.46 |
27.42 |
33.36 |
8.13 |
7.68 |
3.89 |
|
Berkshire Hathaway Inc. (BRK.B) |
105.98 |
159.63 |
191.48 |
107.35 |
106.23 |
89.98 |
Table 3. Forecasting results (MAE) using Mutual Information
|
Stock Name (Symbol) / Model |
N-BEATS |
GRU |
Hybrid |
Ensemble |
Feature Fusion |
Residual |
|
Caterpillar Inc. (CAT) |
26.85 |
94.28 |
115.40 |
26.87 |
26.80 |
13.76 |
|
Target Corporation (TGT) |
18.82 |
62.48 |
74.20 |
20.45 |
18.90 |
7.14 |
|
Deere & Company (DE) |
50.88 |
105.05 |
121.40 |
50.49 |
50.84 |
38.82 |
|
Delta Air Lines, Inc. (DAL) |
8.10 |
35.80 |
43.10 |
8.12 |
8.10 |
6.55 |
|
The Walt Disney Company (DIS) |
37.90 |
95.45 |
116.90 |
37.53 |
37.85 |
27.28 |
|
Microsoft Corporation (MSFT) |
22.31 |
66.71 |
78.50 |
22.49 |
22.32 |
9.03 |
|
Johnson & Johnson (JNJ) |
38.75 |
106.63 |
123.10 |
39.19 |
38.87 |
24.05 |
|
Procter & Gamble Co. (PG) |
36.20 |
75.36 |
90.90 |
36.71 |
36.23 |
23.18 |
|
Apple Inc. (AAPL) |
7.22 |
26.14 |
31.30 |
7.32 |
7.23 |
3.79 |
|
Berkshire Hathaway Inc. (BRK.B) |
103.44 |
158.30 |
193.50 |
103.85 |
103.54 |
89.18 |
(a) (b)
Fig. 4. (a) MAE comparison (F-Regression) (b) MAE comparison (Mutual Information)
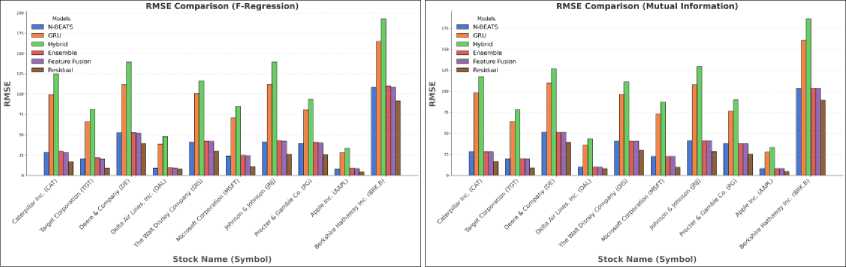
Table 4. Forecasting results (RMSE) using F-Regression
|
Stock Name (Symbol) / Model |
N-BEATS |
GRU |
Hybrid |
Ensemble |
Feature Fusion |
Residual |
|
Caterpillar Inc. (CAT) |
28.50 |
99.20 |
124.90 |
30.00 |
28.40 |
16.90 |
|
Target Corporation (TGT) |
20.40 |
65.90 |
81.20 |
21.80 |
20.30 |
8.90 |
|
Deere & Company (DE) |
52.10 |
111.50 |
139.50 |
52.40 |
51.70 |
39.40 |
|
Delta Air Lines, Inc. (DAL) |
9.00 |
38.50 |
47.80 |
9.80 |
9.10 |
8.10 |
|
The Walt Disney Company (DIS) |
41.00 |
100.50 |
116.40 |
42.30 |
41.80 |
30.00 |
|
Microsoft Corporation (MSFT) |
23.80 |
70.50 |
84.80 |
25.00 |
24.20 |
10.50 |
|
Johnson & Johnson (JNJ) |
41.30 |
111.60 |
139.30 |
42.90 |
42.20 |
26.10 |
|
Procter & Gamble Co. (PG) |
39.50 |
80.50 |
93.50 |
40.70 |
40.00 |
25.40 |
|
Apple Inc. (AAPL) |
8.10 |
28.40 |
33.40 |
8.70 |
8.30 |
4.50 |
|
Berkshire Hathaway Inc. (BRK.B) |
108.40 |
164.70 |
192.60 |
109.80 |
108.50 |
91.50 |
Table 5. Forecasting results (RMSE) using Mutual Information
|
Stock Name (Symbol) / Model |
N-BEATS |
GRU |
Hybrid |
Ensemble |
Feature Fusion |
Residual |
|
Caterpillar Inc. (CAT) |
28.02 |
98.22 |
117.10 |
28.12 |
28.02 |
16.75 |
|
Target Corporation (TGT) |
19.70 |
63.82 |
78.00 |
19.82 |
19.70 |
8.91 |
|
Deere & Company (DE) |
51.13 |
109.50 |
126.80 |
50.92 |
51.11 |
39.44 |
|
Delta Air Lines, Inc. (DAL) |
9.86 |
36.12 |
43.70 |
9.86 |
9.86 |
8.03 |
|
The Walt Disney Company (DIS) |
40.59 |
96.11 |
111.00 |
40.59 |
40.59 |
29.80 |
|
Microsoft Corporation (MSFT) |
22.47 |
73.02 |
87.00 |
22.47 |
22.47 |
9.78 |
|
Johnson & Johnson (JNJ) |
41.22 |
107.50 |
129.20 |
41.22 |
41.22 |
28.38 |
|
Procter & Gamble Co. (PG) |
38.09 |
76.26 |
89.60 |
38.09 |
38.09 |
25.45 |
|
Apple Inc. (AAPL) |
8.06 |
27.72 |
33.10 |
8.06 |
8.06 |
4.53 |
|
Berkshire Hathaway Inc. (BRK.B) |
103.49 |
160.82 |
186.00 |
103.49 |
103.49 |
89.32 |
(a)
(b)
Fig. 5. (a) RMSE comparison (F-Regression) (b) RMSE comparison (Mutual Information)
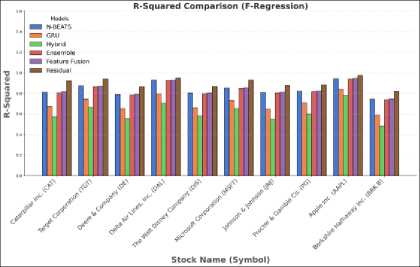
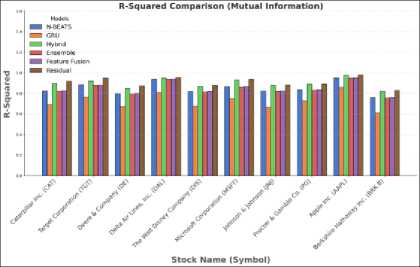
Table 6. Forecasting results (R2 Score) using F-Regression
|
Stock Name (Symbol) / Model |
N-BEATS |
GRU |
Hybrid |
Ensemble |
Feature Fusion |
Residual |
|
Caterpillar Inc. (CAT) |
0.812 |
0.672 |
0.572 |
0.806 |
0.815 |
0.922 |
|
Target Corporation (TGT) |
0.873 |
0.745 |
0.665 |
0.865 |
0.87 |
0.942 |
|
Deere & Company (DE) |
0.789 |
0.651 |
0.551 |
0.784 |
0.792 |
0.865 |
|
Delta Air Lines, Inc. (DAL) |
0.93 |
0.795 |
0.705 |
0.927 |
0.929 |
0.948 |
|
The Walt Disney Company (DIS) |
0.804 |
0.659 |
0.579 |
0.798 |
0.805 |
0.868 |
|
Microsoft Corporation (MSFT) |
0.854 |
0.731 |
0.651 |
0.848 |
0.856 |
0.93 |
|
Johnson & Johnson (JNJ) |
0.811 |
0.648 |
0.548 |
0.805 |
0.812 |
0.876 |
|
Procter & Gamble Co. (PG) |
0.822 |
0.709 |
0.599 |
0.816 |
0.824 |
0.884 |
|
Apple Inc. (AAPL) |
0.944 |
0.841 |
0.781 |
0.941 |
0.946 |
0.975 |
|
Berkshire Hathaway Inc. (BRK.B) |
0.743 |
0.589 |
0.479 |
0.739 |
0.746 |
0.818 |
Table 7. Forecasting results (R2 Score) using Mutual Information
|
Stock Name (Symbol) / Model |
N-BEATS |
GRU |
Hybrid |
Ensemble |
Feature Fusion |
Residual |
|
Caterpillar Inc. (CAT) |
0.825 |
0.692 |
0.899 |
0.82 |
0.826 |
0.917 |
|
Target Corporation (TGT) |
0.885 |
0.762 |
0.921 |
0.877 |
0.88 |
0.949 |
|
Deere & Company (DE) |
0.798 |
0.669 |
0.849 |
0.793 |
0.8 |
0.872 |
|
Delta Air Lines, Inc. (DAL) |
0.937 |
0.81 |
0.949 |
0.935 |
0.938 |
0.955 |
|
The Walt Disney Company (DIS) |
0.817 |
0.675 |
0.869 |
0.812 |
0.818 |
0.876 |
|
Microsoft Corporation (MSFT) |
0.866 |
0.748 |
0.93 |
0.86 |
0.867 |
0.937 |
|
Johnson & Johnson (JNJ) |
0.823 |
0.665 |
0.878 |
0.818 |
0.824 |
0.883 |
|
Procter & Gamble Co. (PG) |
0.835 |
0.726 |
0.889 |
0.829 |
0.836 |
0.891 |
|
Apple Inc. (AAPL) |
0.951 |
0.857 |
0.975 |
0.948 |
0.952 |
0.978 |
|
Berkshire Hathaway Inc. (BRK.B) |
0.758 |
0.608 |
0.82 |
0.754 |
0.759 |
0.828 |
(a)
Fig. 6. (a) R2 Score comparison (F-Regression) (b) R2 Score comparison (Mutual Information)
(b)
Datasets from multiple companies representing diverse market behaviors were used to test the models, and the impact of feature selection methods, specifically F-regression and Mutual Information, was also examined. Detailed forecasting results obtained from all experiments are provided here.
(a)
Fig. 7. (a) MAPE comparison of all models using F-Regression (b) MAPE comparison all models using F-Regression excluding Hybrid model
(b)
Table 8. Forecasting results (MAPE) using F-Regression
|
Stock Name (Symbol) / Model |
N-BEATS |
GRU |
Hybrid |
Ensemble |
Feature Fusion |
Residual |
|
Caterpillar Inc. (CAT) |
0.00645 |
0.01547 |
0.02595 |
0.00758 |
0.00639 |
0.00533 |
|
Target Corporation (TGT) |
0.00683 |
0.01109 |
0.01407 |
0.00648 |
0.00635 |
0.00445 |
|
Deere & Company (DE) |
0.00578 |
0.02088 |
0.02781 |
0.00644 |
0.00574 |
0.00468 |
|
Delta Air Lines, Inc. (DAL) |
0.00301 |
0.00640 |
0.00764 |
0.00309 |
0.00328 |
0.00038 |
|
The Walt Disney Company (DIS) |
0.00345 |
0.01474 |
0.08028 |
0.00326 |
0.00342 |
0.00015 |
|
Microsoft Corporation (MSFT) |
0.00761 |
0.01227 |
0.01728 |
0.00974 |
0.00906 |
0.00356 |
|
Johnson & Johnson (JNJ) |
0.00338 |
0.02034 |
0.11099 |
0.02202 |
0.00374 |
0.00064 |
|
Procter & Gamble Co. (PG) |
0.00257 |
0.01072 |
0.01232 |
0.00349 |
0.00266 |
0.00062 |
|
Apple Inc. (AAPL) |
0.00581 |
0.00600 |
0.00637 |
0.00784 |
0.00588 |
0.00473 |
|
Berkshire Hathaway Inc. (BRK.B) |
0.00300 |
0.02244 |
0.16169 |
0.01790 |
0.00311 |
0.00131 |
Table 9. Forecasting results (MAPE) using Mutual Information
|
Stock Name (Symbol) / Model |
N-BEATS |
GRU |
Hybrid |
Ensemble |
Feature Fusion |
Residual |
|
Caterpillar Inc. (CAT) |
0.004617 |
0.013802 |
0.017779 |
0.004997 |
0.004628 |
0.001537 |
|
Target Corporation (TGT) |
0.005234 |
0.008857 |
0.018279 |
0.006063 |
0.004963 |
0.001109 |
|
Deere & Company (DE) |
0.003182 |
0.018725 |
0.036391 |
0.005377 |
0.003842 |
0.000967 |
|
Delta Air Lines, Inc. (DAL) |
0.002443 |
0.006631 |
0.005078 |
0.004083 |
0.002484 |
0.000456 |
|
The Walt Disney Company (DIS) |
0.002547 |
0.020681 |
0.080492 |
0.003315 |
0.002744 |
0.000689 |
|
Microsoft Corporation (MSFT) |
0.004798 |
0.012067 |
0.019208 |
0.009249 |
0.004802 |
0.002342 |
|
Johnson & Johnson (JNJ) |
0.006764 |
0.015056 |
0.110985 |
0.007126 |
0.006367 |
0.00135 |
|
Procter & Gamble Co. (PG) |
0.002902 |
0.010358 |
0.019848 |
0.003816 |
0.002783 |
0.000745 |
|
Apple Inc. (AAPL) |
0.003935 |
0.005192 |
0.006416 |
0.006287 |
0.004051 |
0.001223 |
|
Berkshire Hathaway Inc. (BRK.B) |
0.005785 |
0.023296 |
0.161493 |
0.006926 |
0.00555 |
0.000739 |
(a)
Fig. 8. (a) MAPE comparison of all models using Mutual Information (b) MAPE comparison of all models using Mutual Information excluding Hybrid model
(b)
The performance of the model is presented in two separate graphs. In the first graph Fig.7 (a), a significantly higher MAPE value for the direct hybrid model is observed compared to the other models. To facilitate a clearer comparison among the remaining models, the results of the hybrid model have been excluded from the second graph, Figure 7(b). This same approach has been applied in Fig.8 (a) and Fig.8 (b).
-
A. Performance of Individual Models
The performance analysis of individual models revealed significant variations in their ability to predict stock prices: N-BEATS consistently demonstrated superior performance, achieving the lowest forecasting errors (MAE, RMSE) and highest accuracy (R²) across most stocks. Its ability to capture complex temporal dependencies makes it a reliable model for stock market prediction. This trend is consistent regardless of the feature selection method applied, highlighting the robustness of the N-BEATS architecture. GRU performed sub optimally in comparison to N-BEATS, with higher error rates and lower R² scores. Although GRU is designed to handle sequential data, its architecture may struggle to capture the intricate patterns and volatility associated with stock price movements. In certain cases, the performance gap between N-BEATS and GRU was particularly pronounced for volatile stocks (e.g., Berkshire Hathaway Inc.), where GRU’s limitations became more evident. Conversely, for stocks with relatively stable trends (e.g., Apple Inc. and Delta Air Lines), the performance gap narrowed, and indicating GRU’s capability to handle less volatile data. Overall, N-BEATS outperformed GRU and baseline models across all error metrics, making it a preferred choice for accurate stock market forecasting.
-
B. Impact of Feature Selection Methods.
Feature selection methods significantly impacted performance. The superior results from Mutual Information suggest that identifying and leveraging the most informative features can dramatically improve forecasting accuracy, especially for models that rely on feature interactions. Mutual Information led to slightly better results for most stocks, especially for Residual and Ensemble models. For example, the MAE of the Residual model for Delta Air Lines (DAL) was 6.67 (F-Regression) compared to 6.55 (Mutual Information). Models trained with Mutual Information often exhibited marginally lower RMSE and MAPE values, indicating its suitability for extracting informative features.
-
C. Analysis of Hybrid and Ensemble Approaches
Mixed results were shown by the Hybrid Models, which integrate predictions from both N-BEATS and GRU. Although the intention behind hybridization is to leverage the strengths of each model, it was suggested by the results that simple combinations do not necessarily lead to better performance. For instance, a high MAPE of 0.080492 was yielded by the Hybrid Model for The Walt Disney Company with Mutual Information, indicating that more sophisticated techniques or regularization methods might be required to prevent over fitting in hybrid models. In contrast, Ensemble methods, which aggregate the outputs of multiple models, generally performed well across different datasets. Better results were consistently achieved by the Ensemble method, particularly when Mutual Information was used for feature selection, compared to the Hybrid Model. This suggests that ensemble approaches can provide more reliable and robust predictions by averaging out the biases and variances of individual models.
-
D. Effectiveness of Feature Fusion and Residual Learning
Balanced performance, often comparable to or slightly better than the individual N-BEATS model, was demonstrated by Feature Fusion, where input features from both N-BEATS and GRU models were combined. This indicates that incorporating a diverse set of features can enhance the model's capacity to learn from the data, especially when the underlying patterns are complex and multifaceted. The most effective approach in reducing prediction errors across nearly all datasets emerged by Residual Learning. Good results were consistently achieved by the model, such as for The Walt Disney Company with F-regression, underscoring its ability to fine-tune predictions by focusing on the residuals of other models. The superior performance of this method suggests that it effectively captures nuances in the data that other models miss, making it a valuable approach for stock price forecasting.
-
E. Comparative Analysis Across Different Market Conditions
-
F. Summary of Findings
-
4.3 Results and Insights from Residual Learning using Delta Air Lines, Inc. (DAL) Dataset
While individual models like N-BEATS and GRU were found to be effective, it was indicated by the results that their combination through hybrid or ensemble methods can enhance predictive accuracy. However, significant influence on outcomes was exerted by the choice of feature selection method, and substantial reduction in prediction errors was achieved through advanced techniques like Residual Learning. The residual learning model demonstrates remarkable consistency in delivering superior results across various datasets due to its error-correction mechanism. By learning residual patterns (the difference between the predicted and actual values), the model effectively minimizes errors left unaddressed by the base predictors. This adaptability allows it to capture intricate non-linear relationships and reduce prediction bias. These findings highlight the need for a nuanced approach to model selection and combination, depending on the specific characteristics of the stock data and market conditions under consideration.
A detailed analysis of the Residual Learning model using the Delta Air Lines, Inc. (DAL) dataset, which has achieved the best prediction results, will be undertaken by visualizing various aspects of its performance through a series of informative graphs. A clearer understanding of the model's effectiveness and areas for improvement will be provided by these visualizations, facilitating a comprehensive evaluation of the Residual Learning approach in stock price prediction.
-
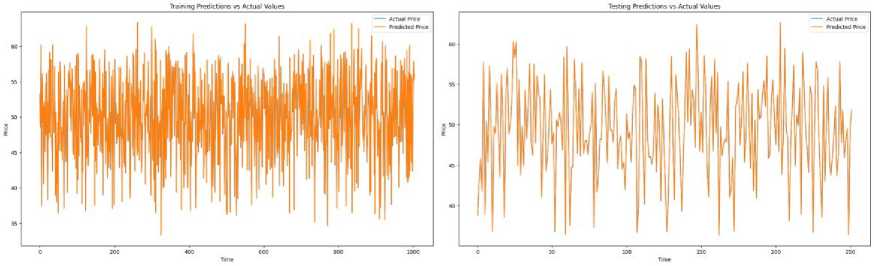
A. Training and Testing Predictions
The graphs shown in Fig.9 demonstrate excellent alignment between the predicted prices (orange line) and the actual prices (blue line), indicating that the underlying patterns in the training data have been captured remarkably well by the model. The overlapping nature of the lines is reflective of the strong ability of the model to learn from the data and deliver precise predictions during training. The consistency in the prediction curve showcases the robustness and effectiveness of the model in understanding the historical trends of the data.
(b)
(a)
Fig. 9. (a) Training Predictions vs Actual Values (b) Testing Predictions vs Actual Values
It is observed that the model performs admirably on unseen data during the testing phase, with the predicted prices closely following the actual prices. This strong correspondence between predicted and actual values is indicative of the model's capacity to generalize well, successfully extending its learned patterns to new data. An impressive level of accuracy is maintained by the model, highlighting its reliability when applied to real-world scenarios.
-
B. Residuals Plot
The residuals in the training phase are scattered evenly around zero as shown in Fig.10, indicating that the relationship between the input features and the target variable is effectively learned by the model. A good fit of the model is suggested by the relatively tight spread around zero, with over fitting to the noise in the training data being avoided. Minimal systematic bias in the model’s predictions during training is indicated by the consistent pattern with no large spikes or clear upward/downward trends.
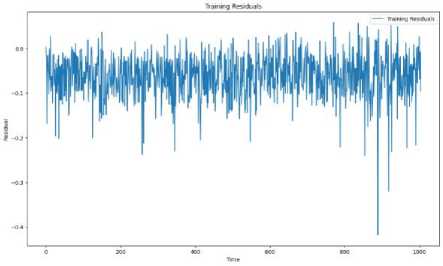
(a)
Fig. 10. (a) Training Residuals (b) Testing Residuals
(b)
A similar pattern of distribution around zero is shown by the residuals in the testing phase, suggesting that good generalization to unseen data is achieved by the model. A stable model that does not make extreme prediction errors on the test set is pointed towards by the absence of large deviations in the testing residuals. Good out-of-sample performance is demonstrated by the model's predictions being generally close to the actual values, as indicated by the smooth yet random variation of residuals in the test data.
-
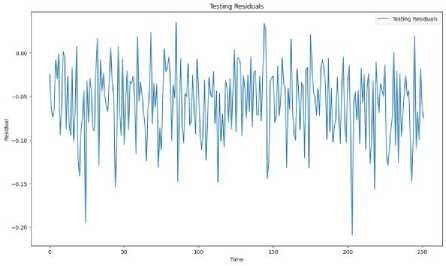
C. Distribution of Residuals
The ‘Distribution of Residuals’ shown in Fig. 11 provides clear evidence of the model's strong performance. The residuals are symmetrically distributed around zero, forming a bell-shaped curve, which indicates that the model's predictions do not consistently overestimate or underestimate stock prices. This normal distribution of residuals suggests that the errors are random and not biased in any particular direction.
Fig. 11. (a) Distribution of Training Residuals (b) Distribution of Testing Residuals
Moreover, the residuals are concentrated closely around zero, reflecting that the majority of the model's predictions are accurate, with only minor deviations from the actual stock prices. There is no significant skewness or kurtosis in the distribution, further reinforcing the conclusion that the model is making reliable and unbiased predictions.
In conclusion, the pattern observed in Fig. 11 demonstrates that the model is performing well, with residuals that are normally distributed and centered near zero, indicating accurate and consistent stock price predictions.
-
D. Scatter Plot of Predictions vs Actual Values
The scatter plot shown in Fig.12 exhibits a very strong alignment along the diagonal line, indicating an excellent fit of the model to the training data. The near-perfect correspondence between actual and predicted values is implied, suggesting that the underlying trends of the stock prices in the training set are effectively captured by the model. The high correlation is shown, demonstrating that the relationship between features and target values has been learned by the model, resulting in highly accurate predictions during training.
Like the training scatter plot, the points are scattered without any noticeable pattern, which is strongly indicative of the absence of over fitting and the maintenance of predictive performance on unseen data. The residuals in the testing set are closely clustered near zero, reflecting the good performance and consistency of the model in predicting stock prices on new data.
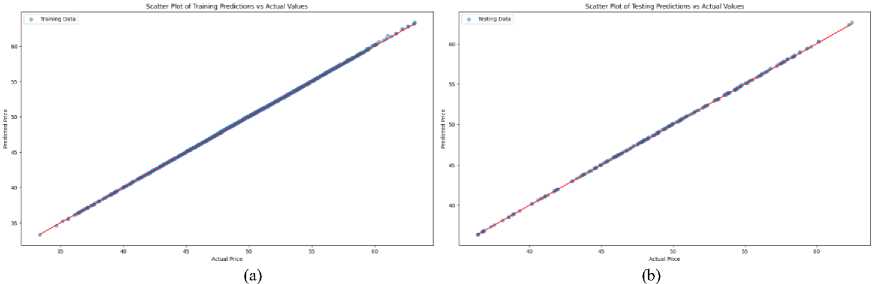
Fig. 12. (a) Scatter plot of Training Predictions vs Actual Values (b) Scatter plot of Testing Predictions vs Actual Values
-
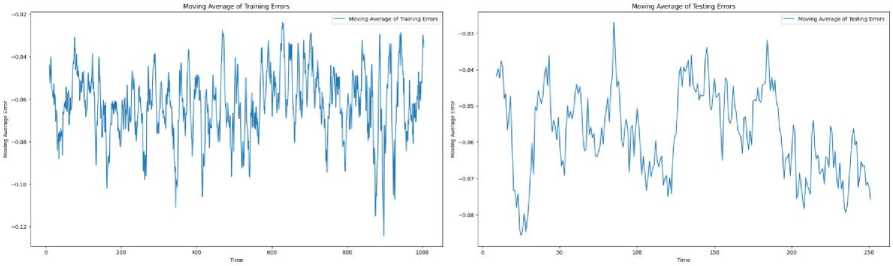
E. Moving Average of Errors
The smoothness of the moving average curve shown in Fig.13 implied to suggest that short-term fluctuations or outliers do not highly influence the model, indicating robustness in learning from the training data. Strong generalization performance is indicated by a low and stable moving average of testing errors, showing that accurate predictions on unseen data are achievable by the model. If a pattern similar to the training errors, but with slightly higher values, is followed by the moving average of testing errors, it is suggested that over fitting of the training data has not occurred and that good performance on new data is achieved by the model.
(b)
(a)
Fig. 13. (a) Moving Average of Training Errors (b) Moving average of Testing Errors
Reliable performance over time and minimal deviations in predictive accuracy are demonstrated by the consistency and minimal oscillation in the moving average of testing errors.
-
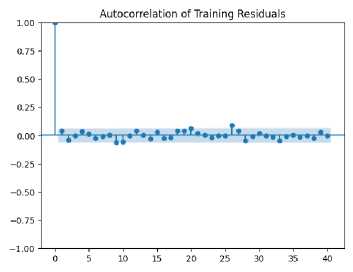
F. Error Autocorrelation Plot
The plot is shown to exhibit a significant drop in autocorrelation after lag 0, with most values remaining close to zero. As shown in Fig. 14, this is indicative of the residuals being largely uncorrelated, suggesting that relevant patterns in the data have been successfully captured by the model without leaving systematic errors in the predictions. Similarly, minimal correlation beyond lag 0 is observed in the autocorrelation of the testing residuals, confirming that good performance is achieved by the model on unseen data. The absence of significant autocorrelation in the testing set suggests effective generalization by the model, with errors being randomly distributed rather than following a specific pattern.
(a)
Fig. 14. (a) Autocorrelation of training residuals (b) Autocorrelation of testing residuals
(b)
-
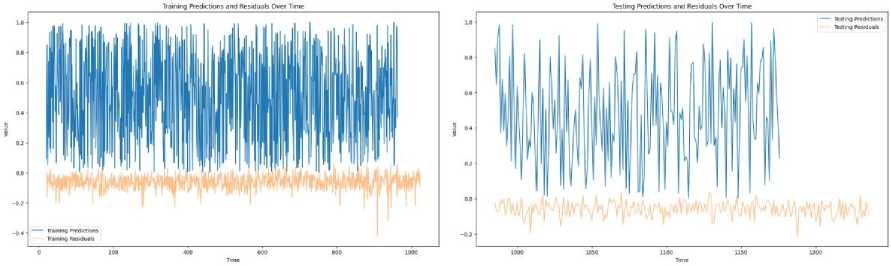
G. Predictions and Residuals Over Time
The predicted stock prices closely follow the actual values, as shown in Fig. 15, demonstrating the model's accuracy in capturing the market's behavior. The residuals, plotted over time, remain consistently low and centered on zero, indicating minimal deviation between the predicted and actual values. This suggests that the model effectively captures the underlying stock price patterns, with only minor fluctuations. The absence of large, persistent residuals further reinforces the model's strong predictive performance, showcasing its robustness in forecasting stock prices over the given time period.
(b)
(a)
Fig. 15. (a) Training Predictions and Residuals over Time (b) Testing Predictions and Residuals over Time
-
H. Boxplot of Residuals
The boxplots for both training and testing residuals are characterized by a relatively symmetric distribution, with the median situated near the center of the box as shown in Fig.16. This symmetry suggests that the residuals are evenly distributed around zero, indicating that the model’s predictions are generally unbiased, avoiding consistent over prediction or under prediction of stock prices the relatively narrow interquartile range (IQR) indicates that most residuals are closely clustered around the median, reflecting strong predictive performance and contributing to a reliable model with mostly minor errors.
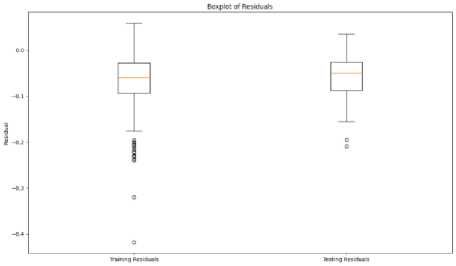
Fig. 16. Boxplots of residuals
-
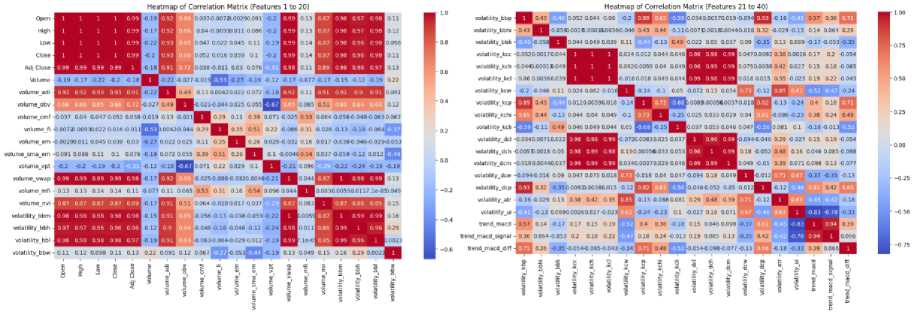
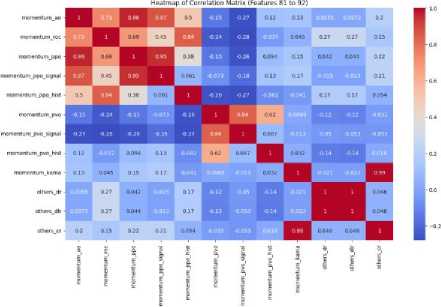
I. Heatmap of Correlation Matrix
In the heatmap for all features, there is a wide range of correlations displayed between the various features. The diagonal, as expected, shows perfect correlations (correlation = 1) for each feature with itself. Many features have clusters of strong positive correlations, indicated by the deep red squares, particularly among price-based features like Open, Close, and Adj Close. This suggests that these features capture similar information, potentially leading to redundancy in the dataset.
On the other hand, certain features exhibit weak or negative correlations with others, as shown by the lighter blue and red squares scattered throughout the heatmap. This indicates that these features might provide distinct and nonoverlapping information. For example, some volume-based or volatility features, such as volume_nvi, volatility_bbl, and momentum_ppo_hist, appear to have relatively low correlations with other groups of features, implying that they may introduce unique aspects into the predictive model.
Overall, the heatmap reveals areas of multicollinearity among closely related features but also highlights the diversity of information provided by some other features. This suggests that while some features may need to be removed to avoid redundancy, others could contribute valuable independent information for analysis or prediction.
(a) (b)
(c) (d)
(e)
Fig. 17. Heatmap of correlation matrix of features (a) 1 to 20 (b) 21 to 40 (c) 41 to 60 (d) 61 to 80 (e) 81 to 92
(a) (b)
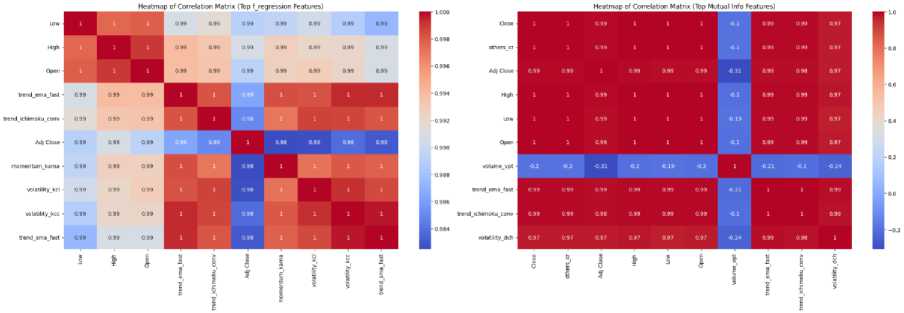
Fig. 18. Heatmap of correlation matrix (a) Top f_regression features (b) Top Mutual_Info features
In the f_regression heatmap, most features exhibit a very high correlation with each other, with values close to 1, suggesting that they are closely related and may contain redundant information. Features like Low, High, Open, and Adj Close have correlations near 1, indicating multicollinearity, which could hinder the performance of a predictive model. While these features are important, their strong correlation implies that including all of them may not provide additional value, as they likely capture similar patterns in the data. Thus, it might be beneficial to remove some of the redundant features to avoid issues arising from multicollinearity.
In the mutual information heatmap, there is a mix of high and lower correlations among the selected features, with some features, such as Close, High, Low, Open, and Adj Close, still showing high correlations, while others like volume_vpt exhibit much weaker or even negative correlations. The lower correlation of volume_vpt with the other features suggests that it provides unique information not captured by the highly correlated price-based features. This diversity in feature selection indicates that the mutual information method may be better at selecting features that bring different aspects of the data to the model, potentially improving the predictive performance and reducing the risk of over fitting.
5. Conclusion and Future Scope
This study explores the effectiveness of various methods for integrating two widely used time series models, GRU and N-BEATS, with the objective of improving stock price predictions across diverse time series patterns. The integration of these models, such as utilizing N-BEATS to generate features for GRU or applying GRU for residual learning, consistently yielded better results compared to standalone models and other combinations. These integration approaches were able to capture different aspects of the time series data, leading to more accurate and reliable predictions. The findings highlight a correlation between the combination strategies and the specific characteristics of the time series data. For stocks exhibiting clear trends or seasonality, techniques such as feature fusion and residual learning significantly enhanced prediction accuracy. In contrast, for stocks lacking such patterns, simpler methods like stacking also improved performance, although to a lesser extent. This underscores the importance of selecting the appropriate combination strategy based on the underlying time series behavior.
References Time Series Forecasting Enhanced by Integrating GRU and N-BEATS
- Pearce, Douglas K. "Challenges to the concept of stock market efficiency." Economic Review 72, no. 8 (1987): 16-33.
- Han, Chenyu, and Xiaoyu Fu. "Challenge and opportunity: deep learning-based stock price prediction by using Bi-directional LSTM model." Frontiers in Business, Economics and Management 8, no. 2 (2023): 51-54.
- Cao, Hongduo, Tiantian Lin, Ying Li, and Hanyu Zhang. "Stock price pattern prediction based on complex network and machine learning." Complexity 2019, no. 1 (2019): 4132485.
- Zhang, Liheng, Charu Aggarwal, and Guo-Jun Qi. "Stock price prediction via discovering multi-frequency trading patterns." In Proceedings of the 23rd ACM SIGKDD international conference on knowledge discovery and data mining, pp. 2141-2149. 2017.
- Han, Zhongyang, Jun Zhao, Henry Leung, King Fai Ma, and Wei Wang. "A review of deep learning models for time series prediction." IEEE Sensors Journal 21, no. 6 (2019): 7833-7848.
- Tang, Yajiao, Zhenyu Song, Yulin Zhu, Huaiyu Yuan, Maozhang Hou, Junkai Ji, Cheng Tang, and Jianqiang Li. "A survey on machine learning models for financial time series forecasting." Neurocomputing 512 (2022): 363-380.
- Rahimzad, Maryam, Alireza Moghaddam Nia, Hosam Zolfonoon, Jaber Soltani, Ali Danandeh Mehr, and Hyun-Han Kwon. "Performance comparison of an LSTM-based deep learning model versus conventional machine learning algorithms for streamflow forecasting." Water Resources Management 35, no. 12 (2021): 4167-4187.
- Liu, Yang. "Novel volatility forecasting using deep learning–long short term memory recurrent neural networks." Expert Systems with Applications 132 (2019): 99-109.
- Cortez, Bitzel, Berny Carrera, Young-Jin Kim, and Jae-Yoon Jung. "An architecture for emergency event prediction using LSTM recurrent neural networks." Expert Systems with Applications 97 (2018): 315-324.
- Cahuantzi, Roberto, Xinye Chen, and Stefan Güttel. "A comparison of LSTM and GRU networks for learning symbolic sequences." In Science and Information Conference, pp. 771-785. Cham: Springer Nature Switzerland, 2023.
- Yamak, Peter T., Li Yujian, and Pius K. Gadosey. "A comparison between arima, lstm, and gru for time series forecasting." In Proceedings of the 2019 2nd international conference on algorithms, computing and artificial intelligence, pp. 49-55. 2019.
- Khandelwal, Shubham, Benjamin Lecouteux, and Laurent Besacier. "Comparing GRU and LSTM for automatic speech recognition." PhD diss., LIG, 2016.
- Yang, Shudong, Xueying Yu, and Ying Zhou. "Lstm and gru neural network performance comparison study: Taking yelp review dataset as an example." In 2020 International workshop on electronic communication and artificial intelligence (IWECAI), pp. 98-101. IEEE, 2020.
- Mateus, Balduíno César, Mateus Mendes, José Torres Farinha, Rui Assis, and António Marques Cardoso. "Comparing LSTM and GRU models to predict the condition of a pulp paper press." Energies 14, no. 21 (2021): 6958.
- Yuan, Jing, and Ying Tian. "An intelligent fault diagnosis method using GRU neural network towards sequential data in dynamic processes." Processes 7, no. 3 (2019): 152.
- Zargar, S. "Introduction to sequence learning models: RNN, LSTM, GRU." Department of Mechanical and Aerospace Engineering, North Carolina State University (2021).
- Nosouhian, Shiva, Fereshteh Nosouhian, and Abbas Kazemi Khoshouei. "A review of recurrent neural network architecture for sequence learning: Comparison between LSTM and GRU." (2021).
- Li, Dan, Guangfan Sun, Shuwei Miao, Ying zhong Gu, Yuan hang Zhang, and Shuai He. "A short-term electric load forecast method based on improved sequence-to-sequence GRU with adaptive temporal dependence." International Journal of Electrical Power & Energy Systems 137 (2022): 107627.
- Zheng, Wendong, and Gang Chen. "An accurate GRU-based power time-series prediction approach with selective state updating and stochastic optimization." IEEE Transactions on Cybernetics 52, no. 12 (2021): 13902-13914.
- Rehmer, Alexander, and Andreas Kroll. "On the vanishing and exploding gradient problem in Gated Recurrent Units." IFAC-PapersOnLine 53, no. 2 (2020): 1243-1248.
- Oreshkin, Boris N., Dmitri Carpov, Nicolas Chapados, and Yoshua Bengio. "N-BEATS: Neural basis expansion analysis for interpretable time series forecasting." arXiv preprint arXiv:1905.10437 (2019).
- Ma, Xiaobing, Bingxin Yan, Han Wang, and Haitao Liao. "Decision-level machinery fault prognosis using N-BEATS-based degradation feature prediction and reconstruction." Mechanical Systems and Signal Processing 198 (2023): 110435.
- Tan, Chang, Xiang Yu, Lihua Lu, and Lisen Zhao. "An Effective N-BEATS Network Model for Short Term Load Forecasting." In International Conference on 6GN for Future Wireless Networks, pp. 229-243. Cham: Springer Nature Switzerland, 2023.
- Becerra-Rico, Josue, Marco A. Aceves-Fernández, Karen Esquivel-Escalante, and Jesús Carlos Pedraza-Ortega. "Airborne particle pollution predictive model using Gated Recurrent Unit (GRU) deep neural networks." Earth Science Informatics 13 (2020): 821-834.
- Michańków, Jakub, Paweł Sakowski, and Robert Ślepaczuk. "LSTM in algorithmic investment strategies on BTC and S&P500 index." Sensors 22, no. 3 (2022): 917.
- Oliver-Muncharaz, Javier. "Comparing classic time series models and the LSTM recurrent neural network: An application to S&P 500 stocks." Finance, Markets and Valuation 6, no. 2 (2020): 137-148.
- Roszyk, Natalia, and Robert Ślepaczuk. "The Hybrid Forecast of S&P 500 Volatility ensembled from VIX, GARCH and LSTM models." arXiv preprint arXiv:2407.16780 (2024).
- Bhandari, Hum Nath, Binod Rimal, Nawa Raj Pokhrel, Ramchandra Rimal, Keshab R. Dahal, and Rajendra KC Khatri. "Predicting stock market index using LSTM." Machine Learning with Applications 9 (2022): 100320.
- Zou, Zhichao, and Zihao Qu. "Using lstm in stock prediction and quantitative trading." CS230: Deep learning, winter (2020): 1-6.
- Kim, Sangyeon, and Myungjoo Kang. "Financial series prediction using Attention LSTM." arXiv preprint arXiv:1902.10877 (2019).
- Bergström, Carl, and Oscar Hjelm. "Impact of time steps on stock market prediction with lstm." (2019).
- Eapen, Jithin, Doina Bein, and Abhishek Verma. "Novel deep learning model with CNN and bi-directional LSTM for improved stock market index prediction." In 2019 IEEE 9th annual computing and communication workshop and conference (CCWC), pp. 0264-0270. IEEE, 2019.
- Feng, Zexu. "Research on the S&P 500 Index Based on LSTM and GRU." Highlights in Business, Economics and Management 21 (2023): 38-48.
- Song, Hyunsun, and Hyunjun Choi. "Forecasting stock market indices using the recurrent neural network based hybrid models: CNN-LSTM, GRU-CNN, and ensemble models." Applied Sciences 13, no. 7 (2023): 4644.
- Althelaya, Khaled A., El-Sayed M. El-Alfy, and Salahadin Mohammed. "Stock market forecast using multivariate analysis with bidirectional and stacked (LSTM, GRU)." In 2018 21st Saudi Computer Society National Computer Conference (NCC), pp. 1-7. IEEE, 2018.
- Eapen, Jithin, Abhishek Verma, and Doina Bein. "Improved big data stock index prediction using deep learning with CNN and GRU." International Journal of Big Data Intelligence 7, no. 4 (2020): 202-210.
- Qi, Chenyang, Jiaying Ren, and Jin Su. "GRU neural network based on CEEMDAN–wavelet for stock price prediction." Applied Sciences 13, no. 12 (2023): 7104.
- Sethia, Akhil, and Purva Raut. "Application of LSTM, GRU and ICA for stock price prediction." In Information and Communication Technology for Intelligent Systems: Proceedings of ICTIS 2018, Volume 2, pp. 479-487. Springer Singapore, 2019.
- Munkhdalai, Lkhagvadorj, Meijing Li, Nipon Theera-Umpon, Sansanee Auephanwiriyakul, and Keun Ho Ryu. "VAR-GRU: A hybrid model for multivariate financial time series prediction." In Asian Conference on Intelligent Information and Database Systems, pp. 322-332. Cham: Springer International Publishing, 2020.
- Oreshkin, B. N., Dudek, G., Pełka, P., & Turkina, E. (2021). N-BEATS neural network for mid-term electricity load forecasting. Applied Energy, 293, 116918.
- Sbrana, A., Rossi, A. L. D., & Naldi, M. C. (2020, December). N-BEATS-RNN: Deep learning for time series forecasting. In 2020 19th IEEE International Conference on Machine Learning and Applications (ICMLA) (pp. 765-768). IEEE.
- Puszkarski, B., Hryniów, K., & Sarwas, G. (2021, September). N-beats for heart dysfunction classification. In 2021 Computing in Cardiology (CinC) (Vol. 48, pp. 1-4). IEEE.
- Wang, X., Li, C., Yi, C., Xu, X., Wang, J., & Zhang, Y. (2022). EcoForecast: An interpretable data-driven approach for short-term macroeconomic forecasting using N-BEATS neural network. Engineering Applications of Artificial Intelligence, 114, 105072.
- Hyndman, Rob J. "The interaction between trend and seasonality." International Journal of Forecasting 20, no. 4 (2004): 561-563.
- Pezzulli, S., D. B. Stephenson, and A. Hannachi. "The variability of seasonality." Journal of Climate 18, no. 1 (2005): 71-88.
- Koopman, Siem Jan, and Kai Ming Lee. "Seasonality with trend and cycle interactions in unobserved components models." Journal of the Royal Statistical Society Series C: Applied Statistics 58, no. 4 (2009): 427-448.
- Verbesselt, Jan, Rob Hyndman, Glenn Newnham, and Darius Culvenor. "Detecting trend and seasonal changes in satellite image time series." Remote sensing of Environment 114, no. 1 (2010): 106-115.
- Di, Xinjie. "Stock trend prediction with technical indicators using SVM." Independent Work Report, Standford: Leland Stanford Junior University, USA (2014).
- Fang, Jiali, Yafeng Qin, and Ben Jacobsen. "Technical market indicators: An overview." Journal of behavioral and experimental finance 4 (2014): 25-56.
- Chen, Chien-Ming, Yuxiao Gong, and Jimmy Ming-Tai Wu. "Impact of technical indicators and leading indicators on stock trends on the internet of things." Wireless Communications and Mobile Computing 2022, no. 1 (2022): 9916310.
- Peachavanish, Ratchata. "Stock selection and trading based on cluster analysis of trend and momentum indicators." In Proceedings of the international multiconference of engineers and computer scientists, vol. 1, pp. 317-321. IMECS, 2016.
- Blau, William. Momentum, direction, and divergence. Vol. 5. John Wiley & Sons, 1995.
- Lewellen, Jonathan. "Momentum and autocorrelation in stock returns." The Review of Financial Studies 15, no. 2 (2002): 533-564.
- Chun, Dohyun, Hoon Cho, and Doojin Ryu. "Economic indicators and stock market volatility in an emerging economy." Economic Systems 44, no. 2 (2020): 100788.
- Schwert, G. William. "Stock volatility during the recent financial crisis." European Financial Management 17, no. 5 (2011): 789-805.
- Otchere, Daniel Asante, Tarek Omar Arbi Ganat, Jude Oghenerurie Ojero, Bennet Nii Tackie-Otoo, and Mohamed Yassir Taki. "Application of gradient boosting regression model for the evaluation of feature selection techniques in improving reservoir characterisation predictions." Journal of Petroleum Science and Engineering 208 (2022): 109244.
- Bai, Ting, Deren Li, Kaimin Sun, Yepei Chen, and Wenzhuo Li. "Cloud detection for high-resolution satellite imagery using machine learning and multi-feature fusion." Remote Sensing 8, no. 9 (2016): 715.
- Meng, Tong, Xuyang Jing, Zheng Yan, and Witold Pedrycz. "A survey on machine learning for data fusion." Information Fusion 57 (2020): 115-129.
- He, Kaiming, Xiangyu Zhang, Shaoqing Ren, and Jian Sun. "Deep residual learning for image recognition." In Proceedings of the IEEE conference on computer vision and pattern recognition, pp. 770-778. 2016.
- Shafiq, Muhammad, and Zhaoquan Gu. "Deep residual learning for image recognition: A survey." Applied Sciences 12, no. 18 (2022): 8972.
- Sill, Joseph, Gábor Takács, Lester Mackey, and David Lin. "Feature-weighted linear stacking." arXiv preprint arXiv:0911.0460 (2009).
- Coscrato, Victor, Marco Henrique de Almeida Inacio, and Rafael Izbicki. "The NN-Stacking: Feature weighted linear stacking through neural networks." Neurocomputing 399 (2020): 141-152.
- Guo, Fusen, Huadong Mo, Jianzhang Wu, Lei Pan, Hailing Zhou, Zhibo Zhang, Lin Li, and Fengling Huang. "A Hybrid Stacking Model for Enhanced Short-Term Load Forecasting." Electronics 13, no. 14 (2024): 2719.
- Kardani, Navid, Annan Zhou, Majidreza Nazem, and Shui-Long Shen. "Improved prediction of slope stability using a hybrid stacking ensemble method based on finite element analysis and field data." Journal of Rock Mechanics and Geotechnical Engineering 13, no. 1 (2021): 188-201.
- Chung, Junyoung, Caglar Gulcehre, KyungHyun Cho, and Yoshua Bengio. "Empirical evaluation of gated recurrent neural networks on sequence modeling." arXiv preprint arXiv:1412.3555 (2014).
- Yu, Yong, Xiaosheng Si, Changhua Hu, and Jianxun Zhang. "A review of recurrent neural networks: LSTM cells and network architectures." Neural computation 31, no. 7 (2019): 1235-1270.
- Cahuantzi, Roberto, Xinye Chen, and Stefan Güttel. "A comparison of LSTM and GRU networks for learning symbolic sequences." In Science and Information Conference, pp. 771-785. Cham: Springer Nature Switzerland, 2023.
- Yiğit, Gülsüm, and Mehmet Fatih Amasyali. "Simple but effective GRU variants." In 2021 international conference on
- Gao, Shuai, Yuefei Huang, Shuo Zhang, Jingcheng Han, Guangqian Wang, Meixin Zhang, and Qingsheng Lin. "Short-term runoff prediction with GRU and LSTM networks without requiring time step optimization during sample generation." Journal of Hydrology 589 (2020): 125188.
- Choe, Do-Eun, Hyoung-Chul Kim, and Moo-Hyun Kim. "Sequence-based modeling of deep learning with LSTM and GRU networks for structural damage detection of floating offshore wind turbine blades." Renewable Energy 174 (2021): 218-235.
- Zhang, Yue, Zimo Zhou, Jesse Van Griensven Thé, Simon X. Yang, and Bahram Gharabaghi. "Flood Forecasting Using Hybrid LSTM and GRU Models with Lag Time Preprocessing." Water 15, no. 22 (2023): 3982.
- Hassanian, Reza, Ásdís Helgadóttir, and Morris Riedel. "Deep learning forecasts a strained turbulent flow velocity field in temporal lagrangian framework: Comparison of LSTM and GRU." Fluids 7, no. 11 (2022): 344.
- Shewalkar, Apeksha, Deepika Nyavanandi, and Simone A. Ludwig. "Performance evaluation of deep neural networks applied to speech recognition: RNN, LSTM and GRU." Journal of Artificial Intelligence and Soft Computing Research 9, no. 4 (2019): 235-245.
- Yamak, Peter T., Li Yujian, and Pius K. Gadosey. "A comparison between arima, lstm, and gru for time series forecasting." In Proceedings of the 2019 2nd international conference on algorithms, computing and artificial intelligence, pp. 49-55. 2019.
- Gao, Ya, Rong Wang, and Enmin Zhou. "Stock prediction based on optimized LSTM and GRU models." Scientific Programming 2021, no. 1 (2021): 4055281.
