Time-varying Comb Filters to Improve Speech Perception in Sensorineural Hearing Loss Subjects

Author: Aparna Chilakawad, Pandurangarao N. Kulkarni
Journal: International Journal of Image, Graphics and Signal Processing @ijigsp
Article in issue: 2 vol.16, 2024.
Free access
In the case of Sensorineural Hearing Loss (SNHL) persons speech perception diminishes in a noisy environment because of masking. The present work aims mainly at improving speech perception in sensorineural hearing-impaired subjects, as there is no known medical treatment for this condition. Speech perception can be improved by reducing the impact of masking. This is accomplished by splitting the speech signal into two parts for binaural dichotic presentation using time-varying comb filters having complementary magnitude responses. Using the frequency sampling method time-varying comb (FIR) filters with magnitude responses complementary to each other with 512 order are designed to split the speech signal for dichotic presentation. For the purpose of designing filters, 22 kHz sampling frequency and twenty-two one-third octave bands spanning from 0 to 11 kHz are taken into consideration. Magnitude responses of filters are continuously swept with a time shift less than just noticeable difference (JND) so that capacity to detect gaps in speech signal enhances without negating the benefits of the spectral splitting technique. Filter functioning is evaluated by using objective and subjective measures. Using Perceptual Evaluation of Speech Quality (PESQ) and spectrographic analysis an objective evaluation is made. The subjective measure is done using Mean Opinion Score (MOS) for quality of speech. MOS test is examined on normal hearing subjects by adding white noise to study materials at different SNR levels. For the evaluation of intelligibility of speech Modified Rhyme Test (MRT) is considered and evaluated on normal hearing subjects as well as bilateral moderate SNHL persons by adding white noise to study materials at different SNR levels. Study materials used for the evaluation of quality are VC syllable /aa-b/ & vowel /aa/. 300 monosyllabic words of consonant-vowel-consonant (CVC) are used as study materials for the evaluation of speech intelligibility. The outcomes showed an improvement in PESQ values and MOS test scores for lower SNR values comparing unprocessed speech with processed speech and also an improvement in the intelligibility of processed speech in a noisy atmosphere for both types of subjects. Thus there is an enhancement in speech perception of processed speech in a noisy environment.
Time-varying comb filter, Sensorineural Hearing Loss, Masking, Speech quality, Modified Rhyme Test ( MRT)
Short address: https://sciup.org/15019443
IDR: 15019443 | DOI: 10.5815/ijigsp.2024.02.05
Text of the scientific article Time-varying Comb Filters to Improve Speech Perception in Sensorineural Hearing Loss Subjects
Sensorineural hearing deafness occurs due to the widening of audial filters of the cochlea leading to the masking of frequency components of neighboring audial filter bands. This results in reduced speech perception [1]. Due to this frequency resolution capacity of the sensory system reduces and makes speech perception tough in the presence of noise [2]. Many investigations [3, 4] showed that splitting speech into two complementary spectra for binaural dichotic presentation using comb filters pair was helpful in reducing the effect of frequency masking. However, due to increased temporal masking for people with sensorineural hearing loss (SNHL), a scheme of spectral splitting of speech signal was used to lessen the effect of masking, for persons with SNHL by means of time-varying comb filters [5].
Even though the earlier techniques were found helpful in overcoming the effects of frequency masking, the capacity to detect gaps gets affected due to step change in the magnitude responses with a fixed number of distinct time shifts. In order to overcome this problem, the present work proposed time-varying comb filters with continuous sweep in magnitude responses with time shifts selected less than just noticeable difference (JND), so that gap detection capacity is improved without compromising the benefits of the spectral splitting technique.
The objective of this paper is to improve speech perception in SNHL persons by reducing masking. This is accomplished by splitting speech into two complementary spectra for binaural dichotic presentation using twenty two one-third octave bands of time-varying comb (FIR) filters pair. Evaluation of the effectiveness of the technique in improving speech perception was done using subjective measurements MRT for intelligibility and MOS for quality, and objective assessments using PESQ and spectrographic analysis. An attempt to design 22 bands of time-varying comb (FIR) filters that sweep continuously in magnitude responses using MATLAB programming language has been proposed to reduce frequency masking and to improve the capacity to detect gaps in a speech signal, which in turn improves speech perception.
2. Literature Survey
To increase speech intelligibility, the frequency and temporal maskings for SNHL listeners were decreased using a pair of time-varying comb filters with complementary magnitude responses for binaural dichotic presentation[5].Filters had a set of pre-calculated 256 coefficients to divide the speech signal spectrum. A 20ms time period for cyclically swept magnitude responses was taken into consideration. The evaluation was done with different sets of filters (16, 8, 4, 2 sets) by using VCV (vowel consonant vowel) syllables. With 4 shiftings improvement in recognition was 13.9% at SNR -6 dB and concluded that different sets of filters were useful in improving speech recognition in SNHL subjects.
The main objective of the paper [6] was to optimize the design of various types of FIR comb filters with complementary magnitude responses for splitting the speech signal into parts with frequency components complementary to each other to present these signals to left and right ears. A sampling frequency of 10 kHz was considered for designing filters. The filters’ performance was evaluated on normal hearing subjects by using vowels and a sentence. On the perceived loudness scale intensity was 5 for both left and right channels in the case of one-third of octal and auditory critical band filters and concluded that the performance (with respect to perceived relative loudness) of the constant bandwidth filter was less than that of one-third of octal and auditory critical band filters.
The purpose of the paper [7] was to help SNHL persons in their better understanding of speech. The methodology used was to divide the speech spectrum using the FIR filter bank summation approach and followed by a frequency compression strategy (compression factor of 0.4 to 1). For the designing of the filter sampling frequency of 10 kHz and 18 ACB from 0 to 5 kHz were considered. For the evaluation of method test materials /a/ the vowel, VCV syllable /asha/, and the sentence “we were away a year ago” were used. PESQ (Perceptual Evaluation of Speech Quality) [8] values of processed test materials were 1.4234, 1.4327, and 1.4429 respectively for compression factor 0.4 at SNR -6 dB. The performance of the algorithm was tested on normal hearing subjects using MOS test and concluded that in a noisy environment algorithm worked better.
In the paper [9] splitting the speech using time-varying comb filters with cyclically swept complementary magnitude response was discussed. The objective of [9] was to optimize the sweep cycle of time-varying comb FIR filters to improve perception in SNHL persons. On normal hearing subjects, experiments were conducted by means of filters with different sweep cycles with 8-16 shiftings. Test materials used for the evaluation were linearly swept sine wave from 100 Hz to 5000 Hz and running speech. An echo was heard with the 100 ms sweep cycle. A sweep cycle of 50 ms with 16 shiftings improved speech perception was observed in normal hearing subjects.
To reduce the computational challenges significantly and to increase the quality of speech in multichannel digital hearing aid the sub-band noise reduction technique was proposed [10]. For the analysis and synthesis of a speech signal 6-order IIR filter banks with 16 bands were used. In the algorithm, the noise was computed in each band iteratively. 50 test materials were used for the evaluation of the algorithm. Researchers compared the proposed technique to adaptive Wiener filtering, spectral subtraction, and modulation frequency-based algorithms. It was concluded that improvement in perceptual evaluation of speech quality (PESQ) was 0.94 at SNR 5dB and 0.59 at SNR 10 dB respectively. However, a noisy environment was not considered to evaluate the method.
Using temporal splitting, spectral splitting and combined splitting processing methods [11] speech signal was split into two complementary spectra for binaural dichotic presentation. With inter-aural switching periods of 20, 40, and 80 ms, temporal splitting was accomplished. Spectral splitting was achieved with perceptually balanced comb filters. Combined splitting was accomplished with time-varying comb filters with 20, 40, and 80 ms, cyclically swept magnitude responses with 4, 8, and 16 shiftings, and also with an adjustable gain filter binaural filtering was done. For speech recognition, phonetically balanced monosyllables were used as test materials. With combined splitting a person with severe hearing loss recognition scores of unprocessed and processed speech were 21% and 50% respectively. Found that in persons with moderate to severe SNHL, and normal hearing speech perception was improved.
For binaural dichotic presentation, the speech spectrum was split to improve speech perception for bilateral SNHL persons. To split the speech eighteen fixed bandwidth and ACB comb filters having complementary magnitude responses were designed and also evaluated the sound localization [12]. The subjective evaluations were performed on persons with normal hearing as well as on persons with moderate bilateral sensorineural hearing loss with different SNRs. There was an improvement in speech recognition score (14-31%) on hearing loss subjects using auditory critical bandwidth FIR comb filter and there was no major effect on the localization of the source of a sound. It was inferred that in binaural hearing aid dichotic presentation might be useful.
A supervised sparse coding strategy was proposed in the paper [13] to decrease the noise in speech for the hearing aid, and it was carried out in the time domain. By comparing the algorithm with noise reduction algorithms (Wiener filtering and spectral substation), it was assessed. By objective (PESQ) and subjective (for intelligibility) tests evaluation was done. The materials used for the testing were BKB (Bamford-Kowal-Bench) sentences. The value of PESQ was nearly 2.5 at 10dB SNR. Wiener filtering was best for speech intelligibility with an SNR of -5dB.
The paper [14] was about the designing of comb filters having perceptually balanced complementary magnitude responses to split speech signal spectrally for binaural dichotic presentation to improve speech perception for persons with moderate bilateral sensorineural hearing loss. The objective was to explore the relationship between the amplitudes of two signals in the binaural presentation which would evoke the same loudness as the monaural presentation. Subjective evaluation was done by using modified rhyme test (MRT). Listening tests were carried out by using pure tones of different frequencies on normal and bilateral SNHL subjects. At SNR 12dB recognition score was 75%. Concluded that to improve speech perception the sum of the two amplitude scaling factors should be approximately constant.
A tool called hearing loss simulation was employed in the paper [15] for studies on hearing. To evaluate the algorithm speech intelligibility index (SII) for objective measures and MRT for subjective measures were used and the algorithm was tested on 12 hearing loss subjects and 36 normal hearing subjects. Study materials for intelligibility were recorded in an acoustically treated studio. Words were spoken by a male and a female and were recorded at a sampling frequency of 48 kHz with 16-bit resolution. At -3 dB SNR pre-MRT and post-MRT scores were 50.86 and 49.90 respectively, and concluded that for further investigation more subjects could be considered and other intelligibility measures could be used for the testing of the tool.
The frequency sampling method was used in the paper [16] to design FIR filters with the critical bands. The speech signal was split into complementary frequency components for dichotic presentation. Filters were designed using the FDA (Filter design and analysis) tool provided in MATLAB. The design was varied depending on the audiogram of subjects and evaluation of the filter’s performance was tested on seven hearing loss subjects by using vowel consonant vowel (VCV) syllables. It was deduced that processed VCV signals showed an improvement in the intelligibility of speech compared to unprocessed ones.
The objective of [17] was to increase speech perception for persons with SNHL using a multiband frequency compression technique. In this technique spectrum of speech was divided into a number of analysis bands. Frequencies of these bands were compressed towards the center with a compression factor. The technique was investigated with different types of frequency mapping bandwidth and segmentation for processing. To check the performance of the scheme listening test were carried out on normal hearing subjects for both speech quality and intelligibility. Study materials used for speech quality were sustained vowels and the sentence “we were away a year ago”. For speech intelligibility 300 monosyllabic words of consonant-vowel-consonant (CVC) were used as test materials. The result showed MOS scores were best for constant bandwidth based frequency compression and an improvement in recognition score (17%) at lower SNR values.
To minimize the effect of increased intra-speech spectral masking associated with SNHL, the multiband frequency compression technique was used, and also optimization of the compression factor was considered [18]. For speech intelligibility 300 consonant-vowel-consonant (CVC) monosyllabic words were used as test materials. Listening tests were conducted on moderate to severe SNHL subjects. Results showed maximum improvement in speech perception with the compression factor of 0.6 (an improvement of 9-12% recognition scores and a reduction in response time of 0.89 sec.).
In the paper [19] to improve speech perception for persons with SNHL (use monaural aid) cascaded structure of Weiner filter and multiband compression scheme was used. In a multiband compression scheme, the speech signal was divided into 18 bands of frequency from 0 to 5 kHz with critical bandwidth and a frequency segment mapping method was used to compress each band with respect to frequency components. The scheme was evaluated for speech quality using PESQ and MOS on normal hearing subjects and intelligibility using MRT on SNHL persons. Results indicated that at SNR value -6dB and compression factor 0.4 significant improvements in speech quality and 30.134% intelligibility.
From the review of the literature, it is observed that to improve speech perception in SNHL subjects, scheme of splitting of speech spectrally is useful for binaural dichotic presentation, and the evaluation of the scheme can be assessed using PESQ, MOS measures for quality of signal and MRT for intelligibility. In the current work scheme of splitting of speech spectrally by using time-varying comb filters with complementary magnitude responses swept continuously less than JND to improve speech perception is proposed.
3. Methodology and Designing
In frequency masking, spectral components in neighboring bands of the cochlea are likely to mask each other. In order to reduce masking odd bands are presented to left ear and even bands are presented to right ear. To present speech signal dichotically (to the left and right ears) with complementary spectral components a pair of time-varying comb (FIR) filters of order 512 with complementary magnitude responses are used. A comb filter is a filter with multiple pass bands and stop bands giving the appearance of an ordinary comb and has a static magnitude response and is given by Eq.1.
1Ш)1 = ^2(1-cos(^)
In a time-varying comb filter, the magnitude response |H m( f)| and impulse response h m (n) are not static and therefore are functions of time ‘m’. The proposed method splits the speech into two signals with complementary spectra for binaural dichotic presentation using time-varying comb filters pair with magnitude responses swept along the frequency axis with respect to time.
The block diagram of methodology of proposed work is depicted in Fig.1. A pair of time-varying comb (FIR) filters of order 512 with complementary magnitude responses are used to split the speech signal into two parts with complementary spectral components so that it can be presented dichotically (to the left and right ears). Filters are designed by using the frequency sampling method [20], and implemented using MATLAB programming language. Each filter has 11 pass-bands and 11 stop-bands based on 1/3 octave bands. Due to more robust to noise 1/3 octave bands are considered for the designing of filters [21] and are listed in Table 1. 22 kHz sampling frequency is considered to have a better quality of speech. The frequency sampling method is used to have less frequency distortion. To reduce the deviation in perceived loudness crossover gain is maintained between -6 dB and -6.5 dB for bands with higher frequencies and is between -4 dB and -7 dB for lower band frequencies. For higher frequencies, the transition bandwidth is kept between 70 and 80 Hz. Pass-band ripple is kept at less than 1dB. Fig. 2 shows the complementary magnitude responses of a pair of time-varying comb filters at various points of time. Time-varying comb filters are designed to exhibit a continuous sweep in magnitude responses along the frequency axis with a time shift less than JND.
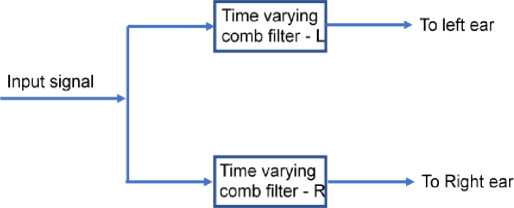
Fig. 1. Signal processing with a pair of time-varying comb filters.
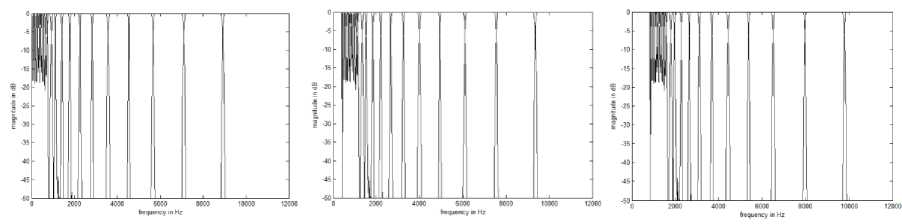
Fig. 2. A pair of time-varying comb (FIR) filters’ superimposed complementary magnitude responses at various points of time.
Table 1. One third octave Bands.
|
Bands |
Lower frequency (Hz) |
Higher frequency (Hz) |
|
1 |
70.8 |
89.1 |
|
2 |
89.1 |
112 |
|
3 |
112 |
141 |
|
4 |
141 |
178 |
|
5 |
178 |
224 |
|
6 |
224 |
282 |
|
7 |
282 |
355 |
|
8 |
355 |
447 |
|
9 |
447 |
562 |
|
10 |
562 |
708 |
|
11 |
708 |
891 |
|
12 |
891 |
1122 |
|
13 |
1122 |
1413 |
|
14 |
1413 |
1778 |
|
15 |
1778 |
2239 |
|
16 |
2239 |
2818 |
|
17 |
2818 |
3548 |
|
18 |
3548 |
4467 |
|
19 |
4467 |
5623 |
|
20 |
5623 |
7079 |
|
21 |
7079 |
8913 |
|
22 |
8913 |
11000 |
4. Results and Discussion
Using a pair of time-varying comb (FIR) filters with a continuous sweep of magnitude responses (time shift less than JND) a speech signal is spectrally split in such a way that these signals have complementary spectral components. The scheme is assessed for speech quality using PESQ, spectrographic analysis, MOS, and for intelligibility using MRT.
-
4.1. Speech Quality
-
4.1.1. PESQ and spectrographic analysis
-
Perceptual Evaluation of Speech Quality (PESQ) is an International Telecommunication Union standard (ITU-T P.862) for the assessment of speech quality [22]. The algorithm is based on the imitation of the human sensory system to produce PESQ scores.
Fig. 3 shows the PESQ model to test the quality of speech using the PESQ algorithm. The PESQ algorithm runs with a reference signal which is an unprocessed signal and a test signal (processed) as inputs to calculate the perceptual quality of the processed signal.
Study materials used for the evaluation of quality are VC syllable /aa-b/, and vowel /aa/. Table 2 and Table 3 show the PESQ values (unprocessed, processed) of /aa-b/ and /aa/ signals at different SNRs respectively. These values are obtained by using the PESQ algorithm which uses both unprocessed (reference signal) and processed signal (test signal) to calculate PESQ values. On comparing PESQ values of processed with unprocessed signals improvement is observed in processed signals at lower SNRs.
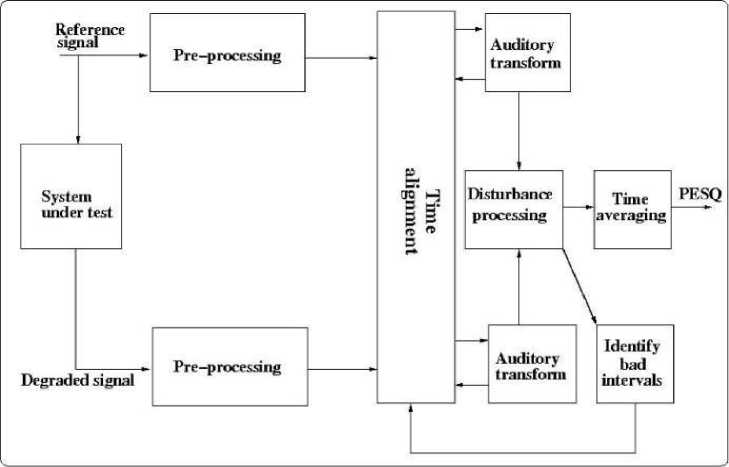
Fig. 3. PESQ model [24].
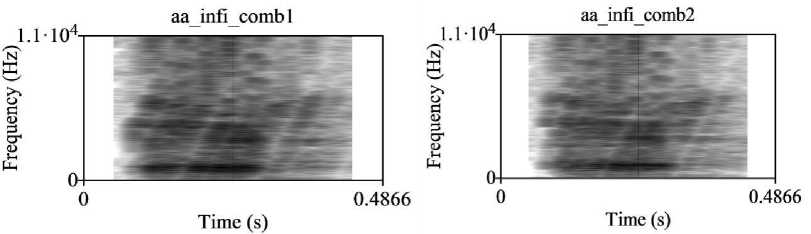
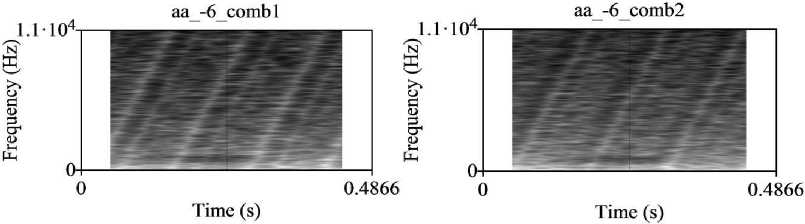
At SNR infinity improvement in PESQ value is -1.1406 for the test materials /aa-b/ and -0.445 for /aa/.Improvement in PESQ values for /aa-b/ for SNR values ranging 6dB to -6dB in increments of 3dB are 1.6717, 1.7028, 1.7203, 1.8405, and 1.8932, respectively, and for vowel /aa/ are 0.6108, 0.8643, 1.2127, 1.2821, and 1.3556, respectively. Improvements in PESQ values are seen to be more significant at lower SNR levels.Fig.4 is the narrow band spectrogram of the unprocessed vowel /aa/ signal and Fig.5 is the corresponding narrowband spectrograms of the processed signal (a) for left (b) for right ears at SNR value of infinity. Fig.6 is spectrograms of processed signal /aa/ at SNR -6dB (a) for left (b) for right ears. It is observed that harmonic structure is maintained and the quality of speech is improved by reducing masking in all the processed signals’ spectrograms. These conclusions are conformity with PESQ values and MOS scores
The total energy of an unprocessed signal is distributed between dichotic signals. When these dichotic signals are presented to left and right ears, get added in the higher level of the sensory system.
Table 2. PESQ scores for VC syllable /aa-b/.
|
SNR values in dB |
PESQ values for /aa-b/ signal |
||
|
Unprocessed |
Processed |
Improvement |
|
|
∞ |
4.5 |
3.3594 |
-1.1406 |
|
6 |
2.0573 |
3.729 |
1.6717 |
|
3 |
2.0694 |
3.7722 |
1.7028 |
|
0 |
2.0055 |
3.7258 |
1.7203 |
|
-3 |
1.9839 |
3.8244 |
1.8405 |
|
-6 |
1.9129 |
3.8061 |
1.8932 |
Table 3. PESQ scores for vowel /aa/.
|
SNR values in dB |
PESQ values for /aa/signal |
||
|
Unprocessed |
Processed |
Improvement |
|
|
∞ |
4.5 |
4.055 |
-0.445 |
|
6 |
2.9275 |
3.5383 |
0.6108 |
|
3 |
2.8599 |
3.7242 |
0.8643 |
|
0 |
2.7268 |
3.9395 |
1.2127 |
|
-3 |
2.6267 |
3.9088 |
1.2821 |
|
-6 |
2.4713 |
3.8269 |
1.3556 |
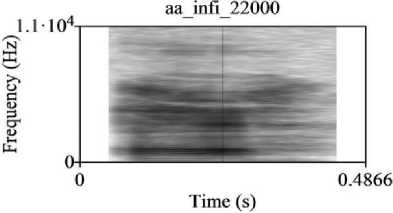
Fig. 4. Unprocessed /aa/ vowel.
(a)
(b)
Fig. 5. Processed /aa/ signal at SNR ∞ dB for left and right ears.
(a)
(b)
Fig. 6. Processed /aa/ signal at SNR -6 dB for left and right ears.
-
4.1.2. Mean opinion score (MOS)
Using the mean score opinion measure for speech quality, a subjective evaluation is performed on normal hearing persons (two males, four females 18 to 45 years old). Initially, subjects were trained with the method of evaluation and were asked to provide their opinion based on the quality of unprocessed and processed materials for different SNR levels. The opinion scale for the quality of the material is shown in Table 4. Table 5 and Table 6 list the MOS assessment for the test signals /aa-b/ and /aa/, respectively. In Table 5 and Table 6 first column shows different subjects with age and sex. Successive columns show their opinion based on the quality of unprocessed and processed materials for different (infinity, 6, 3, 0,-3,-6dB) SNR levels. MOS values are obtained by taking the mean of opinion scores. On comparing the MOS of unprocessed with proceeded signals improvement is observed in processed test material at lower SNR.
An improvement in MOS scores for processed VC signal /aa-b/ is -1.17, 1.47, 1.92, 2.30, 2.35, 2.68 for SNR ∞, 6 to -6 in steps of 3dB respectively. Similarly, on the same subjects speech quality was tested for vowel /aa/ using MOS, and improvement in scores obtained for processed are -1.08, 1.83, 2.00, 2.17, 2.25, 2.33 for SNR ∞, 6 to -6 in steps of 3dB respectively. Compared to a noise-free signal, MOS scores are higher for a stimulated noisy signal for both test signals.
Table 4. Opinion Scale for quality [24].
|
Speech Quality |
Scale |
|
Bad |
1 |
|
Poor |
2 |
|
Fair |
3 |
|
Good |
4 |
|
Excellent |
5 |
|
Subjects with sex, age |
SNR in dB |
|||||||||||
|
∞ |
6 |
3 |
0 |
-3 |
-6 |
|||||||
|
1Unpr |
2Pro |
Unpr |
Pro |
Unpr |
Pro |
Unpr |
Pro |
Unpr |
Pro |
Unpr |
Pro |
|
|
S1, [F,22] |
4.5 |
3 |
2 |
3 |
1.5 |
3 |
1 |
3.5 |
1 |
3.5 |
1 |
3.8 |
|
S2, [M,25] |
4 |
2.5 |
2 |
3.5 |
1 |
3 |
1 |
3 |
1 |
3 |
1 |
3 |
|
S3, [F,21] |
4 |
3 |
2.5 |
3.5 |
1 |
3.5 |
1 |
3.5 |
1 |
3.5 |
0.5 |
3 |
|
S4, [F,39] |
4 |
2.5 |
2 |
3.8 |
1.5 |
3.5 |
1.5 |
3.5 |
1.5 |
3.8 |
1 |
3.5 |
|
S5, [F,45] |
4 |
3.5 |
1 |
3.5 |
1 |
3 |
1 |
3.5 |
1 |
3.5 |
0.5 |
3.8 |
|
S6, [M,18] |
4 |
3 |
2 |
3 |
1.5 |
3 |
1.5 |
3.8 |
1.5 |
3.8 |
0.5 |
3.5 |
|
MOS |
4.08 |
2.92 |
1.92 |
3.38 |
1.25 |
3.17 |
1.17 |
3.47 |
1.17 |
3.52 |
0.75 |
3.43 |
|
Improvement |
-1.17 |
1.47 |
1.92 |
2.30 |
2.35 |
2.68 |
||||||
1Unpr: Unprocessed speech, 2Pro: Processed speech.
|
Subjects with sex, age |
SNR in dB |
|||||||||||
|
∞ |
6 |
3 |
0 |
-3 |
-6 |
|||||||
|
Unpr |
Pro |
Unpr |
Pro |
Unpr |
Pro |
Unpr |
Pro |
Unpr |
Pro |
Unpr |
Pro |
|
|
S1, [F,22] |
4 |
3 |
2 |
3.5 |
2 |
3.5 |
1.5 |
3.5 |
1 |
3.5 |
1 |
3.5 |
|
S2, [M,25] |
4 |
2.5 |
1 |
3.5 |
1 |
3.5 |
1 |
3 |
1 |
3.5 |
0.5 |
2.5 |
|
S3, [F,21] |
4 |
3 |
2 |
3 |
2 |
3 |
1.5 |
3.5 |
1.5 |
3 |
1 |
3 |
|
S4, [F,39] |
4 |
3 |
1.5 |
3.5 |
1 |
3.5 |
1 |
3.5 |
1 |
3.5 |
0.5 |
3 |
|
S5, [F,45] |
4 |
3 |
1.5 |
3.5 |
1.5 |
3.5 |
1.5 |
3.5 |
1 |
3 |
1 |
3 |
|
S6, [M,18] |
4.5 |
3.5 |
1 |
3 |
1 |
3.5 |
1 |
3.5 |
1 |
3.5 |
0.5 |
3.5 |
|
MOS |
4.08 |
3.00 |
1.50 |
3.33 |
1.42 |
3.42 |
1.25 |
3.42 |
1.08 |
3.33 |
0.75 |
3.08 |
|
Improvement |
-1.08 |
1.83 |
2.00 |
2.17 |
2.25 |
2.33 |
||||||
-
4.2. Speech intelligibility
To measure speech intelligibility the Modified Rhyme Test (MRT) is used. The study material in MRT consisted of 300 monosyllabic words of consonant-vowel-consonant (CVC). Each of the words starts with the phrase “would you write”. In an audiometry room, all the sentences of the test materials were spoken by a male and recorded at 10 k samples/s with 16-bit quantization using B&K microphone model No. 2210.
All the 300 CVC words were grouped into 6 test lists of 50 words each. The words in each test list were selected by a two level randomization process (1x, 1y, 2x, 2y, 3x, 3y here number represents the set level and x, y represent the word level within each set).
An automated administration test arrangement was used for the conduction of the test. Initially, subjects were instructed on the testing procedure and stimuli. Once subjects became familiar with the testing procedure, they were asked to respond to the CVC words.
Tests of listening were conducted on both normal hearing and bilateral moderate SNHL subjects (each six in number) to measure intelligibility.
First, six normal hearing subjects (2 females and 4 males aged between 21 to 42 years) were considered for the speech intelligibility test. Each subject responded to 1800 words (300 words × 6 levels of SNR). The speech level was tuned to a comfortable level. 300 MRT words were loaded and created a random file in the MRT test window. Asked each subject to sit in front of the computer screen ‘play’ button was clicked on the test window .The subject heard the presentation and responded by selecting the best match out of six responses displayed on the test window. Speech recognition score (in %) and response time (sec) were recorded in a random file. This process was repeated for all MRT words by changing the level (1x, 1y, 2x, 2y, 3x, 3y) and also for different SNRs. The test was conducted approximately for one month depending on the availability and willingness of the subjects.
Table 7 shows the results of listening tests of subjects with MRT materials and, gives the average speech recognition score (in %) of the unprocessed and the processed speech at various SNR levels. On comparing the unprocessed recognition scores with the processed recognition scores at SNR values (∞ dB,6 dB to +6dB in steps of 3dB) it is observed an improvement in average recognition scores of processed speech is -1.38%, 16.11%, 19.33%, 21.38%, 23.11% and 25.72% respectively. Table 8 represents the average response times of the same subjects for above defined SNR values, it is observed that reduction in average response times of processed speech.
Secondly, six bilateral moderate SNHL subjects (3 males and 3 females aged between 30 to 49 years) were considered for the speech intelligibility test. Table 9 shows the audiometric threshold for the subjects with bilateral moderate SNHL.
In this experiment also each bilateral SNHL subject responded to 1800 words (300 words × 6 levels of SNR).
Table 10 shows the results of the listening tests of subjects with MRT material and the results show the average speech recognition score ( in %) of the unprocessed and the processed speech with various SNR levels. On comparing unprocessed recognition scores with processed recognition scores at various SNR values ( ∞ dB,6 dB to +6dB in steps of 3dB) it is noticed that an improvement in average recognition scores of processed speech is -0.44%,17.06%,22.44%,24.83%,26.11% and 28.61% respectively.
Table 11 represents the average response times of the same six bilateral SNHL subjects for above defined SNR values, it is observed that reduction in average response times of processed speech.
The results of normal hearing and bilateral SNHL subjects, using MRT notify improved speech recognition score and reduced response time at lower SNR. Hence there is an improvement in speech perception in a noisy environment.
The reliability of results can be enhanced by testing on more number to subjects and test materials and can also be assessed by statistical means like ANOVA (Analysis of Variance) test.
Table 7. Speech Recognition Scores in percentage for normal hearing subjects.
|
Subjects Sex & Age |
SNR (dB) |
|||||||||||
|
∞ dB |
6 dB |
3 dB |
0 dB |
-3 dB |
-6 dB |
|||||||
|
Unpr |
Pro |
Unpr |
Pro |
Unpr |
Pro |
Unpr |
Pro |
Unpr |
Pro |
Unpr |
Pro |
|
|
S1[M,42] |
92.33 |
92 |
66.33 |
77.66 |
58.66 |
76.33 |
54.66 |
78.00 |
47.66 |
66.00 |
43.33 |
70.67 |
|
S2[M,40] |
92 |
90.66 |
65 |
76 |
58.66 |
78.33 |
53.66 |
75.00 |
48.33 |
77.67 |
44.33 |
71.00 |
|
S3[M,35] |
94.33 |
94 |
66 |
78 |
59.66 |
80.33 |
56.33 |
78.00 |
48.33 |
72.00 |
46 |
70.67 |
|
S4[F,21] |
93.66 |
93 |
66.33 |
79.66 |
59.66 |
78.00 |
56.66 |
77.33 |
48.33 |
70.33 |
46 |
71.67 |
|
S5[F,28] |
92 |
86.33 |
66 |
75.66 |
59 |
80.33 |
54.33 |
74.33 |
48 |
71.67 |
45.66 |
71.33 |
|
S6[M,30] |
93 |
93 |
66 |
76.33 |
60.66 |
79.00 |
56.66 |
78.00 |
49.33 |
71.00 |
46 |
70.33 |
|
Avg. |
92.88 |
91.5 |
65.94 |
77.22 |
59.38 |
78.72 |
55.38 |
76.78 |
48.33 |
71.44 |
45.22 |
70.94 |
|
Improvement |
-1.38 |
16.11 |
19.33 |
21.38 |
23.11 |
25.72 |
||||||
Table 8. Response Time in seconds for normal hearing subjects.
|
3Sub. |
Response Time in seconds |
|||||||||||
|
SNR in dB |
||||||||||||
|
∞ |
+6 |
+3 |
0 |
-3 |
-6 |
|||||||
|
Unpr |
Pro |
Unpr |
Pro |
Unpr |
Pro |
Unpr |
Pro |
Unpr |
Pro |
Unpr |
Pro |
|
|
S1 |
2.659 |
2.354 |
2.829 |
2.542 |
3.482 |
2.490 |
3.682 |
2.651 |
3.942 |
2.473 |
4.324 |
3.367 |
|
S2 |
2.955 |
2.851 |
2.889 |
2.712 |
3.638 |
2.425 |
3.628 |
2.518 |
3.664 |
2.588 |
3.262 |
2.763 |
|
S3 |
2.658 |
2.424 |
2.999 |
2.689 |
3.689 |
2.328 |
2.892 |
2.541 |
3.524 |
2.712 |
3.893 |
2.48 |
|
S4 |
2.692 |
2.252 |
2.948 |
2.18 |
2.8289 |
2.564 |
3.585 |
2.783 |
3.828 |
2.632 |
3.862 |
2.554 |
|
S5 |
2.342 |
2.693 |
2.566 |
2.178 |
3.625 |
2.817 |
3.632 |
2.549 |
3.682 |
2.748 |
3.933 |
2.723 |
|
S6 |
2.859 |
2.734 |
2.894 |
2.61 |
3.324 |
2.938 |
3.422 |
2.786 |
3.632 |
2.649 |
4.632 |
3.587 |
|
Avg. |
2.694 |
2.551 |
2.854 |
2.485 |
3.431 |
2.594 |
3.4735 |
2.638 |
3.712 |
2.634 |
3.984 |
2.912 |
|
4Redn. |
0.143 |
0.369 |
0.837 |
0.836 |
1.078 |
1.072 |
||||||
3Sub: Subjects, 4Redn: Reduction.
Table 9. Average threshold level for the subjects with SNHL (bilateral moderate) in audiogram.
|
Subjects Sex & Age |
Ear |
Hearing threshold level ( dB HL) |
|||||
|
Frequency |
|||||||
|
250 Hz |
500 Hz |
1000 Hz |
2000 Hz |
4000 Hz |
8000 Hz |
||
|
S1[M,40] |
5 R |
60 |
45 |
55 |
40 |
60 |
65 |
|
6 L |
40 |
55 |
55 |
50 |
60 |
60 |
|
|
S2[M,49] |
R |
50 |
55 |
50 |
45 |
55 |
60 |
|
L |
55 |
50 |
45 |
55 |
50 |
55 |
|
|
S3[M,41] |
R |
20 |
30 |
60 |
40 |
50 |
50 |
|
L |
20 |
30 |
60 |
50 |
40 |
50 |
|
|
S4[F,33] |
R |
65 |
60 |
55 |
50 |
40 |
45 |
|
L |
60 |
55 |
55 |
50 |
45 |
50 |
|
|
S5[F,30] |
R |
25 |
30 |
40 |
50 |
60 |
90 |
|
L |
20 |
30 |
40 |
50 |
60 |
85 |
|
|
S6[F,38] |
R |
35 |
45 |
55 |
60 |
65 |
70 |
|
L |
25 |
40 |
45 |
50 |
60 |
60 |
|
5R: Right ear, 6L: Left ear
Table 10. Speech Recognition Scores in percentages for bilateral SNHL subjects.
|
Subjects Sex & Age |
SNR (dB) |
|||||||||||
|
∞ dB |
6 dB |
3 dB |
0 dB |
-3 dB |
-6 dB |
|||||||
|
Unpr |
Pro |
Unpr |
Pro |
Unpr |
Pro |
Unpr |
Pro |
Unpr |
Pro |
Unpr |
Pro |
|
|
S1[M,40] |
88 |
86.67 |
67 |
83.00 |
59.33 |
79.67 |
50.33 |
76.00 |
44.66 |
71.33 |
41 |
71.33 |
|
S2[M,49] |
86 |
85.67 |
67.66 |
85.67 |
59.66 |
81.00 |
51 |
76.00 |
42.66 |
70.00 |
45 |
73.67 |
|
S3[M,41] |
87 |
86.00 |
67.33 |
84.33 |
60 |
81.67 |
49.33 |
72.00 |
45 |
69.00 |
41.66 |
69.33 |
|
S4[F,33] |
86 |
87.00 |
66.33 |
83.00 |
61 |
83.00 |
50.66 |
73.33 |
46.33 |
71.00 |
41.33 |
68.00 |
|
S5[F,30] |
85.66 |
85.67 |
66 |
83.00 |
57 |
82.67 |
48.66 |
75.00 |
45 |
72.00 |
40 |
68.00 |
|
S6[F,38] |
86.33 |
85.33 |
67.33 |
85.00 |
59.33 |
83.00 |
49.66 |
76.33 |
43.33 |
70.33 |
41.33 |
71.67 |
|
Avg. |
86.5 |
86.06 |
66.94 |
84.00 |
59.38 |
81.83 |
49.94 |
74.78 |
44.49 |
70.61 |
41.72 |
70.33 |
|
Improvement |
-0.44 |
17.06 |
22.44 |
24.83 |
26.11 |
28.61 |
||||||
Table 11. Response Time in seconds for bilateral SNHL subjects.
|
3Sub. |
Response Time in seconds |
|||||||||||
|
SNR in dB |
||||||||||||
|
∞ |
+6 |
+3 |
0 |
-3 |
-6 |
|||||||
|
Unpr |
Pro |
Unpr |
Pro |
Unpr |
Pro |
Unpr |
Pro |
Unpr |
Pro |
Unpr |
Pro |
|
|
S1 |
3.459 |
3.168 |
4.778 |
3.423 |
4.413 |
3.154 |
4.635 |
3.329 |
4.768 |
3.687 |
5.339 |
4.532 |
|
S2 |
3.758 |
3.855 |
3.874 |
3.437 |
4.394 |
3.653 |
3.613 |
3.169 |
4.838 |
3.421 |
5.135 |
4.452 |
|
S3 |
3.658 |
3.633 |
4.774 |
3.782 |
3.484 |
3.132 |
4.945 |
4.243 |
4.484 |
3.487 |
5.873 |
4.487 |
|
S4 |
3.474 |
3.321 |
3.749 |
3.523 |
4.937 |
3.145 |
4.957 |
3.623 |
4.887 |
3.839 |
4.964 |
3.682 |
|
S5 |
4.341 |
4.629 |
3.563 |
3.389 |
4.335 |
3.739 |
4.434 |
3.221 |
4.686 |
3.483 |
4.733 |
3.234 |
|
S6 |
3.857 |
4.237 |
3.874 |
3.442 |
4.334 |
3.653 |
3.914 |
3.216 |
4.347 |
3.598 |
5.481 |
4.387 |
|
Avg. |
3.757 |
3.807 |
4.102 |
3.499 |
4.316 |
3.413 |
4.416 |
3.467 |
4.668 |
3.586 |
5.254 |
4.129 |
|
4Redn. |
-0.049 |
0.603 |
0.904 |
0.950 |
1.083 |
1.125 |
||||||
3Sub: Subjects, 4Redn: Reduction.
5. Conclusion
The scheme consists of splitting the speech into two parts with complementary spectral components for binaural dichotic presentation using a pair of time-varying comb (FIR) filters with 22 bands (one-third octave) having continuous sweep in magnitude responses with time shifts chosen less than just noticeable difference (JND).The scheme reduces the effect of spectral masking and also improves the capacity to detect gaps in a speech signal for persons with sensorineural hearing loss. For this reason, the scheme comes up with better speech perception.
Using PESQ, MOS test for quality, and using MRT for the intelligibility of speech the proposed technique is assessed.
PESQ and MOS test outcomes showed an improvement in the quality of processed speech compared to that of unprocessed. At SNR value -6dB by comparing processed speech to that of unprocessed the MRT results show 25.72% improvement in recognition score and reduced response time of 1.072 sec in case of normal hearing subjects. At same value of SNR by comparing processed speech to that of unprocessed speech the MRT results show 28.61% improvement in recognition score and reduced response time of 1.125 sec in case of bilateral SNHL persons. Hence there is an improvement in speech perception. Since there is an improvement in the quality and the intelligibility of processed speech for lower SNR so proposed scheme works better in an adverse environment.
To summarize, the earlier techniques found useful in overcoming the effects of spectral masking, due to step change in the magnitude responses of filters with a fixed number of distinct time shifts, the ability to detect gaps gets affected and evaluated the usefulness of the scheme by considering nonsense syllables only. The present work contributes an approach in the improvement of speech perception for SNHL subjects by splitting the speech signal using time-varying comb filters with a continuous sweep in magnitude response. With continuous sweep in magnitude responses of filters, gap detection capacity gets improved without compromising the benefits of the spectral splitting technique. Conducted listening test for intelligibility assessment using MRT with monosyllabic rhyming words as the test material and also test for quality is carried out using MOS test on subjects with normal hearing. As a part of objective assessment, PESQ and spectrographic analysis of the scheme are conducted. The results obtained with the proposed method are statistically significant.
In future work, it is recommended to consider more number of subjects and lower SNRs. Further multi-band compression scheme needs to be considered.
References Time-varying Comb Filters to Improve Speech Perception in Sensorineural Hearing Loss Subjects
- Brian C. J. Moore, “An Introduction to Psychology of Hearing”. 4th ed. London: Academic, 1997.
- Ashwini V.Vikhe, Ulhas V. Patil, “Improving Speech intelligibility of sensorineural hearing impaired and real time noise cancellation using filters”, International journal of informative and Futuristic Research. Vol 3 Issue 10 June 2016 ISSD: 2347-1697.
- Kambalimath, Shankarayya G., Prem C. Pandey, Pandurangarao N. Kulkarni, Shivaling S. Mahant-Shetti, and Sangamesh G. Hiremath. "FPGA-based implementation of comb filters using sequential multiply-accumulate operations for use in binaural hearing aids." In 2014 Annual IEEE India Conference (INDICON), pp. 1-6. IEEE, 2014.
- Cheeran, Alice N., Prem C. Pandey, and Dakshayani S. Jangamashetti. "Design of comb filters based on auditory filter bandwidths for binaural dichotic presentation for persons with sensorineural hearing impairment." In 2002 14th International Conference on Digital Signal Processing Proceedings. DSP 2002 (Cat. No. 02TH8628), vol. 2, pp. 971-974. IEEE, 2002.
- Jangamashetti, Dakshayani S., Prem C. Pandey, and Alice N. Cheeran. "Time varying comb filters to reduce spectral and temporal masking in sensorineural hearing impairment." In Bio vision 2001 International conference on Biomedical Engineering, Bangalore, India, pp. 21-24. 2001.
- Kulkarni, P. N., and P. C. Pandey. "Optimizing the comb filters for spectral splitting of speech to reduce the effect of spectral masking." In 2008 International Conference on Signal Processing, Communications and Networking, pp. 69-73. IEEE, 2008.
- Pujar, Rajani S., and P. N. Kulkarni. "Frequency compression of speech for improving speech perception in sensorineural hearing loss: FBS approach." In 2017 International Conference on Wireless Communications, Signal Processing and Networking (WiSPNET), pp. 487-492. IEEE, 2017.
- ITU-T, “Perceptual evaluation of speech quality (PESQ): an objective method for end to end speech quality assessment of narrow band telephone networks and speech codecs,” ITU-T Rec., P.862, 2001.
- Cheeran, Alice N., and Prem C. Pandey. "Optimizing the sweep cycle of time-varying comb filters for binaural dichotic presentation in sensorineural hearing impairment." In 2002 14th International Conference on Digital Signal Processing Proceedings. DSP 2002 (Cat. No. 02TH8628), vol. 2, pp. 1145-1148. IEEE, 2002.
- Wang, Qingyun, Ruiyu Liang, Li Jing, Cairong Zou, and Li Zhao. "Sub-band noise reduction in multi-channel digital hearing aid." IEICE TRANSACTIONS on Information and Systems 99, no. 1 (2016): 292-295.
- Cheeran, Alice N., and Prem C. Pandey. "Speech processing for hearing aids for moderate bilateral sensorineural hearing loss." In 2004 IEEE International Conference on Acoustics, Speech, and Signal Processing, vol. 4, pp. iv-17. IEEE, 2004.
- Kulkarni, Pandurangarao N., Prem C. Pandey, and Dakshayani S. Jangamashetti. "Binaural dichotic presentation to reduce the effects of spectral masking in moderate bilateral sensorineural hearing loss." International journal of audiology 51, no. 4 (2012): 334-344.
- Sang, Jinqiu, Hongmei Hu, Guoping Li, Mark E. Lutman, and Stefan Bleeck. "Supervised sparse coding strategy in hearing aids." In 2011 IEEE 13th International Conference on Communication Technology, pp. 827-832. IEEE, 2011.
- Kulkarni, Pandurangarao N., Prem C. Pandey, and Dakshayani S. Jangamashetti. "Study of perceptual balance for designing comb filters for binaural dichotic presentation." Proc. 20th Int. Cong. Acoust.(ICA 2010, Sydney, Australia, 23-27 Aug. 2010), Paper 556 (2010).
- ARIÖZ, UMUT, and BANU GÜNEL. "Evaluation of hearing loss simulation using a speech intelligibility index." Turkish Journal of Electrical Engineering and Computer Sciences 24, no. 5 (2016): 4193-4207.
- Deshmukh, S. G., S. A. Pangaonkar, and M. K. Datir. "Effective Filter Design Using FDA Tool for Improving Speech Intelligibility of Hearing Impaired." International Journal of Information and Computation Technology 4, no. 4 (2014): 419-424.
- Kulkarni, Pandurangarao N., Prem C. Pandey, and Dakshayani S. Jangamashetti. "Multi-band frequency compression for reducing the effects of spectral masking." International Journal of Speech Technology 10 (2007): 219-227.
- Kulkarni, Pandurangarao N., Prem C. Pandey, and Dakshayani S. Jangamashetti. "Multi-band frequency compression for improving speech perception by listeners with moderate sensorineural hearing loss." Speech Communication 54, no. 3 (2012): 341-350.
- Pujar, Rajani S., and P. N. Kulkarni. "Cascaded structure of noise reduction and multiband frequency compression of speech signal to improve speech perception for monaural hearing aids." In 2019 IEEE 16th India Council International Conference (INDICON), pp. 1-4. IEEE, 2019.
- J.G.Proakis and D.G.Manolakis, “Digital Signal Processing Principles, Algorithm, And Applications.” New Delhi: Prentice Hall, 1997.
- David Thompson, Railway Noise and Vibration Mechanisms, Modelling and Means of Control :Elsevier,2010
- Beerends, John G., Andries P. Hekstra, Antony W. Rix, and Michael P. Hollier. "Perceptual evaluation of speech quality (pesq) the new itu standard for end-to-end speech quality assessment part ii: psychoacoustic model." Journal of the Audio Engineering Society 50, no. 10 (2002): 765-778.
- Rix, Antony W., John G. Beerends, Michael P. Hollier, and Andries P. Hekstra. "Perceptual evaluation of speech quality (PESQ)-a new method for speech quality assessment of telephone networks and codecs." In 2001 IEEE international conference on acoustics, speech, and signal processing. Proceedings (Cat. No. 01CH37221), vol. 2, pp. 749-752. IEEE, 2001.
- ITU, T. "Recommendation P. 800. Methods for subjective determination of transmission quality." International Telecommunication Union Geneva, Switzerland, August 1996.
