To the Issue of Application of Unstabilized Voltage in the Power Supply System of Spacecraft

Author: Gebgardt V.A., Khlystunov M.E., Zhuravlev I.M., Bukreev V.G.
Journal: Журнал Сибирского федерального университета. Серия: Техника и технологии @technologies-sfu
Section: Исследования. Проектирование. Опыт эксплуатации
Article in issue: 6 т.18, 2025.
Free access
In this article the spacecraft load voltage stabilization range influence on the specific power parameters (W/kg) of the power system as a complex of the electric power supply system and the secondary power supply devices (DC-DC convertors) built in loads is considered. It is showed that the secondary power supply devices usage in the on-board equipment on the base of a flyback impulse convertor for the load voltage of (25–27) V allows providing for the higher specific parameters than for the load voltage of (17–36) V within the range of loads up to 3 kW. The graphic characteristics and analytic formulae are derived.
Spacecraft, electric power system, secondary power supply, specific power parameters
Short address: https://sciup.org/146283187
IDR: 146283187 | UDC: 621.3.051.024
К вопросу применения нестабилизированного напряжения в системе электропитания космического аппарата
В работе рассматривается влияние диапазона стабилизации напряжения нагрузки космического аппарата на удельные характеристики мощности (Вт/кг) энергосистемы, как совокупности системы электропитания и вторичных источников питания в потребителях электроэнергии. Показано, что применение в бортовой аппаратуре вторичных источников питания на основе обратноходового импульсного преобразователя для напряжения нагрузки 25–27 В позволяет обеспечить большие удельные характеристики, чем для напряжения питания 17–36 В, в диапазоне нагрузок до 3 кВт. Получены графические характеристики и аналитические формулы.
Text of the scientific article To the Issue of Application of Unstabilized Voltage in the Power Supply System of Spacecraft
Space engineering objects are complex devices that have quite a number of properties and parameters. In system designing the specific parameters are especially used to achieve the defined abstraction level. The launching services have high costs and in designing of spacecrafts (SC) and their on-board systems the specific parameters and mass characteristics are generally used. And their optimization (maximization) becomes the main criterion [1–4].
As far as an Electric Power System (EPS) can have the weight up to one third of the SC [5, 6] mass it is the very important task to increase EPS specific parameters. There are a lot of different EPS [1, 2, 7] structures and they can influence on different parts of Power Conditioning Units (PCU). Due to that the complex analyses is not a trivial task [8, 9].
For an example, EPS with buffer Battery switching on differs from EPS with the separated energy transformation by absence of PCU parts which are responsible for the output voltage stabilization and also by Batteries and Solar Arrays [10] optimal usage and requirements for the secondary power supply (SPS) devices built in the on-board equipment (OBE).
It is necessary to take into account parameters of SPS which are used in OBE depending on EPS architecture for correct estimation of PCU structures influence on the spacecraft energy-mass characteristics. The little SCs with low voltage output bus of power supply (to 34 V at OBE input) and the load up to 3 kW are more widespread now.
Table 1
|
Parameter |
UPB |
SPB |
|
Advantages |
Voltage stabilizers exclusion from EPS structure: – mass decrease; – dimensions decrease; – simplification of schematic solutions and reliability increase; – voltage transformation levels number decrease. |
SPB with the narrow input voltage range have higher specific parameters and the efficiency. It is good to use them in OBE. |
|
Disadvantages |
It does not fit to part of OBE by input interfaces. The efficiently of SPS with the wide range of input voltage is lower than the efficiently of the specialized SPS with narrow range of input voltage. |
EPS becomes more complexed (additional units in PCU, redundancy and etc.) |
Two EPS versions are the most interested:
-
a ) stabilized power bus (SPB) – output voltage of (27.0 ± 1.0) V;
-
b ) unstabilized power bus (UPB) – output voltage of (29.0 ± 5.0) V.
Due to the input voltage ranges are very close and the output voltages are the same, the applied component base will be the same and their comparison will accordingly be correct.
Main advantages and disadvantages SPB and UPB are given in Table 1. It is seen from comparison that additional functional parts are required due to presence of narrow range of input voltage. At the same time the special SPS for the narrow voltage range have, as a rule, higher specific parameters and the efficiency.
Calculations
The following initial data is defined for SPS calculation:
-
– SPS topology – a flyback convertor (galvanic bypassing);
-
– frequency is 62.5 kHz;
-
– magnetic conductor: toroidal one made of soft magnetic metal powder;
-
– one secondary winding;
-
– output power level is 5–50 W;
-
– output voltage level is – 15 V;
-
– output voltage pulsation is not more than 1 %.
Flyback SPS schematic electrical diagram is given in Fig. 1.
-
1) The maximum current in SPS secondary winding is defined by formula (1):
where: Poutmax – SPS maximum output power, W; Uout – SPS nominal output voltage, V.
-
2) Diode voltage is defined by formula (2):
^VD = ^VD + ^ou^max ^ ^VD^> (2)
where: EVD – threshold voltage of diode enablement; RVD – differential resistance of p-n boundary.
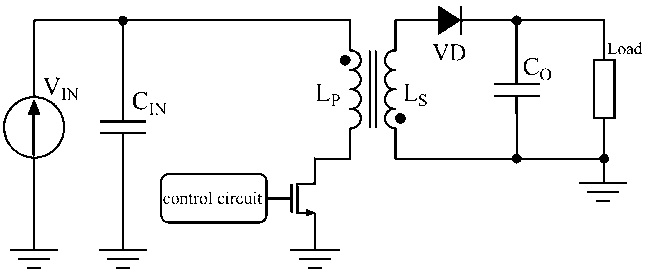
Fig. 1
-
3) Loss in diode is defined by formula (3):
PvD — I°utmax X ^VD (3)
-
4) Minimum inductance of choke is defined by formula (4):
^^ _ Utrimax X 0)25
2 x fsw x lout-max x ^TV where: Uinmax – SPS maximum input voltage; KTV – transformation factor.
-
5) Average length of core magnetic line is defined by formula (5):
where: Dc – core external diameter; dc – core internal diameter.
-
6) Cross-section square of core with rounding is defined by formula (6):
where: hc – core height; Nc – number of cores.
-
7) Number of winds in choke primary winding is defined by formula (7):
where: μ 0 – permeability; μc – core magnetic conductivity.
-
8) Number of winds in choke secondary winding is defined by formula (8):
W2 — W-^ X ^tv
-
9) Electrical energy loss in SPS choke primary winding is defined by formula (9):
Plc — Pwi x Л2,
where: RW 1 – ohmic resistance of choke primary winding; I 1 – current in choke primary winding.
-
10) Electrical energy loss in SPS choke secondary winding is defined by formula (10):
Pb2 = Pw2 X lOUtmax2’(10)
where: RW 2 – ohmic resistance of choke secondary winding.
-
11) Electrical energy loss in SPS choke core is defined through magnetic loss-angle tangent by formula (11):
Plc = t-S^n *■ ц0 X Цс X fsw ^ Hi X ^я ^ - ) X Sej,(11)
where fSW – commutation frequency.
-
12) Electrical energy loss in current measuring shunt is defined by formula (12):
Psh — Psh x Л(12)
-
13) Static loss in power transistor is defined by formula (13):
PvTstatic = Pvt x Л >(13)
where RVT – transistor open channel resistance.
-
14) Dynamic loss in power transistor is defined by formula (14):
PvTdynamic ^1 X P Hi-max X fsw X
t-rise + tfall
where: trise – transistor enabling time; tfall – transistor blocking time.
-
5) Electrical energy summary loss in SPS is defined by formula (15):
Ploss PvD ^ Pl P Psh + PvTstatic + PvTdynamic
-
16) SPS efficiency is defined by formula (16):
P outmax
V =------------
Ploss + Poutmax
-
17) SPS specific parameters are defined by formula (17):
Poutmax
Psnsns =------ Msps
Results of calculations for SPS are given in Table 2.
The calculation results showed that the specialized SPS with the range of input voltage of (26 ± 1) V have higher specific parameters and the efficiency that SPS with the range of input voltage of (26.5 ± 9.5) V independently of the output power level.
The assumption can be made that the general energy efficiency of power systems with usage of the specialized SPS with input voltage range of (26 ± 1) V will be higher independently of load configurations.
Estimation of the required mass of SPS built in OBE in the range up to 3 kW with output power of 25 W is given on Fig. 2.
Estimation of SC mass decrease with 27V SPB in replacement of SPS with the input voltage range of (26.5±9.5) V by SPS with the input voltage range of (26±1) V is given on Fig. 3.
Table 2
|
SPS output power, W |
Permissible SPS power supply voltage, V |
|||
|
17–36 |
25–27 |
17–36 |
25–27 |
|
|
SPS specific power, W/kg |
SPS efficiency factor,% |
|||
|
5 |
81.05 |
82.19 |
92.77 % |
92.82 % |
|
10 |
133.48 |
136.57 |
91.22 % |
91.83 % |
|
15 |
168.85 |
176.16 |
89.76 % |
90.29 % |
|
20 |
193.05 |
203,11 |
89.05 % |
89.97 % |
|
25 |
209.43 |
221,61 |
86.84 % |
88.29 % |
|
30 |
226.89 |
241.86 |
85.41 % |
87.21 % |
|
35 |
232.49 |
251.24 |
84,26 % |
85.69 % |
|
40 |
245.20 |
264.66 |
82.48 % |
84.13 % |
|
45 |
243.96 |
266.95 |
80.00 % |
83.32 % |
|
50 |
252,74 |
276.97 |
77.85 % |
81.97 % |
Note – calculations are performed for SPS nominal power supply voltage of 26 V
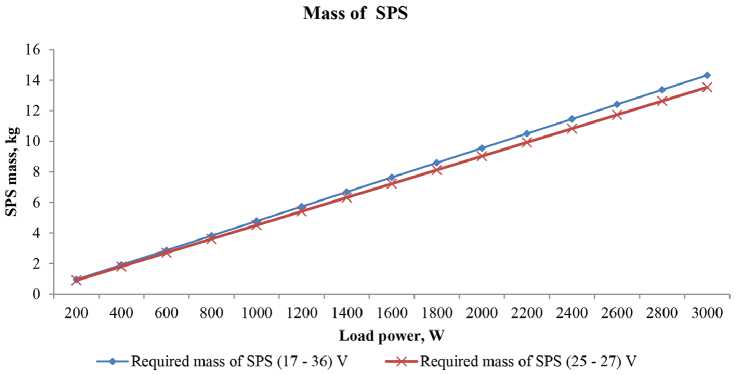
Fig. 2. Estimation of the required SPS mass
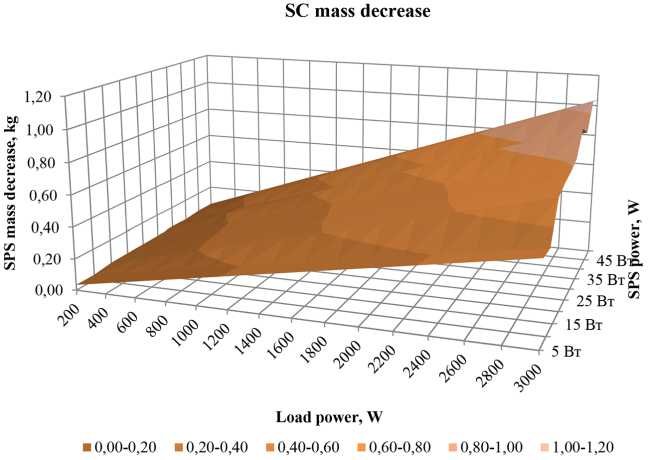
Fig. 3. SC mass decrease estimation
Conclusion
The received data allow to affirm that SPS with the input voltage range of (26±1) V have the specific power parameters by 1.5 % higher than the parameters of SPS with the input voltage range of (29.0 ± 3.0) V. The maximum effect appears at SPS output power of 50 W, voltage of 26 V and reaches to 8.7 %.
Usage of the stabilized input voltage of SPS built in OBE in designing of EPS up to 3 kW allows decreasing SC total mass down to 0.22–0.43 % (without EPS heat removal optimization).
