Towards development of a low cost and portable ECG monitoring system for rural/remote areas of bangladesh

Author: Sayed Tanvir Alam, Md. Moin Hossain, Mohammad Dehan Rahman, Md. Kafiul Islam
Journal: International Journal of Image, Graphics and Signal Processing @ijigsp
Article in issue: 5 vol.10, 2018.
Free access
An electrocardiogram (ECG) machine is a device that checks the patient’s heart rhythm and electrical activity. This is done by attaching sensors on the skin of the patients. But the problem with these machines is that, these are expensive and not portable. Thus it is difficult to use these machines in the rural or remote areas of developing countries like Bangladesh where the issue of portability and cost arises. In this paper, the problem of cost and portability is addressed. We propose a complete solution for a low-cost portable ECG monitoring from recording to report generation for patients including real-time ECG traces on screen with storage options and calculation of all necessary diagnostics parameters for helping the doctors to make decision. This type of ECG machines could be used in hospitals, homes, villages or even in a disaster area. The system designed in this paper includes a PC/Laptop, as these devices are now widely available, at least available at hospitals and health care centers, even in rural/remote areas of Bangladesh. With this, a significant difference can be made against heart diseases.
ECG, Portable, MATLAB, Arduino, Low cost
Short address: https://sciup.org/15015961
IDR: 15015961 | DOI: 10.5815/ijigsp.2018.05.03
Text of the scientific article Towards development of a low cost and portable ECG monitoring system for rural/remote areas of bangladesh
Published Online May 2018 in MECS DOI: 10.5815/ijigsp.2018.05.03
One of the leading causes of human death is due to cardiovascular diseases [2]. The first step to prevent such diseases is to have an effective method of collecting, monitoring and maintaining the health data of the patient. Electrocardiography (ECG) or also known as EKG, most commonly performed cardiology test, is the procedure of recording the electrical activity of the heart over a period of time using electrodes placed on the skin. These electrodes sense the small electrical changes on the skin that arise from the heart muscle's electrophysiological pattern of depolarizing and repolarizing during each heartbeat [10, 12, 15, 18]. For this purpose, a device known as ECG machine is used to measure the electrical activity the heart, transform it into an electrical signal and display it on a monitor in real-time [13, 17]. Information from the ECG machine can be used to give a diagnosis of a wide range of heart conditions [20]. Commercially there are different ECG monitoring systems and some of the research works about monitoring systems are classified as:
-
i. Systems that record signals and perform analysis offline.
-
ii. Systems that perform real-time monitoring.
-
iii. Systems that provide real-time signal classification.
When it comes to cardiovascular diagnosis, an ECG machine is a must. But an ECG machine is very complex to use and very expensive. Most of the ECG machines used are not portable. However, in a developing country such as Bangladesh, where two-thirds of the population live in rural/remote areas, availability of a commercial ECG machine becomes difficult due to cost and portability. Advanced healthcare facilities have not yet reached most of the rural areas of Bangladesh. An advanced medical equipment, such as ECG monitoring device, is not found in most these health care centers and hospitals as traditional ECG monitoring devices are highly expensive ranging from 50,000 BDT to 1,00,000 BDT. The health care centers and hospitals which have an ECG monitoring device takes a high charge from the patients for an ECG test which most of them cannot afford. Thus, most of the people suffer from underdiagnosis.
A number of research works had presented portable and/or low-cost ECG monitoring system as found in the literature [3-8]. However, none of them presented a complete solution of ECG monitoring, i.e. from signal recording to signal processing and analysis and finally to generate a professional patient report that can be readily used by the physicians. Few of them only concentrated on efficient recording techniques while some others focused on signal analysis/processing algorithms. The aim of this paper is not only to develop a low-cost ECG monitoring machine that will be available and affordable but also which can provide a complete solution of recording, monitoring as well as report generation for the people living in the rural/remote area so that they never suffer from underdiagnosis of a heart problem.
-
II. Methods
In this work, the experiment was performed on subjects by connecting 3 disposable electrodes on their body. The ECG signal of the heart was extracted using an electronic circuit and viewed on a PC/Laptop in real time. The ECG signal was also recorded for a minute and then was digitally filtered using MATLAB. This was performed for offline analysis of ECG signal and calculation of detailed morphological values for vital diagnostic parameters (so-called ECG characteristic points (PQRS) such as heart-rate, HRV, pulse rate, etc.) leading to the generation of a patient report. The heartbeat rate and the RR interval of the subject are also calculated and shown on an LCD in real time. This will eventually help the doctors to diagnose any abnormal heart activity of the patients. The overall process flow is depicted in fig. 1.
Design the circuit required to obtain a proper waveform of the activity of the heart.

Interface the circuit with a PC/Laptop to pass the signal

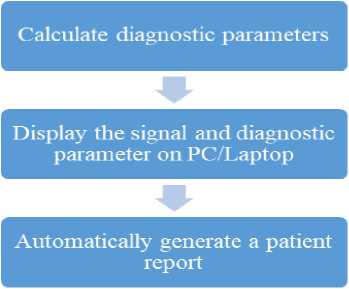
Fig.1. Overall process flow of the work.
-
III. Analog System Design
The design used in this paper consists of various parts. All these parts are integrated together to make the device and extract ECG signal from the patient. The ECG circuit can be divided into the following parts:
-
• Electrodes.
-
• Dual DC voltage regulators.
-
• Instrumentation amplifier
-
• Active low –pass filter
-
• Clamper
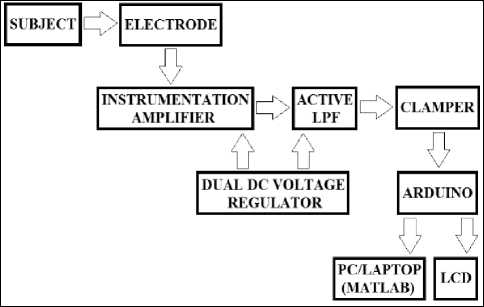
Fig.2. Block diagram of the entire system.
The ECG circuit is then interfaced with a PC/Laptop using an Arduino for real-time monitoring and offline analysis that is performed using MATLAB. The Arduino is also interfaced with an LCD to calculate and view some basic morphological values in real time. The block diagram below shows how all of these parts are integrated together.
-
A. Electrodes
Electrodes are placed on the skin of the subject to sense the electrical change. These electrodes can detect the tiny electrical changes on the skin due depolarizing and repolarizing of the heart muscles.
In this paper, three electrodes are used. Two electrodes are connected to the chest and one is connected to the right leg, which acts as the reference voltage for the other two. Three electrodes are used to eliminate poor connection noise.
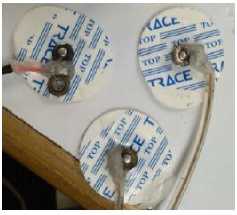
Fig.3. Circular disposable electrodes and connectors used in this work.
-
B. Dual DC Voltage Regulator
The input voltage may not always be constant and may fluctuate within a range. This fluctuation can damage the circuit. Thus, a voltage regulator is implemented in the design. The components used in this paper have an input voltage range of 2.3V to 18V. If the input voltage rises above 18V then the circuit will not work properly. For this paper 7809 was used for positive 9 voltage and 7909 was used 9 negative voltage. Thus, for these ICs to work an input of 12 volts or above is used. The schematic diagram of the circuit and its hardware implementation is shown below.
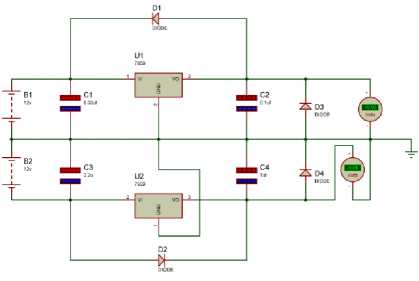
Fig.4. Schematic of dual DC voltage regulator.
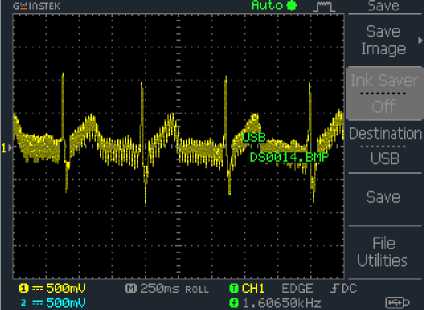
Fig.6. Output of AD620 observed on an oscilloscope.
C. Instrumentation Amplifier
An instrumentation amplifier [13, 16] is used in this project to extract the ECG signal of the heart from a subject by eliminating the noise. The instrumentation amplifier used in this paper is AD620. The AD620 is a low cost, high accuracy instrumentation amplifier that requires only one external resistor to set gains of 1 to 10,000. For AD620, the gain of the amplifier can be calculated using the following formula.
A v
49.4 kΩ RGain
The following diagram shows a schematic diagram of this circuit.
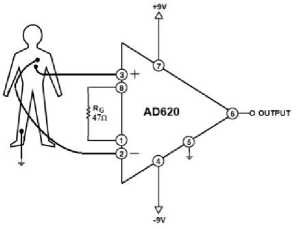
Fig.5. Schematic of the circuit used to extract ECG signal of the heart.
The electrodes of circuit demonstrated above were connected to a subject and the output was viewed on an oscilloscope.
-
D. Low Pass Filter
In this paper, a low pass filter was used to eliminate high frequency noise from the ECG signal [14]. A second-order active low pass filter was used so that a better frequency response can be obtained. The cutoff frequency of a second order low pass filter can be calculated using the formula provided below.
f c = 1 (2)
2π√R1R2 C1C2
The cutoff frequency used in this paper is 80Hz. The cutoff frequency can be set lower but that attenuates some of the high-frequency components of the actual ECG signal and makes it hard for signal processing in the later part of this paper. This does not affect the efficiency as digital filtering is performed in the later part of this paper.
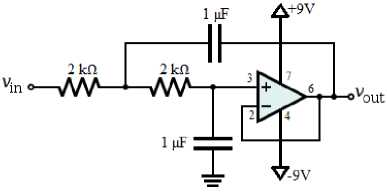
Fig.7. Schematic of active low pass filter.
The filter demonstrated above was fed with the signal obtained using the instrumentation amplifier and the output was viewed on an oscilloscope.
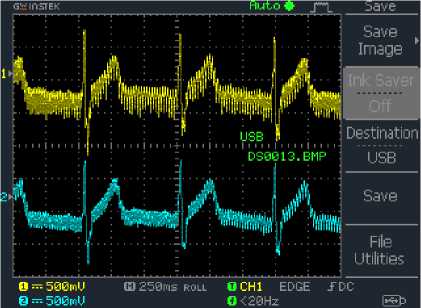
Fig.8. Filtered and unfiltered ECG signals viewed on the oscilloscope.
-
E. Clamper
The voltage of the signal generated by the circuit has a positive and a negative cycle. However, Arduino, used in later part of this paper, cannot process the negative voltage and clips it to zero. To avoid this, a clamper circuit is used to shift the whole signal above 0V by adding a DC offset.
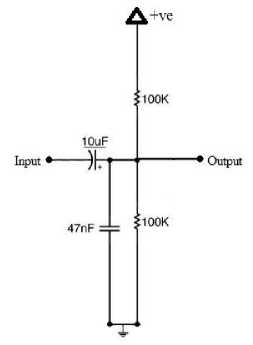
Fig.9. Schematic diagram of clamper.
The clamper demonstrated above was fed with the signal obtained from the filter and the output was viewed on an oscilloscope.
-
F. Heartbeat Rate and RR Interval Measuring Circuit
The output obtained from the clamper is fed to an Arduino to calculate heartbeat rate and its RR interval and display the result on an LCD. The algorithm used to obtain the measurements is discussed in the later part of this paper.
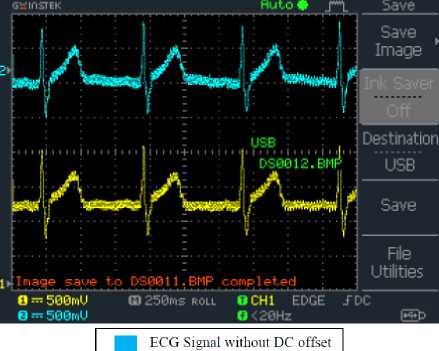
ECG Signal with DC offset
Fig.10. ECG signal with and without DC offset to demonstrate the function of Clamper circuit.
-
G. Schematic and Implementation of ECG circuit
All the circuits discussed above were integrated together to work as a system. The schematic of the entire system is provided in fig. 11. We have used Arduino UNO for taking the analog frontend output and to make it digital to feed into PC/laptop through the serial monitor. Arduino UNO is also used to calculate the heart-rate (RR interval) for showing on LCD which is interfaced with Arduino.
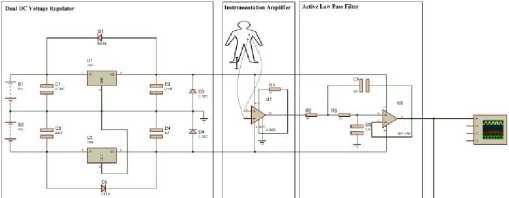
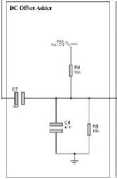
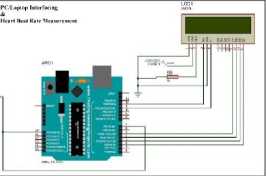
Fig.11. Schematic diagram of the overall system.
-
IV. Computer Interfacing and Algorithm Implementation
This section discusses the interfacing between analog frontend and computer/laptop and the algorithm implementation on MATLAB platform for DSP part of the system to find out the required diagnostic parameters from recorded ECG signal.
-
A. Analog Circuit To PC/Laptop Interfacing Using Arduino
The ECG circuit discussed above was interfaced with a PC/Laptop using an Arduino. The signal obtained from the ECG circuit was fed to an analog pin of the Arduino. The Arduino was programmed to read the analog data, perform analog to digital conversion and store the data is a continuous loop. A sampling frequency of 785 Hz was used to perform this process. The Arduino then was connected to a PC/Laptop using a USB port. Once the digital ECG signal is available on PC/Laptop, we can perform digital signal processing using MATLAB to remove noise/interference as well as to analyze ECG signal characteristics for extracting diagnosis parameters [9].
-
B. Real-Time Monitoring Using Serial Plotter
The Arduino IDE software was a built-in tool called serial plotter. Real-time monitoring of ECG signal can be easily performed using this tool. The data obtained by the Arduino from the ECG circuit is sent to the serial plotter by serial communication and the tool plots the data accordingly. A baud rate of 115200 was used for the serial communication channel.
-
C. Arduino to MATLAB Interface
The data from the Arduino is sent to MATLAB for detailed signal processing. The data is sent using serial communication at a baud rate of 115200. The algorithm stores 6000 samples sent from the Arduino. The algorithm reads a data per millisecond and therefore stores the ECG signal of the subject for 1 minute. It then plots the obtained data and displays the ECG signal. The raw ECG signal recording of a subject for 1 minute is provided below.
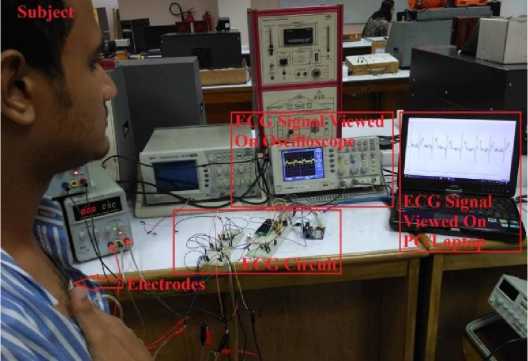
Fig.12. View of the overall hardware set-up with the subject for ECG recording. ECG trace is observed on Serial Plotter of the laptop in realtime.
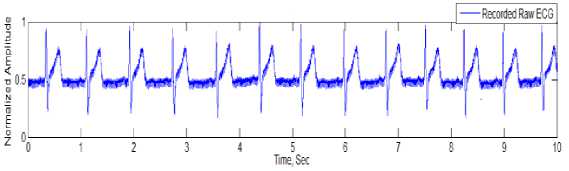
Fig.13. Raw ECG recording shown on MATLAB
-
D. Power Line Interference and High-Frequency Noise Removal
Power line interference coming from power supply frequency of 50Hz and its harmonics are one of the common noises that affect any biomedical recordings [11]. To remove unwanted electrical interference, a digital notch filter and a digital FIR low-pass filter were designed in MATLAB and applied to the raw ECG signal in this paper. To design the notch filter for power supply noise removal an infinite impulse response (IIR) filter of the cutoff frequency of 50 Hz and of order 2 was chosen. Whereas to design the low pass filter for high-frequency noise removal, a finite impulse response (FIR) filter of cutoff frequency 80 Hz of order 256 was chosen. The result obtained is provided below.
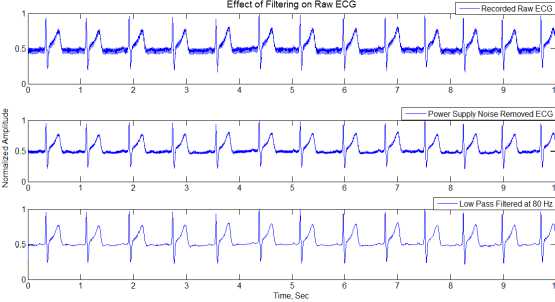
Fig.14. Effect of filtering on raw ECG signal: top to bottom represent raw ECG, the output of 50-Hz notch filter and output of LPF respectively.
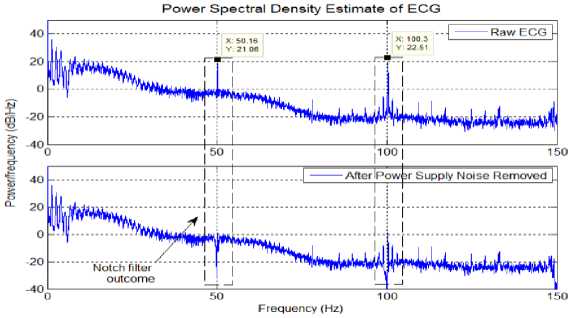
Fig.15. Power spectral density estimate of ECG signal to demonstrate the effect of notch filtering for removing power line interferences
-
E. QRS Complex Detection
If the QRS complexes of the ECG signal can be detected, then ECG parameters can be measured in detail. This complex procedure was accomplished by an open source MATLAB algorithm called ‘cadio24’ of ‘redxlab’. This open-source algorithm was developed by Kuldeep Singh Rajput, Rohan Puri, Maulik Majmudar, M.D., Dr. Ramesh Raskar along with their students Harsha Vardhan Pokkalla, Aranya Goswami [1]. The flowchart in Fig. 16 shows how the algorithm works.
This algorithm was used to detect QRS complexes of the ECG signal recorded from the subject using MATLAB. The result obtained is provided in Fig. 17.
-
F. Measuring Morphologies Values
After QRS detection, the algorithm from ‘cardio24’ can measure 12 morphological values from the ECG signal. The algorithm can be used measure the following parameters:
-
i. Maximum heart rate
-
ii. Average heart rate
-
iii. Minimum heart rate
-
iv. Total number of QRS complexes
-
v. Number of irregular beats
-
vi. Percentage of irregular beats
-
vii. Number of episodes with consecutive irregular
beats
-
viii. Average PR interval
-
ix. Average QRS Interval
-
x. Average QT Interval
-
xi. Number of P wave absences
-
xii. Number of episodes that has more than four
consecutive P wave absences
-
G. Automatic Report Generation
The morphological values calculated by the ‘cardio24’ algorithm was extracted, and a MATLAB algorithm was written to dump the measurements made on a text file to generate a report. The patient report automatically generated from the ECG signal from the ECG circuit is given below.
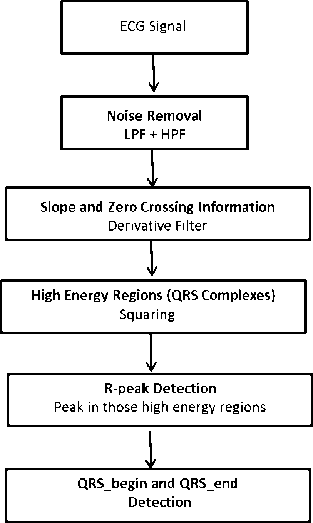
Fig.16. Flowchart of QRS detection algorithm adapted from [1].
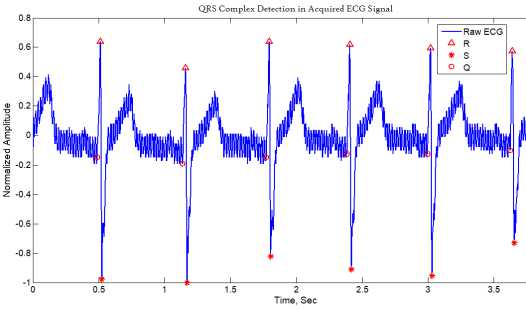
Fig.17. QRS complex detection from ECG
-
H. Real Time Heartbeat Rate and RR Interval Measurement
A circuit used in this paper to measure heartbeat rate and RR interval in real time and to display it on an LCD was discussed above. The algorithm will be discussed in this section.
The point R of the ECG signal has the highest amplitude and can easily be detected as a high pulse when ECG signal is fed into a digital input port of an Arduino. If this point is detected, it means that the heart has made a beat. The following is the stepwise explanation of the algorithm:
-
i. Reset Arduino timer.
-
ii. Start measuring time when the first high pulse is detected.
-
iii. Stop measuring time after 10 high pulses are detected.
-
iv. Convert the time measured from milliseconds to seconds.
-
v. Divide the total time measured by 10. This gives the average RR interval or basically the period of the signal.
-
vi. Calculate the reciprocal of average RR interval. This gives the number of beats in one second or basically the frequency of the ECG signal.
-
vii. Multiple the value obtained from the previous step by 60. The gives us the number of beats per minute.
-
viii. Send the value to the LCD connected to the Arduino.
-
ix. Repeat the steps again.
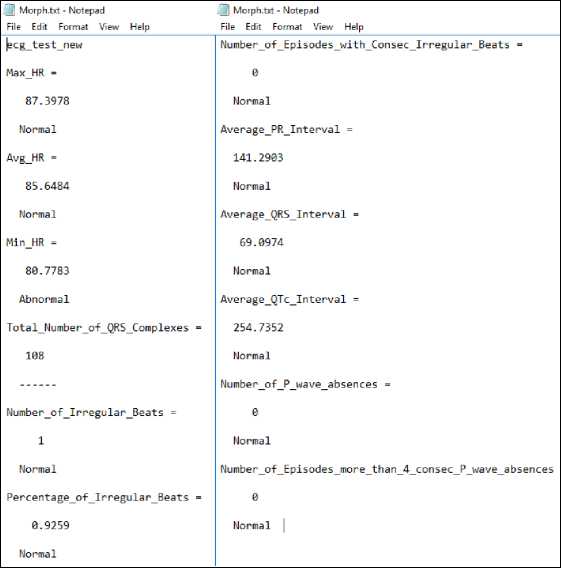
Fig.18. Snapshot of an automatically generated patient report based on ECG parameters.
-
V. Cost Analysis and Discussion
We have attempted an approximated cost analysis for the analog frontend hardware and it is obvious that it can be made within 1,000 BDT (~11.50 USD), while the rest of the part of the system including PC/laptop are already available in the target healthcare facilities i.e. healthcare centers or hospitals. This is quite remarkably costeffective in comparison with the commercial ECG machines that cost in the range from 50, 000 BDT to 100,000 BDT (approx. 600 - 1,200 USD).
The finding provided in the table shows that the system developed in this paper could efficiently extract the ECG signal, display the trace on a Laptop and display some basis morphological values on an LCD in real time. The system can also be used for detailed offline analysis of ECG signal. A wide range of morphological values can be measured and can generate a report based on it. The electronic components provide satisfactory output and a pure ECG signal could be obtained after digital signal processing. None of the component used in the system is expensive and therefore, making the whole system of low cost. The ECG circuit is connected to a laptop making the whole system portable.
Table 1. Approximated cost of the components used in our proposed system
|
Component s Used |
Quantit y |
Unit Price (USD) |
Total Cost (USD) |
Remarks |
|
Arduino UNO |
01 |
7.00 |
7.00 |
|
|
ECG Electrodes |
03 |
0.10 |
0.30 |
Disposable / One time use |
|
AD620 |
01 |
2.15 |
2.15 |
|
|
LCD |
01 |
7.20 |
7.20 |
Can be ignored when interfaced with PC/Laptop |
|
LM741 |
01 |
0.15 |
0.15 |
|
|
Voltage Regulator 7809/7909 |
02 |
0.15 |
0.30 |
Not required if battery is used |
|
9V Battery |
02 |
035 |
0.70 |
In this work, the circuit is tested with lab power supply, which can be replaced with two 9V batteries |
|
Others |
1 set |
Lumps um |
1.00 |
Resistors, Capacitors, Connectors, Jumpers, etc. |
|
Total Cost of the System (without LCD and Voltage Regulator) |
$11.30 or 950 TK |
<1000 Taka!!! More realistic given that a Laptop with MATLAB installed is available |
||
|
Total Cost of the System (with LCD but without Voltage Regulator) |
$18.50 |
Less realistic since LCD is not required when Laptop is available |
||
-
VI. Conclusion
After implementation of all the circuit components and applying all the algorithms, it can be said that the system developed is a robust system for ECG monitoring. The system is portable, and the outputs obtained from each part of the system are of satisfyingly high quality. Therefore, the output of the system is reliable. The system is cost-efficient, as only around 1500 BDT was required to develop the system. The system can be used for both real-time monitoring and detailed offline analysis. The system only requires a Laptop as processing terminal that is now even available in these rural or remote areas’ healthcare centers. Connecting the device to Laptop is very easy. They can be connected just by using the USB port of Laptop. The morphological values and the report generated by the algorithm can help doctors make diagnosis more easily.
-
VII. Future Work
The developed prototype system already serves its purpose. However, there are a few numbers of advances that can be made to make the system even better and more user-friendly. Following are the future development plan for this paper:
-
• Interfacing the circuit with a graphical LCD so that a PC/Laptop and LCD is not required for online monitoring.
-
• Develop an algorithm to automatically generate a professional patient report.
-
• Inclusion of circuit isolation and right leg drive circuit to the system to provide patient protection.
-
• Develop a smartphone application and interface the circuit with it so that real-time analysis can be performed using a smartphone.
-
• Covert the circuit into PCB. This will not only make the hardware compact but also reduce the noise affecting the ECG signal furthermore.
If the above-mentioned specifications can be included in the system then the system will become more costeffective, efficient, wireless and multifunctional. The system will solve the issues of ECG monitoring in the rural/remote areas of Bangladesh fully.
Acknowledgment
The project is funded and technically supported by Dept. of Electrical and Electronic Engineering (EEE), Independent University, Bangladesh (IUB).
References Towards development of a low cost and portable ECG monitoring system for rural/remote areas of bangladesh
- QRS Detection Algorithm ‘cardio24’ by ‘redxlab’. Link: https://github.com/redxlab/cardio24/
- http://www.who.int/cardiovascular_diseases/en/ (accessed on 6th Jan, 2018).
- Ertola, J. P., Silvia Figueira, Meghan Carlsen, Uma Palaniappan, and Kelsey Rondini. "Low-cost electrocardiogram device for preventive health care in rural populations of developing countries." In Global Humanitarian Technology Conference (GHTC), 2016, pp. 646-655. IEEE, 2016.
- Christ, Gabriel, Shachi Kakkar, Michael McElroy, and Augustus Boling. "Low Cost SMS-Enabled EKG for Use in Developing Countries." (2017).
- Deb, Sudip, Sheikh Md Rabiul Islam, Jannatul RobaiatMou, and Md Tariqul Islam. "Design and implementation of low cost ECG monitoring system for the patient using smart device." In Electrical, Computer and Communication Engineering (ECCE), International Conference on, pp. 774-778. IEEE, 2017.
- Campillo, Daniel, Hector Torres, Rene González, Katia Valdés, and Rolando López. "A portable device for a modular system of patient ECG monitoring." In Computing in Cardiology Conference (CinC), 2014, pp. 1077-1080. IEEE, 2014.
- Ahamed, Md Asif, Md Kamrul Hasan, and Md Shahabul Alam. "Design and implementation of low cost ECG monitoring system for the patient using smartphone." In Electrical & Electronic Engineering (ICEEE), 2015 International Conference on, pp. 261-264. IEEE, 2015.
- Murugappan, M., Reena Thirumani, Mohd Iqbal Omar, and Subbulakshmi Murugappan. "Development of cost effective ECG data acquisition system for clinical applications using LabVIEW." In Signal Processing & its Applications (CSPA), 2014 IEEE 10th International Colloquium on, pp. 100-105. IEEE, 2014.
- Mitra, Sanjit Kumar, and Yonghong Kuo. Digital signal processing: a computer-based approach. Vol. 2. McGraw-Hill Higher Education, 2006.
- Fye, W. Bruce. "A history of the origin, evolution, and impact of electrocardiography." The American journal of cardiology 73, no. 13 (1994): 937-949.
- Wood, D. E., D. J. Ewins, and W. Balachandran. "Comparative analysis of power-line interference between two-or three-electrode biopotential amplifiers." Medical and Biological Engineering and Computing 33, no. 1 (1995): 63-68.
- Snellen, Herman Adrianus. Willem Einthoven (1860–1927) Father of electrocardiography: Life and work, ancestors and contemporaries. Springer Science & Business Media, 2012.
- Khandpur, R. Biomedical instrumentation: Technology and applications. McGraw-Hill Prof Med/Tech, 2004.
- Lacanette, Kerry. "A basic introduction to filters-active, passive, and switched-capacitor." National Semiconductor Corporation, http://www.swarthmore.edu/NatSci/echeeve1/Ref/DataSheet/Inttofilters.pdf (Apr. 1991) 22 (1991).
- Marieb, Elaine Nicpon, and Katja Hoehn. Human anatomy & physiology. Pearson Education, 2007.
- Kugelstadt, Thomas. "Getting the most out of your instrumentation amplifier design." SAT 1, no. 2 (2005): 2.
- Le-Huy, P., J. P. L-Huillier, Y. Omerzouk, and E. Yvroud. "Microprocessor-based ambulatory ecg monitoring system." In Computer Applications in Medical Care, 1983. Proceedings. The Seventh Annual Symposium on, pp. 917-918. IEEE, 1983.
- Malmivuo, Jaakko, and Robert Plonsey. Bioelectromagnetism: principles and applications of bioelectric and biomagnetic fields. Oxford University Press, USA, 1995.
- Anatomy and Physiology E-book by Boundless.com. Link: https://courses.lumenlearning.com/boundless-ap/chapter/the-heart/ (accessed on 6th Jan, 2018)
- http://www.bem.fi/book/19/19.htm (accessed on 6th Jan, 2018)
- Dey, Nilanjan, Sayantan Mukhopadhyay, Achintya Das, and Sheli Sinha Chaudhuri. "Analysis of P-QRS-T components modified by blind watermarking technique within the electrocardiogram signal for authentication in wireless telecardiology using DWT." International Journal of Image, Graphics and Signal Processing 4, no. 7 (2012): 33.
- Ahmad, Ashraf Adamu, Aminu Inuwa Kuta, and Abdulmumini Zubairu Loko. "Analysis of Abdominal ECG Signal for Fetal Heart Rate Estimation Using Adaptive Filtering Technique." International Journal of Image, Graphics and Signal Processing 9, no. 2 (2017): 19.
- Hartati, Sri, Retantyo Wardoyo, and Budi Yuli Setianto. "The Feature Extraction to Determine the Wave’s Peaks in the Electrocardiogram Graphic Image." International Journal of Image, Graphics and Signal Processing 9, no. 6 (2017): 1.
