Trace-element analysis by laser ablation inductively coupled plasma mass spectrometry (LA-ICP-MS): a case study for agates from Nowy Ko'sciol, Poland
: a case study for agates from Nowy Ko'sciol, Poland")
Author: Mckel Robert, Gtze Jens, Sergeev Sergey A., Kapitonov Igor N., Adamskaya Elena V., Goltsin Nikolay A., Vennemann Torsten
Journal: Журнал Сибирского федерального университета. Серия: Техника и технологии @technologies-sfu
Article in issue: 1 т.5, 2012.
Free access
trace elements in agate from Permian volcanics (Nowy Kościoł, Poland) in low concentrations and with high spatial resolution. The used LA-ICP-MS system consists of a DUV 193 laser ablation system linked to a Thermo Finnigan Element 2 mass spectrometer. The use of a 193 nm ArF excimer laser (50-200 mJ energy output) and the standards NIST 611 and NIST 612 enables to produce and analyse small crater diameters down to 5 μm. Trace-element profiles have been analyzed for the elements Ti, Ge, Al, Fe, Mn, U, Th, Ba, Sr, Rb, Cs, and Y in the ppm- and sub-ppm level. The concentrations of the REE are sometimes below the detection limit of the method. Almost all elements (except Cu) display higher contents in chalcedony than in the macrocrystalline quartz. Fe, for instance, shows a 100 times higher concentration in agate bands compared to quartz, which may be due to finely distributed iron oxide particles in the chalcedony which probably act as colour pigments. The trace elements in agate are released simultaneously with Si during alteration of the surrounding volcanic rocks. Oxygen isotope data indicate that silica accumulation and agate formation took place at temperatures below 120°C. The characteristic trace-element distribution patterns in agate result from a self-purification process during crystallization of chalcedony and quartz from a silica gel.
Agate, quartz, trace elements, la-icp-ms, oxygen isotopes, cl, nowy kościόł
Short address: https://sciup.org/146114628
IDR: 146114628 | UDC: 621.315.592
Трассировочный анализ кривых с помощью метода лазерной абляции с индуктивно связанной плазмой масс-спектрометрией (LA-ICP-MS): на примере агатов из Нового Костела, Польша
Метод лазерной абляции с индуктивно связанной плазмой масс-спектрометрией (LA-ICP-MS) был применен для обнаружения следов элементов в агатах из пермских вулканитов (Новый Костел, Польша), имеющих низкие концентрации и высокие пространственные разрешения. Используемая система LA-ICP-MS состоит из DUV 193 системы лазерной абляции, связанной с термоэлементом Finnigan 2 масс-спектрометра. Применение 193 нм ArF эксимерного лазера (с выходом 50-200 мДж) и стандарта NIST 611 и NIST 612 позволили получить и проанализировать кратеры малого диаметра до 5 мкм. Были проанализированы кривые следующих элементов Ti, Ge, Al, Fe, Mn, U, Th, Ba, Sr, Rb, Cs и Y на уровнях
Text of the scientific article Trace-element analysis by laser ablation inductively coupled plasma mass spectrometry (LA-ICP-MS): a case study for agates from Nowy Ko'sciol, Poland
Agates are banded forms of microcrystalline α-quartz (chalcedony) and often form spectacular, multicoloured geodes or veins. These forms of SiO2 can be found all over the world [1]. Despite the intense research concerning the conditions of agate formation during the last 150 years, detailed theories and suggestions are widespread and still controversely discussed (e.g. [2,3]). During the last decades, modern analytical methods such as fluid inclusion studies, oxygen isotope and trace-element analysis or luminescence microscopy and spectroscopy have been more involved into agate research (e.g. [4,2,5,6,7,8,9,10,11]). Nevertheless, many of the genetic problems are still unresolved and specific aspects have not been studied yet.
1. Materials and Methods
The agate material investigated in the present study originates from occurrences in the vicinity of Nowy Kościόł (Lower Silesia, Poland). The agate outcrops occur at the bottom part of Permian rhyolites and rhyodacites close to the contact with Middle Rotliegend tuffs and Upper Permian claystones [18]. Porphyric nodules are mostly spherical shaped and can reach sizes of 2–70 cm in diameter. The agates from Nowy Kościoł show both chalcedony bandings and macrocrystalline quartz zones. They are typically multicoloured fortification agates with shades of white, reddish, green, brown and yellow (Fig. 1). Several accessoric phases have been detected in the agates including hematite, sulphide minerals and monazite [18,19]. A specific feature is the occurrence of organic matter (aliphatic and subordinately aromatic compounds), which has been related to the postgenetic alteration of the volcanic rocks [19].
The phase composition of the volcanic host rocks was determined by X-ray diffraction (XRD) studies. Therefore, material from the surrounding adjacent host rock of the agates was separated and – 4 –
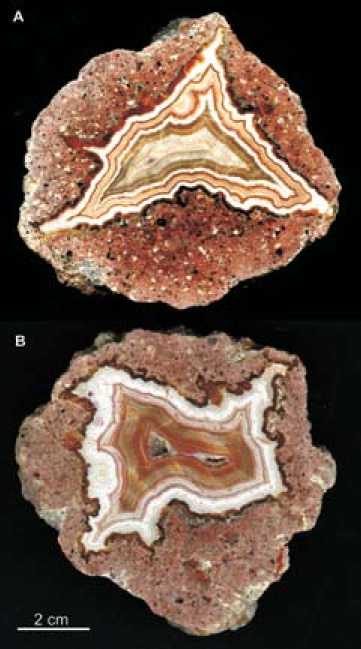
Fig. 1. Multi-coloured volcanic agates from Novy Kościόł (Poland) with typical fortification banding grinded to <20 µm grain size. An URD 6 XRD device (Seifert/Freiberger Präzisionsmechanik) with CoKα radiation was used and the irradiated area was kept constant at 15 mm². Samples were scanned with 2θ-steps of 0.03° in the range from 5–80° at step times of 5 seconds per step. Quantification of powder diffraction patterns was carried out using the Rietveld algorithm BGMN [20].
Polished thin sections of agates and surrounding host rocks were prepared for microscopic studies (ZEISS Axio Imager A1m) to get information about internal agate structures. In addition, CL measurements on carbon coated thin sections were performed using a “hot cathode” CL microscope HC1-LM [21]. The system was operated at 14 kV accelerating voltage and a current density of about 10 µA/mm2. Luminescence images were captured “on-line” during CL operations using a peltier cooled digital video-camera (KAPPA 961-1138 CF 20 DXC). CL spectra in the wavelength range 380 to 900 nm were recorded with an Acton Research SP-2356 digital triple-grating spectrograph with a Princeton Spec-10 CCD detector that was attached to the CL microscope by a silica-glass fibre guide.
Oxygen isotopic studies on macrocrystalline quartz and chalcedony were performed by a microanalytical laser-based method at the University of Lausanne, Switzerland. Small samples free of visible microinclusions were placed on a nickel sample holder and were heated with a 20 W CO 2 laser, while fluorinating due to BrF5 atmosphere. The released oxygen was converted to CO2 by combustion with a hot carbon rod after passing over a cold trap and through a hot mercury fluorine-getter and then – 5 –
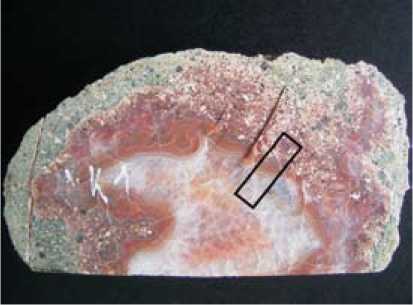
Fig. 2. Selected agate from Novy Kosciol (Poland) for detailed LA-ICP-MS investigations; the rectangle repre-sents the prepared area for the trace-element profile
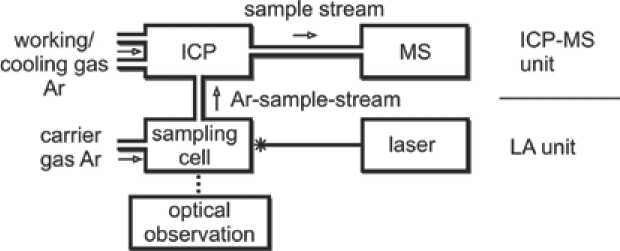
Fig. 3. Schematic sketch of the LA-ICP-MS device admitted on-line to the mass spectrometer. The precision and accuracy of the method is ± 0.1 ‰ for < 100 µg samples [22].
For trace-element analysis by LA-ICP-MS, a section perpendicular to the agate banding was cut, polished and fixed with epoxy resin in a 1 inch diameter ring, which fits in the sampling cell of the LA-ICP-MS device (see marked area in Fig. 2). Measurements were performed at the VSEGEI (St. Petersburg, Russia) on a system with a Thermo Finnigan Element 2 mass spectrometer, linked to a DUV 193 laser ablation system including optics and viewing by New Wave Research/Merchantek Products . A principle sketch of a LA-ICP-MS system is given in Figure 3. The ArF excimer laser operates with a wavelength of 193 nm and an energy output of 50–200 mJ. This constellation enables to produce and analyse small crater diameters down to 5 µm. The two accredited standards NIST 611 and NIST 612 were used for calibration procedures [23]. Calibration procedures were made at the beginning and at the end of the measuring cycle and after analysing five spots, mainly in order to minimize memory effects. The parameters of the system are given in Table 1.
Trace elements were classified concerning possible overlapping of their mass/charge ratio and first measured with low resolution (LR, R=300) and medium resolution mode (MR, R=4000), respectively. Table 2 shows the modes for the measured isotopes. Isotopes were selected considering natural abundances. However, the higher resolution mode is opposite to intensity and therefore, to the – 6 –
Table 1. Technical parameters of the LA ICP-MS system
|
Excimer Laser Compex Energy output pulse duration/repetition frequency beam diameter |
50–200 mJ 15 ns/ 1–20 Hz 5–300 µm |
|
carrier gas flow (ablation cell) Thermo Finnigan Element 2 type auxiliary gas flow cooling gas flow |
approx. 1 l/min (optimized automatically) sector field mass spectrometer approx. 1 l/min (optimized automatically) approx. 15 l/min (optimized automatically) |
|
power |
approx. 1 kW |
Table 2. Selected isotopes for LA-ICP-MS measurements (LR low resolution mode, MR medium resolution mode). Distributions of trace elements printed in bold letters are displayed in Figs. 7 and 8.
LR 7Li, 27Al, 28Si, 29Si, 44Ca, 60Ni, 69Ga, 71Ga , 72Ge, 74Ge, 85Rb, 88Sr, 89Y, 133Cs , 138Ba, 139La, 140Ce, 141Pr,
142Nd, 146Nd, 147Sm, 151Eu, 153Eu, 155Gd, 157Gd, 159Tb, 161Dy, 163Dy, 165Ho, 166Er, 167Er, 169Tm, 172Yb, 173 Yb, 175 Lu, 232 Th, 238U
MR Na12 , 29Si, 30Si, 47Ti, 55Mn, 56Fe, 57Fe, 59Co, 60Ni, 62Ni, 63Cu, 65Cu
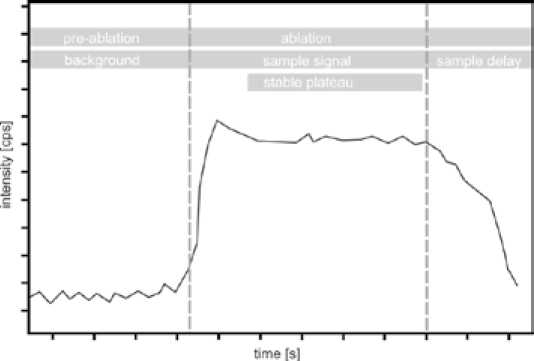
Fig. 4. A simplified diagram of a typical LA-ICP-MS signal for one element displaying three different phases
2. Results and discussion
Agate formation and structure
The XRD analyses provided first results concerning the mineral composition of the adjacent host rocks of the agates (Table 3). The fresh material is dominated by quartz and K-feldspar and represents a rhyolitic composition. Alteration processes resulted in a loss of amorphous material (glassy matrix) and feldspar, respectively and the formation of clay minerals (especially illite). The illitization of the volcanic host rocks can be one of the processes providing silica for the agate formation.
For the estimation of formation temperatures, δ18O values were measured for the silica matrix. The δ18O SMOW data of the analyzed agate range from 29.36 ‰ (quartz) to 30.25 ‰ (chalcedony) (Table 4). Because of the unknown origin of the participating fluids, the temperatures were calculated for different sources according to Méheut et al. [26] (see Table 4). The calculations point to relatively low temperatures between 20°C and 120°C. These results are in accordance with measured homogenization temperatures of primary fluid inclusions in quartz, which scatter between 100 and 215°C [27].
The agates itself are typically banded with alternate bedding of chalcedony bands and macrocrystalline quartz layers (Fig. 5a). Isolated spherulitic silica growth is common (Fig. 5b), and areas with macrocrystalline quartz have formed in the central and marginal parts of the agates (Fig. 5c). In some cases, the transition from quartz to chalcedony is sharp. Iron oxides are often interbedded along the crystallization front of chalcedony, probably resulting from a “self-purification” process of originally iron-rich silica.
CL imaging revealed several differently coloured zones within the agates. The chalcedony layers display reddish, rose and orange colours (Fig. 5). Phanerocrystalline quartz may exhibit similar CL colours as the surrounding chalcedony, but sometimes more bluish CL colours and distinct complex zoning (both sector and concentric zoning) (Fig. 5). The comparison of the differently luminescent agate bands and macrocrystalline quartz (Fig. 6) illustrates that the CL spectra generally consist of the same emission bands. The different CL colours and intensities, respectively, are a result of varying intensity ratios of the main CL emission bands. The most common and most intense CL emission – 8 –
Table 3. Phase composition of adjacent host rocks of the investigated agates determines by XRD analysis (contents in weight-%)
|
Fresh host rock (greyish brown) |
Altered host rock (greenish) |
|
|
Quartz |
35 ± 2 |
35 ± 1 |
|
Monoclinic K-feldspar |
40 ± 2 |
38 ± 2 |
|
Plagioclase |
6 ± 1 |
5 ± 1 |
|
Kaolinite |
2 ± 1 |
4 ± 1 |
|
Illite |
2 ± 1 |
9 ± 1 |
|
Amorphous |
15 ± 4 |
10 ± 3 |
Table 4. Oxygen isotope data of agate and quartz with calculated temperatures according to [26]; the temperatures are calculated for fractionation with meteoric water (-10‰), oceanic water (±0‰) and magmatic water (+8‰)
Other emission bands (450 nm, 580 nm) appear only subordinately, partly as shoulder of the main CL emission (Fig. 6). The yellow CL emission (580 nm), which can be related to the E’ centre (electron defect on an oxygen vacancy), was up to now only observed in agates, silicified wood and hydrothermal quartz [9,11,31]. The emission band around 450 nm, which is especially present in macrocrystalline quartz, is due to the recombination of the so-called self-trapped exciton [29], an electron hole pair on an oxygen vacancy and a peroxy linkage. The oxygen vacancies may indicate crystallization under conditions with oxygen deficit.
The results of the microscopic studies indicate that the agate crystallized in a continuous process from a silica-rich precursor. Crystallization started with spherulitic growth and the formation of chalcedonic quartz, later changing into well developed crystals. Accordingly, the phanerocrystalline quartz seems to be the prosecution of chalcedony “fibres”. The high defect density and the occurrence of sector zoning in quartz may result from rapid crystallization under non-equilibrium conditions. Except for the outermost layer of chalcedony, CL colours and spectra are almost the same in both quartz and chalcedony and display a similar local defect structure, which implies the origin from a single ongoing crystallization process. The sometimes observed repeated change between chalcedony and macrocrystalline quartz layers may result from changes in the silica concentration of the mineralizing fluids or from several mineralization stages.
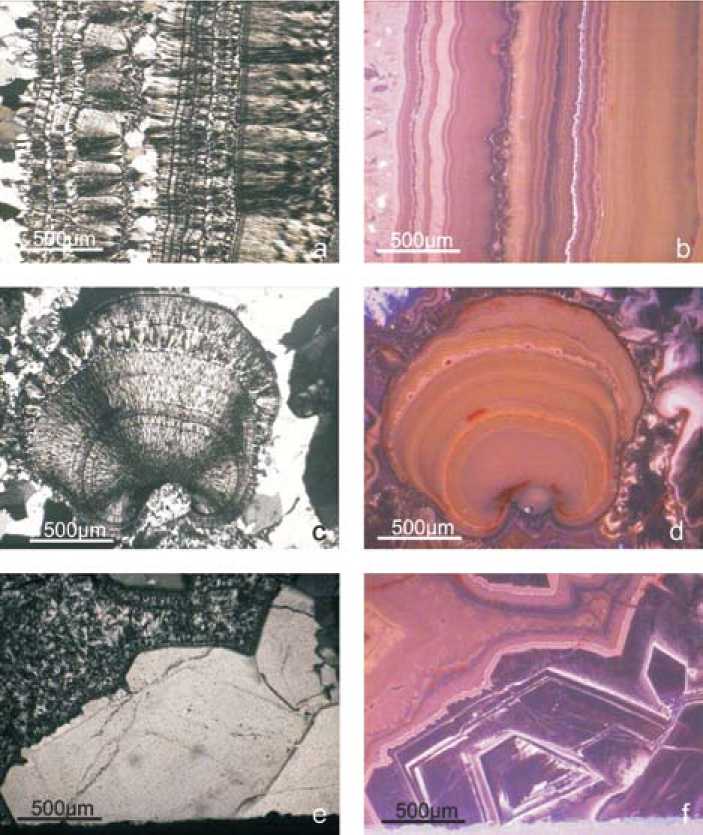
Fig. 5. Polarized light (Pol) and cathodoluminescence (CL) micrograph pairs of the investigated agates from Novy Kościόł (Poland); (a) alternate bedding of chalcedony bands and macrocrystalline quartz layers showing varying CL colours; (b) spherulitic chalcedony growth with distinct internal structure; (c) strongly zoned macrocrystalline quartz
Trace element studies by LA-ICP-MS
The results of the present study show that most of the measured trace-elements are present in very low concentrations. Because of the specific analytical conditions, the limits of detection vary for different elements (Table 5). Therefore, the strategy of the analytical procedure was to lower the limits of detection by repeated “laser shots” (more sample material) and valuable standard materials. Nevertheless, concentrations of some elements were below the detection limits. For example, the contents of the rare earth elements (REE) did not provide important data in terms of REE distribution patterns.
Problems during measurements appeared with Ca and Ni. Ni is part of the cone material of the skimmer technology of the mass spectrometer. Ni was measured in LR as well as MR mode (see – 10 –
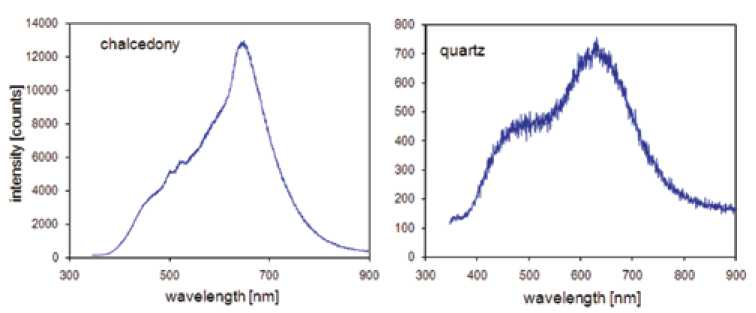
Fig. 6. Typical CL spectra from chalcedony and macrocrystalline quartz; the CL spectrum of quartz shows two broad emission bands at 450-500 nm and ca. 650 nm; the CL of chalcedony is dominated by a strong emission band at 650 nm and shows at least three additional bands (shoulders) at 580, 500 and 450 nm
Table 5. Average trace-element contents and variation limits (in ppm) of the investigated profile perpendiculat to the agate banding (see Fig. 2) (quartz: measunring points 1–7; agate: measuring points 8–12)
|
average |
quartz |
agate |
||||
|
max |
min |
average |
max |
min |
||
|
Li |
1.01 |
2.77 |
0.03 |
2.73 |
4.69 |
0.84 |
|
Na |
24.0 |
59.2 |
1.35 |
192.3 |
294.1 |
106.7 |
|
Al |
13.7 |
47.2 |
2.71 |
325.4 |
640.8 |
58.0 |
|
Ge |
0.63 |
1.06 |
0.32 |
12.12 |
20.42 |
7.42 |
|
Rb |
0.12 |
0.17 |
0.07 |
1.60 |
3.05 |
0.66 |
|
Sr |
0.07 |
0.09 |
0.03 |
3.29 |
7.58 |
0.48 |
|
Ba |
1.40 |
0.37 |
0.03 |
5.00 |
6.38 |
0.19 |
|
Y |
0.01 |
0.02 |
0.01 |
0.20 |
0.62 |
0.03 |
|
La |
0.09 |
0.09 |
0.08 |
– |
– |
– |
|
Ce |
0.10 |
0.12 |
0.08 |
0.04 |
0.12 |
0.01 |
|
Nd |
0.03 |
0.03 |
0.03 |
0.05 |
0.05 |
0.05 |
|
Sm |
0.02 |
0.02 |
0.01 |
– |
– |
– |
|
Eu |
– |
– |
– |
0.01 |
0.01 |
0.01 |
|
Gd |
– |
– |
– |
0.03 |
0.04 |
0.01 |
|
Dy |
– |
– |
– |
0.04 |
0.08 |
0.01 |
|
Ho |
– |
– |
– |
0.03 |
0.03 |
0.03 |
|
Er |
– |
– |
– |
0.03 |
0.04 |
0.01 |
|
Tm |
– |
– |
– |
0.01 |
0.01 |
0.01 |
|
Yb |
– |
– |
– |
0.06 |
0.06 |
0.06 |
|
Th |
0.37 |
0.37 |
0.37 |
0.02 |
0.03 |
0.01 |
|
U |
0.15 |
0.02 |
0.52 |
2.39 |
3.37 |
1.81 |
|
Ti |
<1 |
<1 |
<1 |
1.20 |
3.40 |
<1 |
|
Mn |
<1 |
<1 |
<1 |
0.61 |
1.39 |
<1 |
|
Fe |
0.95 |
2.62 |
<1 |
90.4 |
119.8 |
69.3 |
(-) below detection limit
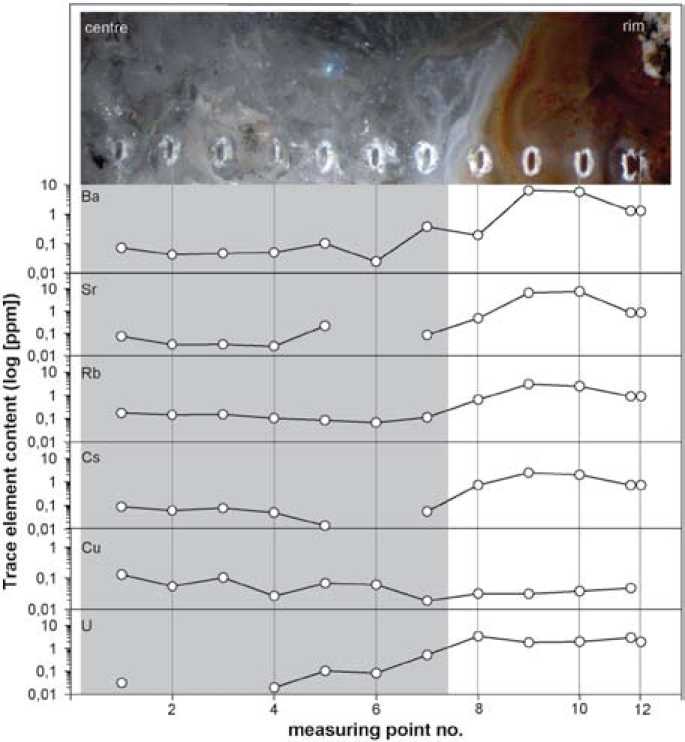
Fig. 7. Distribution profiles of selected trace elements (Ba, Sr, Rb, Cs, Cu, U) in the investigated agate from Novy Kościόł (Poland)
Table 2), mostly in order to avoid overlapping with other isotopes (e.g. 44Ca16O, 24Mg36Ar). However, measured values differed sometimes more than 50% and therefore, have been not reliable. The 44Ca values were mostly unreliable as well due to overlapping with 28Si16O, which is basic matrix material. A higher resolution mode for Ca or the use of another inert gas instead of argon (40Ar overlaps 40Ca), respectively, may prevent this problem. In the present study, the problem was tried to solve by an afterwards calculation of a 28Si16O-blank. Although the measured Ca contents are similar to concentrations (330–634 ppm) reported by [19], there was still some doubt on the reliability of these corrected values and therefore, they will not be presented here.
A number of trace-elements could be analyzed with high precision. The results of the traceelement analyses are given in Table 5 (average values and limits of variation). The spatial distribution of selected element contents is presented in Figures 7 and 8.
The comparison of the data from Nowy Kościόł with trace element contents of agates from different regions [3,10] revealed that concentrations presented here are slightly below other published values, but more or less in the same order of magnitude. In general, it is obvious that a number of – 12 –
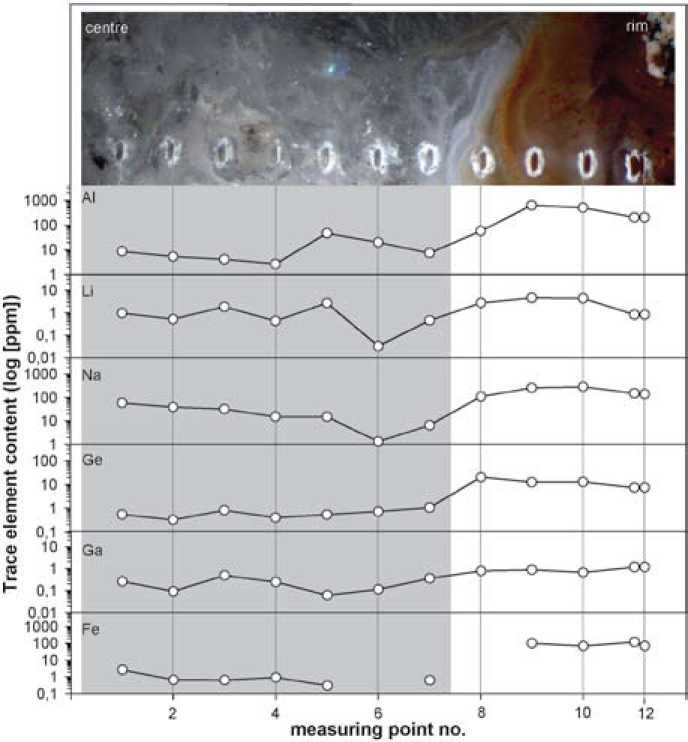
Fig. 8. Distribution profile of selected trace elements (Al, Li, Na, Ge, Ga, Fe) in the investigated agate from Novy Kościόł (Poland)
elements is accumulated in agate. Besides the common elements Al, Fe, and Na, also Ba, Sr, U and Ge show relatively high concentrations. These elements may be mobilized together with Si during the alteration of the volcanic host rocks. The decomposition of volcanic glass and feldspar provides high amounts of Si, Al, Ca, Na and K. The mobility of U during the alteration of volcanic rocks was reported by Zielinski [32] who observed the parallel accumulation of Si and U. In the case of Ge, the identical geochemical character with Si promotes the common transport and the incorporation of Ge into the quartz structure [33,34]. Therefore, high concentrations of Ge are typical for agates from acidic host rocks [3].
One characteristic feature of the trace-element distributions is that almost all elements show higher contents in chalcedony compared to macrocrystalline quartz (Fig. 7 and 8). Aluminium, for instance, has an average concentration of 325.4 ppm in chalcedony and 13.7 ppm in quartz. Fe shows a hundred times higher concentration in chalcedony parts (average 90.4 ppm) than in the quartz centre (average 0.95 ppm). The only exception for this is Cu, which is slightly enriched in quartz (average of 0.07 ppm) compared to chalcedony (average 0.04 ppm). Moreover, elements which behave geochemically similar – 13 – such as Ba and Sr or Rb and Cs display comparable patterns (Figure 7). These similar patterns suggest a simultaneous mobilization and precipitation of the elements.
The differences in most element concentrations between chalcedony and quartz can probably be explained by a “self-purification” process during the crystallization of the agate. The trace elements are firstly precipitated together with the primary silica gel and are finely dispersed in the silica matrix. Starting spherulitic growth of the chalcedony may initially incorporate high contents of trace elements. During further growth, the concentration of impurities drops, which is macroscopically detectable in the changing visible colour of the agate bands. In general, deeply coloured parts of the agate inherit higher trace-element concentrations than colourless parts. For example, the outermost measuring points are situated in a dark reddish band and reveal in almost all cases higher element contents, whereas the colour gets more and more light towards the inner core.
Heaney [35] stated that the high trace-element contents in silica can cause the formation of frequent defects, Brazil twinning and typical twisting in chalcedony. He concluded that chalcedony fibres in agates may be the result of dislocation growth. This statement would explain why macrocrystalline quartz can only grow after removing most of the impurities. The transition zone between chalcedony and quartz is characterized by a characteristic drop of most trace-element contents. On the other hand, the higher defect density in chalcedony was also detected by CL spectroscopy.
The kind of incorporation of various trace elements into quartz can be different [34]. Whereas Al, Ti, Ge, Fe, Na or Li are often substitute for Si or placed at interstitial lattice positions, elements such as Ba, Sr, Rb, Cs or U may be concentrated in fluid and mineral inclusions or at grain boundaries. However, the incorporation into the quartz structure is limited as is visible for iron. The occurrence of high iron contents and sometimes iron oxides within the agate matrix is an indication for high iron contents of the silica-bearing mineralizing medium. The accumulation of hematite spheres along the banding of the next chalcedony layers may be a result of the “selfpurification” of chalcedony during crystallization. The iron was removed from the silica during crystallization, moved with the crystallization front and accumulated forming iron oxide spheres. Especially the coloured agate bands exhibit high concentrations of iron emphasizing that iron is mostly concentrated in fine iron oxide particles within the chalcedony layers acting as colour pigments.
3. Conclusions
The results of the present study clearly demonstrate that LA-ICP-MS is a suitable analytical method for the detection of trace elements in very low concentrations. Although the element contents of most of the elements in quartz are in the ppm and sub-ppm level, the method enables to realize a spatially resolved analysis. Therefore, the method provides valuable data for genetic interpretations in samples with marked micro- and/or macro-textures. Only for a few elements (especially the REE), the concentrations are often too low to be detected by LA-ICP-MS.
The trace-element analysis with high spatial resolution enabled to monitor the distribution of specific elements during proceeding agate formation. One characteristic feature is the release of elements (e.g., Al, Fe, Ge) together with Si from the volcanic host rocks due to the ongoing alteration, and the subsequent accumulation within the silica matrix during agate formation. Elements showing a similar geochemical behaviour (e.g., Ba-Sr or Rb-Cs) display identical spatial distribution pattern – 14 – within the agate texture. Most of the impurities precipitate at the beginning of the agate formation, whereas further growth and crystallization of the silica matrix results in lower impurity concentrations. Within the last-stage macrocrystalline quartz in the agate centre, trace-element contents are very low or even not detectable. These facts point to a “self-purification” process of the silica matrix during ongoing crystallization, sometimes resulting in the admixture of impurity phases (e.g. iron oxides/-hydroxides).
Acknowledgement
We gratefully acknowledge providing of agate samples from Novy Kościόł by Marek Stepisiewicz (Warsaw). We also thank Dmitry Sergeev for helping a lot to overcome language barriers at the VSEGEI St. Petersburg.
Трассировочный анализ кривых с помощью метода лазерной абляции с индуктивно связанной плазмой масс-спектрометрией (LA-ICP-MS):
