Trade and investment interactions in the Asia-Pacific Region: Effects of integration agreements

Author: Izotov D.A.
Journal: Economic and Social Changes: Facts, Trends, Forecast @volnc-esc-en
Section: Global experience
Article in issue: 5 т.18, 2025.
Free access
The aim of the work is to provide a long-term assessment of the impact of integration agreements on trade and investment interactions between Asia-Pacific countries in 1992–2023. It is determined that the Asia-Pacific region accounts for the largest share of trade and investment interactions worldwide, with intraregional trade in goods and direct capital flows being the main source. The study shows that, in terms of reducing trade and economic barriers between countries, integration agreements can be classified into shallow and deep agreements, with the Asia-Pacific region taking the lead in their creation. Based on a database compiled from various sources on trade and capital flows between Asia-Pacific countries, and using gravity modeling, the long-term cumulative effects of shallow and deep integration agreements on trade and the inflow of accumulated foreign direct investment (FDI) are estimated. The general stimulating effect of integration agreements on trade among Asia-Pacific countries was identified as increasing trade by an average of 21.9%, while their influence on FDI inflow was found to be invariant. We found that shallow integration agreements between Asia-Pacific countries reduced FDI inflows by 47.5% and promoted trade growth by 46.0%; as for deep integration agreements, they increased trade volumes between Asia-Pacific countries by 15.5% and FDI inflows by 23.6%. It was shown that, within the Asia-Pacific region, shallow and deep integration agreements conflicted with each other in terms of attracting FDI. Due to the suppression of FDI inflows by trade in goods and the longer duration of shallow agreements, their long-term cumulative trade effect was greater than that of deep agreements. Deep integration agreements encouraged both trade and direct capital flows between Asia-Pacific countries, pointing to the creation of conditions for complementarity between trade and FDI within more advanced formats of economic convergence aimed at reducing production cooperation costs. Unlike trade, FDI exchange in the Asia-Pacific region proved to be more sensitive to existing barriers to economic interaction and less flexible toward recipient countries of such investments
Trade, foreign direct investment, deep integration agreements, shallow integration agreements, gravity model, integration effect, globalization, regionalization, Asia-Pacific region
Short address: https://sciup.org/147252470
IDR: 147252470 | UDC: 339.9+339.5+338.2 | DOI: 10.15838/esc.2025.5.101.12
Text of the scientific article Trade and investment interactions in the Asia-Pacific Region: Effects of integration agreements
Despite the current manifestations of protectionism and fragmentation in the global economy (Afontsev, 2020; Baldwin, Ruta, 2025), over the past more than three decades, almost all countries worldwide have achieved significant progress in reducing barriers to economic interactions, including through mechanisms of concluded bilateral and multilateral integration agreements. The most important elements of economic interactions between countries are trade in goods and the exchange of direct investments (Larch, Yotov, 2023). Within modern integration frameworks, trade in goods is regulated at both the global (WTO) and sub-global (regional) levels. Meanwhile, the exchange of direct investments between countries occurs solely on the basis of regional integration agreements. Due to the absence of opportunities to create more advanced forms of integration at the global level, over the past two decades, two large groups of integration agreements have become increasingly distinct at the regional level (Mattoo et al., 2020; Larch, Yotov, 2024). The first group is shallow integration agreements, which aim to reduce tariff and nontariff barriers in trade in accordance with WTO principles. The second group is deep integration agreements, which envision freer movement of goods, services, capital, labor, and technology between countries, as well as regulation of powers by state authorities and control over exporters to protect consumer rights in importing countries – measures that go beyond the WTO framework. Under the conditions of most of the world’s countries joining the WTO1, a process of mass conclusion of deep integration agreements has been observed, alongside stagnant trends in the dynamics of shallow integration agreements.
Empirical estimates show that these two groups of integration agreements have stimulated global trade (Mattoo et al., 2022; Park, 2025), while their impact on foreign direct investment (FDI)2 has been ambiguous (Kox, Rojas-Romagosa, 2019; Larch, Yotov, 2023). On one hand, the reduction of only trade barriers within shallow integration agreements can have a restraining effect on FDI attraction, since in this case, trade substitutes for direct investment from abroad (Kox, Rojas-Romagosa, 2020), for which barriers, in turn, persist. On the other hand, beyond the removal of trade restrictions, the reduction of other economic barriers can have a stimulating effect on both trade and investment interactions between countries. In this case, trade in goods and the exchange of direct capital are complementary within the framework of deep integration agreements (Anderson et al.,
2019). This aspect is particularly important for the functioning of global value chains, linking inflows of FDI with subsequent exports of goods, including intermediate ones (Martinez-Galan, Fontoura, 2019).
Among the world’s largest regions, deep integration agreements have become significantly widespread in the Asia-Pacific Region (APR)3, which accounted for a large share of the global economy—approximately 60% of global GDP on average from 1992 to 20234. Over the past four decades, the main incentive for integration processes in the APR has been production cooperation among East Asian countries (Park, 2020) aimed at stimulating the “vertical” trade of transnational corporations (Hummels et al., 2001). Acting as the “core” of integration processes in the APR, East Asian countries generally contributed to the further spread of integration agreements with countries in North and South America, as well as Australia and Oceania, by reducing barriers to trade and FDI inflows. Empirical research points to positive effects from the reduction of barriers to the exchange of goods and direct capital in the APR (Lakatos, Walmsley, 2012; Bouet et al., 2012) for lowering the costs of trade and economic interactions (Pomfret, Sourdin, 2009; Kimura et al., 2021). Amid the foreign policy confrontation between groups of countries (Jackson, Shepotylo,
2023; Aiyar et al., 2024; Potapov, 2025), and due to existing limitations for further liberalization of foreign economic relations in a number of the region’s economies (Chaisse, Hsieh, 2023), signs of fragmentation in the economic space have recently become noticeable in the APR from the perspective of China’s confrontation with a number of regional countries. This resulted in the creation of the Comprehensive and Progressive Agreement for Trans-Pacific Partnership (CPTPP)5. Nevertheless, this process did not lead to the formation of closed trade and economic blocs; on the contrary, it stimulated the expansion of integration agreements and the creation of “compromise” formats in the APR, particularly the Regional Comprehensive Economic Partnership (RCEP)6, thereby mitigating potential risks of fragmentation.
Assessments of the long-term comparative impact of integration agreements on trade and investment interactions in the APR are insufficiently studied, as they primarily focus on East Asian countries (Ing et al., 2019) and do not cover the period of the current foreign policy confrontation in the region. It should be noted that there is some skepticism regarding the positive trade effects for a number of shallow integration agreements (Herz, Wagner, 2011). Based on this, it can be assumed that within the APR, deep integration agreements contributed to a greater expansion of trade among member countries compared to shallow integration agreements. It can also be assumed that deep integration agreements stimulated FDI attraction, since this type of agreement extends barrier reduction mechanisms to factor markets, a key one being capital. Thus, within the APR, all else being equal, shallow and deep integration agreements might be conflicting for FDI inflows. Relying on these assumptions, it is important to emphasize how the influence of globalization and regionalization processes on trade and investment interactions in the APR correlates, and to what extent this influence is differentiated for flows of goods and capital within this region.
Consequently, the aim of this study is a longterm assessment of the impact of integration agreements on trade and investment interactions among countries in the Asia-Pacific Region (APR). The research algorithm involves addressing the following tasks: 1) analysis of the dynamics of trade, FDI, and integration agreements in the APR; 2) formation of a dataset and selection of an evaluation methodology; 3) assessment of the longterm impact of integration agreements on trade and investment interactions among APR countries. Within this study, the assessment of the impact of integration agreements on inflows of foreign direct investment was based on accumulated FDI stocks7, which, compared to flow values, are characterized by lower volatility and contain far fewer zero and negative values (Kox et al., 2020). The effects of FDI inflows extend to the economy of the host country and are more complex compared to capital outflows, generally contributing to an increase in its market capacity, the creation of production facilities (including export-oriented ones), the attraction of technologies, and an increase in employment and population income (Hassan, 2022). To avoid double counting, trade interactions were assessed using the flow of mutual exports between APR countries. The research covers the period 1992–2023.
Trade-investment interactions and integration agreements among APR countries
During the period under review, trade and investment interactions among APR countries increased substantially. The total exports from APR countries increased more than 7-fold in current prices – from USD 1.6 trillion in 1992 to USD 11.9 trillion in 2023, while the accumulated inflow of FDI into the region’s countries increased almost 21-fold – from USD 1.3 trillion to USD 27.7 trillion, respectively (Fig. 1).
In 2023, APR countries accounted for half of global exports, an increase of 7 percentage points compared to 1992. Meanwhile, the share of intra-regional exports rose by 10 percentage points – from 61.4% in 1992 to 71.4% in 2023, indicating a strengthening of trade interdependence among APR countries ( Fig. 2 ).
As a result, intra-regional exports in the APR increased 8.5-fold: from USD 1.0 trillion in 1992 to USD 8.5 trillion in 2023. An increase was also observed in the share of APR countries in the global stock of inward FDI – from 53.3% in 1992 to 56.4% in 2023. The share of APR countries in global FDI inflows showed a tendency to increase, except for the early 2020s (COVID-19 pandemic and intensification of foreign policy risks) (Izotov, 2024). FDI inflows into APR countries were shaped by intra-regional investments, whose value increased more than 21-fold – from USD 0.9 trillion in 1992 to USD 20.2 trillion in 2023. At the same time, significant volatility was observed in the share of intra-regional FDI inflows. Although a trend of increasing the share of direct investments from countries located outside the region has been recorded since the early 2010s, nevertheless, on average over the period under review, intra-regional sources accounted for more than 70% of FDI inflows into the APR.
The exchange of goods and capital within the APR framework was the main source of foreign economic interactions for the region’s countries. These interconnections in the APR were based on the reduction of various kinds of barriers, including those related to the conclusion of bilateral and multilateral integration agreements, which are divided into deep and shallow. Until the early 2000s, shallow integration agreements played the
Figure 1. Exports (left axis) and FDI inflow (right axis) of APR countries, billion USD
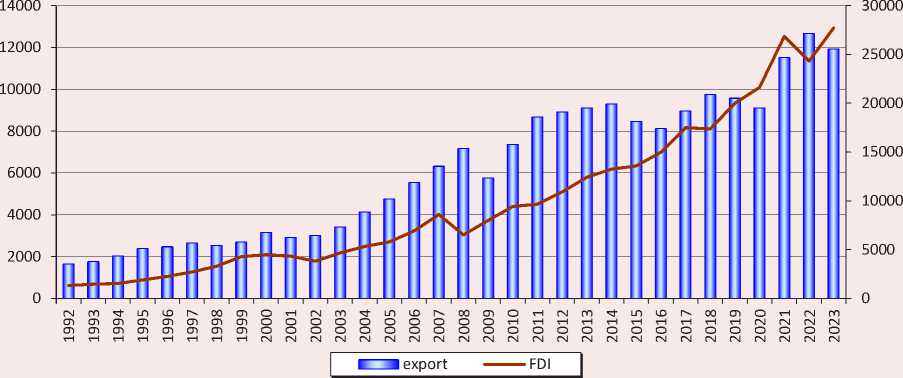
Source: World Integrated Trade Solution. World Bank. Available at: Page=Default; Trade Structure. UNCTADstat. Available at: aspx; Foreign direct investment: Inward and outward flows and stock. UNCTADstat. Available at: datacentre/dataviewer/US.FdiFlowsStock
Figure 2. APR trade and investment: share in the global economy and share in intra-regional flows, %
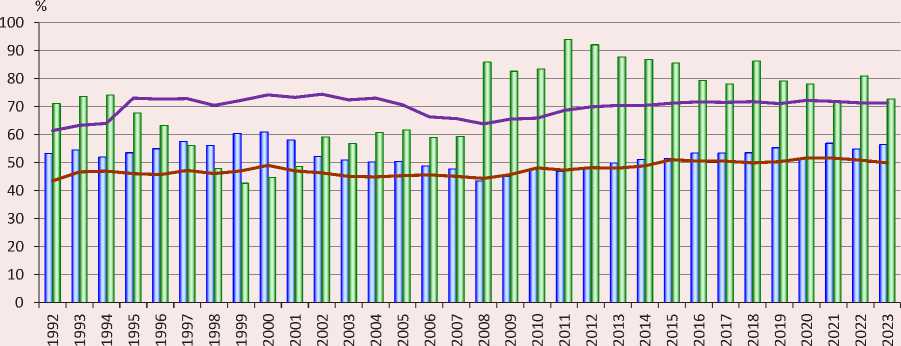
■ I Share of the APR in global FDI Share of intra-regional FDI
^^^^^^^^м Share of the APR in global exports ^^^^^^^^м Share of intra-regional exports main role in the regionalization process within the APR. These included agreements primarily aimed at reducing barriers in trade in goods, i.e., partial scope agreements (PSA)8, free trade agreements (FTA)9, and customs unions (CU)10. However, subsequently, shallow integration agreements gave way to more advanced forms of integration (Fig. 3).
From the first half of the 2000s, a fundamentally new process in the APR was the increase in the number of concluded FTAs in an expanded format (FTA+), which by all formal criteria belonged to deep integration agreements. A process of creating multilateral FTA+s began to be observed, for example, the CPTPP and RCEP, which occupy a significant share in the trade and investment exchange among APR countries11. The potential accession of other APR countries to RCEP and CPTPP increases opportunities for enhancing their trade and investment potential (Petri, Abdul-Raheem, 2014; Park et al., 2021). It should also be noted that some shallow integration agreements among APR countries, as new members joined and amendments were made, transitioned into the category of deep integration agreements. In some cases, these functioned as shallow agreements for a short period, typically within a transitional period.
From a functional perspective, deep integration agreements facilitate both trade and investment interactions among APR countries. Shallow integration agreements stimulate only the exchange
Figure 3. Deep (left axis) and shallow (right axis) integration agreements among APR Countries, units
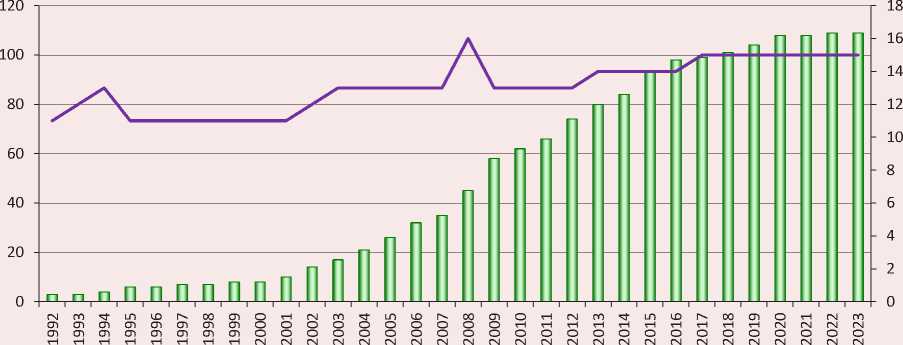
■ — ■ Deep integration agreements ^^^^^^^^м Shallow integration agreements
Note: data are presented on a cumulative basis.
Sources: Regional trade agreements notified to the GATT/WTO and in force. Available at: ; Deep Trade Agreements database 2.0 (vertical depth). Available at: https://datatopics. of goods, as they were primarily created between developing countries, while FDI inflows into APR countries came from developed economies. This, to a certain extent, could have limited opportunities for capital exchange within this form of integration. However, during the analyzed period, a number of countries that concluded shallow integration agreements were either developed or had high per capita income12 and actively channeled direct investments into other APR countries. Therefore, the impact of shallow integration agreements on FDI inflows is at least ambiguous, requiring quantitative assessment for more precise conclusions.
Assessment methodology and data
Methodology. Over the past two decades, the development of gravity models for assessing the impact of integration agreements on trade and economic interactions between countries has achieved significant progress (Larch et al., 2025). In accordance with accumulated empirical estimates of the influence of integration factors on trade and economic interactions between countries within structural gravity models, specific recommendations have been developed for conducting quantitative calculations of the corresponding effects. First, based on a panel dataset, for a correct assessment of the impact of dummy variables on the dependent variable, the model includes countrytime fixed effects for exporter/importer to control for multilateral resistance13, and country-pair fixed effects to account for the influence of all time-invariant bilateral costs (Yotov et al., 2016). Second, the estimation of the relationship is built in a multiplicative form (Poisson PseudoMaximum Likelihood – PPML) to include zero values in the dataset, thereby avoiding the problem of heteroscedasticity and model specification errors due to an incorrectly chosen functional form (Santos Silva, Tenreyro, 2006). Third, the panel includes internal trade and investment interactions, i.e., the domestic market for goods and the stock of domestic direct investments, to control for the diversion of countries’ trade (Yotov, 2022) and investment (Kox, Rojas-Romagosa, 2020) flows toward their domestic markets and to eliminate the distorting influence of global factors. These recommendations have significantly simplified the estimation of the effects of integration agreements that determine countries’ trade and investment interactions.
Since the impact of integration agreements is delayed in the long term (Yotov et al., 2016; Borghi et al., 2024), this study estimates only the cumulative effects of these agreements on trade and FDI inflows. The cumulative effect of integration agreements on trade was estimated using the following model:
Xijt = exp к + уП ^TREAT^ +
L < n=0
+ ^т ^ТМТЦТ\ ] + n i t + X jt + ^ ii + £ ii t\, (1)
where:
Xij – exports from country i to country j (in US dollars);
TREATij – dummy variable indicating the presence/absence of an integration agreement between i and j ;
INTL(T)ij – dummy variable that equals one for international flows (between countries) for each year T and zero for intra-national flows of goods (1) and FDI (2);
p 0 — constant;
TPn - value of the cumulative effect of the integration agreement;
P T — aggregate barriers in trade interactions between countries;
t – time period;
n – time lag (5 years);
πi – exporter-year fixed effects;
χj – importer-year fixed effects;
µij – country-pair fixed effects;
ε – error term.
The cumulative effect of integration agreements on FDI inflows was calculated as follows:
FDIi]t = exp [ft, + Sn 3pnTREATijt_n +
L £—1 n=0
where:
FDIij – inflow of accumulated FDI into country i from country j (in US dollars);
P T — aggregate barriers in investment interactions between countries;
γi – donor country-year fixed effects;
ωj – recipient country-year fixed effects.
Subsequently, to isolate the effects of globalization (i.e., to exclude the impact of regional integration agreements), following the methodology of a previous study (Izotov, 2020), the aggregate cumulative effects of integration for trade and investment were estimated.
The aggregate cumulative effect of integration for trade was estimated as follows:
Xi}t = exp к + Sn 50nTREATi}t_n +
In turn, the aggregate cumulative effect of integration for FDI inflows was estimated using the following equation:
FDI ij t = exp
к + У ""У
L ^—। "=0
TREATijt-n
+
+ Y it + ^ jt + F ij + $#]. (4)
The difference in £ ^n between models (3) and
(1) reflects the value of the cumulative effect of integration within the globalization process for trade, while the difference between (4) and (2) reflects the same for FDI inflows. For the sake of brevity, the variable TREATij in models (1) to (4) encompassed the following:
PTAij – dummy variable for the presence/ absence of any integration agreement (both deep and shallow) between i and j ;
DTAij – dummy variable for the presence/ absence of a deep integration agreement between i and j ;
NONDTAij – dummy variable for the presence/ absence of a shallow integration agreement between i and j .
Data. For the dependent variable FDI, we used statistics reflecting the value of mutual accumulated FDI stocks in the Asia-Pacific Region (APR) and their internal domestic investment. The primary challenge in constructing the dataset for accumulated FDI stocks was the absence of a single comprehensive statistical database providing the value of mutual FDI stocks between APR countries. Most sources provide incomplete data on FDI stocks between APR countries; therefore, the dataset for the dependent variable FDI was compiled from various sources, primarily based on data from international databases: UN14, OECD15, the World Bank (Steenbergen et al., 2022), IMF16, and CEIC17. When gaps in mutual FDI stock statistics were identified, they were either filled with data from other sources (CEPII18; ASEAN19; central banks, statistical offices, relevant ministries, and investment agencies of APR countries and economies, as well as other international organizations and analytical agencies20) or, in some cases, estimated using a moving average. Occasional negative values of FDI stocks were set to zero (Kox, Rojas-Romagosa, 2020).
The dataset for the dependent variable FDI included data characterizing the value of accumulated investment in fixed assets within APR countries, excluding accumulated FDI, following the recommendations for estimating gravity model specifications for trade (Yotov et al., 2016). For the period under review, statistics on domestic accumulated investment in fixed assets were compiled from both specialized databases21 and statistical offices of APR countries. Since for some APR countries22, statistics on domestic accumulated investment in fixed assets were not found, these economies were excluded from the estimated panel23. Ultimately, as in a previous study (Izotov, 2023), the panel included 36 APR economies24.
To ensure the comparability of results, the panel for trade interactions in the APR included the same set of regional countries. Accordingly, for the dependent variable X, we used statistics reflecting the value of trade between APR countries and their internal trade. Values for countries’ internal trade were derived as the difference between the value of goods produced in the national economy and exports (Campos et al., 2021; Izotov, 2023a; Izotov, 2023c). The values of goods produced in APR economies were collected from specialized statistical databases (UNIDO25, CEPII26, CEIC, FAO (UN)27, UNCTAD28, the World Bank29), as well as from statistical agencies of the region. Statistical data on mutual exports between APR countries were sourced from UNCTAD, the World Bank, CEIC, and RIETI30 databases.
To build the dataset of dummy variables for integration agreements between APR countries, data on the presence or absence of deep and shallow agreements from the World Bank31 and WTO32 databases were used. As mentioned earlier, some integration agreements over the long-term period transitioned from shallow to deep status, which was accounted for in the dataset construction. For multilateral agreements, differences in the timing of countries’ accession to the integration mechanisms of these agreements were also considered.
The following agreements between APR countries were classified as deep trade agreements ( DTA ), primarily in the FTA+ format unless otherwise specified: PSA+ Latin American Integration Association33 (1981); CU Andean Community of Nations34 (1988); Australia – New Zealand (1989); NAFTA North American Free Trade Agreement35 (1994–2020); Colombia – Mexico (1995); Canada – Chile (1997); FTA ASEAN Free Trade Area (AFTA)36 (1992–1995); Chile – Mexico (1999); Central America37 (2001); New Zealand – Singapore (2001); Chile – Costa Rica (2002); Chile – El Salvador (2002); Japan – Singapore (2002); Canada – Costa Rica FTA (2002); China – Hong Kong (2003); China –
Macao (2003); Panama – El Salvador (2003); Singapore – Australia (2003); Panama – Taiwan (2004); Republic of Korea – Chile (2004); USA – Chile (2004); USA – Singapore (2004); ASEAN – China38 (2005); USA – Australia (2005); Thailand – Australia (2005); Thailand – New Zealand (2005); Japan – Mexico (2005); Central America – USA39 (2006); Guatemala – Taiwan (2006); Japan – Malaysia (2006); Panama – Singapore (2006); Korea – Singapore (2006); Trans-Pacific Strategic Economic Partnership40 (2006); Chile – China (2007); Japan – Thailand (2007); Chile – Japan (2007); Brunei – Japan (2008); Chile – Honduras (2008); China – New Zealand (2008); El Salvador – Honduras – Taiwan (2008); Japan – Indonesia (2008); Japan – Philippines (2008); Nicaragua – Taiwan (2008); Panama – Costa Rica (2008); Panama – Chile (2008); ASEAN – Japan (2008)41; ASEAN – Korea (2009); Peru – Chile (2009); Peru – Singapore (2009); Panama – Guatemala (2009); Panama – Honduras (2009); Panama – Nicaragua (2009); Japan – Vietnam (2009); USA – Peru (2009); China – Singapore (2009); Colombia – Northern Triangle (2009); Australia – Chile (2009); Canada – Peru (2009); Chile – Colombia (2009); ASEAN – Australia – New Zealand42 (2010); Chile – Guatemala (2010); New Zealand – Malaysia (2010); Peru – China (2010); Peru – Korea (2011); Canada – Colombia (2011); China – Costa Rica (2011); Hong Kong – New Zealand (2011); Japan – Peru (2012); Chile – Nicaragua (2012); Panama – Peru (2012); Peru – Mexico (2012); Korea – USA (2012); USA – Colombia (2012); USA – Panama (2012); Chile – Malaysia FTA (2012); Malaysia – Australia (2013); Mexico –
Central America (2013); New Zealand – Taiwan (2013); Canada – Panama (2013); Costa Rica – Peru (2013); Costa Rica – Singapore (2013); Chile – Vietnam FTA (2014); Canada – Honduras (2014); Korea – Australia (2014); Singapore – Taiwan (2014); Korea – New Zealand (2015); Korea – Vietnam (2015); Mexico – Panama (2015); Australia – China (2015); Canada – Korea (2015); Chile – Thailand (2015); China – Korea (2015); Hong Kong – Chile (2015); Japan – Australia (2015); Costa Rica – Colombia (2016); Russia43 – Vietnam (2016); Japan – Mongolia (2016); Korea – Colombia (2016); Pacific Alliance44 (2016); Peru – Honduras (2017); CPTPP (2018); Hong Kong – Macao (2018); ASEAN – Hong Kong (2019); Korea – Central America45 (2019); Chile – Indonesia FTA (2019); Peru – Australia (2020); Hong Kong – Australia (2020); Indonesia – Australia (2020); PACER Plus46 (2020); United States–Mexico–Canada (USMCA) (2020); RCEP (2022).
Shallow integration agreements (NONDTA) between APR countries included: CU Central American Common Market47 (1961–2012); PTA Protocol on Trade Negotiations48 (1973); APTA Asia-Pacific Trade Agreement49 (1976); Australia – Papua New Guinea FTA (1977); Latin American Integration Association FTA+50 (1981); FTA South Pacific Regional Trade and Economic
Cooperation Agreement51 (1981); Ecuador – Mexico PTA (1983); CU Andean Community of Nations52 (1988); PTA Global System of Trade Preferences53 (1989); Laos – Thailand PTA (1991–1994); ASEAN FTA (1992–1994); PTA Melanesian Spearhead Group54 (1994); APTA – China PTA55 (2002); FTA Pacific Island Countries Trade Agreement56 (2003); CU Central America – Panama (2013); El Salvador – Ecuador PTA (2017); Brunei – Japan FTA+ (only 2008); Japan – Indonesia FTA+ (only 2008); ASEAN – Japan57 (only 2008).
The aggregate indicator reflecting membership in both deep and shallow integration agreements is PTA. To avoid biased estimates (Baldwin, Taglioni, 2007), the value indicators reflecting bilateral and internal trade, as well as accumulated FDI and internal domestic investment, were expressed in current prices (Izotov, 2023c). If an integration agreement entered into force in the first half of a year, it was assigned to that year; if it entered into force in the second half, it was assigned to the following year (Izotov, 2023c). To facilitate quantitative estimation, interval values of the panel data with a five-year lag were considered (199258, 1995, 1999, 2003, 2007, 2011, 2015, 2019, and 2023). As a result, this study covers 11,502 observations.
Estimation results
The estimation confirmed the stimulating effect of the considered agreements on trade between APR countries within the process of regionalization.
Countries that concluded integration agreements (PTA) traded 21.9% more compared to those national economies that did not conclude such agreements. However, the impact of integration agreements on FDI inflows – without distinguishing between deep and shallow agreements – was not statistically significant, indicating the invariant influence of this foreign policy instrument for stimulating investment interactions among APR countries ( Tab. 1 ).
Table 1. Estimation results for (3) and (4)
|
Variable |
X |
FDI |
||||
|
1 |
2 |
3 |
4 |
5 |
6 |
|
|
PTA |
0.20*** (0.05) |
– |
– |
0.08 (0.10) |
– |
– |
|
DTA |
– |
0.14*** (0.05) |
– |
– |
0.21** (0.09) |
|
|
NONDTA |
– |
– |
0.38*** (0.17) |
– |
– |
-0.65*** (0.23) |
|
Δ , % |
21.9 |
15.5 |
46.0 |
– |
23.6 |
-47.5 |
|
INTL 1992 |
-0.78*** (0.06) |
-0.81*** (0.06) |
-0.90*** (0.06) |
1.50*** (0.12) |
1.57*** (0.12) |
1.47*** (0.10) |
|
INTL 1995 |
-0.52*** (0.06) |
-0.54*** (0.06) |
-0.60*** (0.05) |
0.19* (0.10) |
0.24** (0.09) |
0.22** (0.09) |
|
INTL1999 |
-0.37*** (0.05) |
-0.38*** (0.05) |
-0.45*** (0.05) |
-0.03 (0.10) |
-0.02 (0.10) |
-0.05 (0.10) |
|
INTL 2003 |
-0.37*** (0.05) |
-0.38*** (0.05) |
-0.45*** (0.04) |
-0.26*** (0.08) |
-0.20** (0.08) |
-0.21** (0.08) |
|
INTL 2007 |
-0.31*** (0.05) |
-0.32*** (0.05) |
-0.40*** (0.05) |
-0.05 (0.08) |
-0.05 (0.08) |
-0.05 (0.09) |
|
INTL 2011 |
-0.37*** (0.04) |
-0.37*** (0.04) |
-0.41*** (0.04) |
-0.01 (0.06) |
-0.03 (0.06) |
-0.03 (0.07) |
|
INTL 2015 |
-0.29*** (0.04) |
-0.30*** (0.04) |
-0.33*** (0.04) |
-0.17*** (0.05) |
-0.13** (0.05) |
-0.14** (0.05) |
|
INTL 2019 |
-0.23*** (0.03) |
-0.24*** (0.03) |
-0.26*** (0.04) |
-0.04 (0.06) |
-0.03 (0.06) |
-0.03 (0.06) |
|
Constant |
15.67*** (0.57) |
10.06*** (0.61) |
10.23*** (0.52) |
20.01*** (0.22) |
12.59*** (0.31) |
10.64*** (0.33) |
|
Pseudo log-likelihood |
-1.86e+12 |
-1.86e+12 |
-1.86e+12 |
-3.03e+12 |
-3.04e+12 |
-3.07e+12 |
|
Pseudo R2 |
0.99 |
0.99 |
0.99 |
0.99 |
0.99 |
0.99 |
|
RESET-test |
0.28 |
0.37 |
0.08 |
0.02 |
0.02 |
0.02 |
Notes. 1–3 correspond to different specifications of model (3); 4–6 correspond to different specifications of model (4). * p < 0.10;
** p < 0.05; *** p < 0.01; autocorrelation is accounted for using Newey-West standard errors; values in parentheses are standard errors;
INTL reflects border effect values, with 2023 as the base year. Here and hereafter, the △ indicator is calculated as (e e -1) x 100%.
Source: own calculation.
We should note that shallow integration agreements ( NONDTA ) contributed to a significant increase in trade between APR countries in the long term – by an average of 46.0% – while simultaneously suppressing FDI inflows by 47.5%. These estimates indicate that under shallow integration agreements, there was a crowdingout of investment flows between countries in the region due to the stimulation of trade alone. In turn, APR countries that established deep integration agreements (DTA) with each other increased their bilateral trade by an average of 15.5% and FDI inflows by 23.6%. Consequently, deep integration agreements stimulated the exchange of both goods and direct capital between APR countries, indicating the creation of conditions for complementarity between trade and FDI in the region under more advanced formats of economic integration. This complementarity explicitly points to the establishment of vertical forms of FDI in the APR, aimed at stimulating trade in intermediate goods within production processes spread across different countries to manufacture finished products with relatively low costs. This is supported, in particular, by estimates for key East Asian countries and associations – China, Japan, Korea, and ASEAN (Izotov, 2023b; Li, Kawasaki, 2014; Whalley, 2017).
Beyond reducing overall investment risks, attracting FDI requires the mitigation of various market access barriers in national economies, which can be achieved through deep integration formats to subsequently develop countries’ comparative advantages within an export expansion strategy. However, as the estimates showed, the long-term cumulative trade effect of shallow integration agreements was higher than that of deep integration agreements. This circumstance can be explained by at least two reasons. First, the market penetration in recipient countries facilitated by FDI inflows somewhat suppressed the export of goods from the donor countries of these direct investments.
Second, the specific time periods during which the two types of integration agreements operated: deep integration agreements were primarily concluded in the 2000s, while shallow integration agreements had been reducing trade barriers between APR countries long before that.
The analysis indicated a difference in the dynamics of comparative total costs ( INTL ) for trade and investment in interactions between APR countries. For trade, a generally progressive trend of cost reduction was observed, with costs decreasing by 54% by 2023 relative to 1992, i.e., (e-0.78—1)x100%. The coefficients for the INTL variable were statistically significant for all years analyzed, indicating a tendency among all countries in the sample toward free trade in goods within the APR (Izotov, 2023b). In contrast, the costs of investment interactions between APR countries did not decrease as unequivocally as in the case of trade. The estimates showed lower values for investment interaction costs in the first half of the 1990s compared to 2023, as the ratio of FDI to internal domestic investment was higher in the last decade of the 20th century than in the subsequent years under review. The statistical insignificance of the INTL variable for investment interactions in some of the years analyzed could have been caused by the distorting effect of foreign policy confrontations in the APR, as well as the transformation of production cooperation due to the transition of a number of regional economies from trade in intermediate goods to the exchange of finished products (Izotov, 2023b). Nevertheless, based on the statistically significant estimates of the INTL variable, a reduction in barriers to FDI inflows was observed by 2023 relative to the early 2000s and mid-2010s, indicating some convergence of APR economies in terms of investment interactions.
Subsequently, estimates for the aggregate cumulative effect of integration between APR countries were obtained for both trade and investment ( Tab. 2 ).
Table 2. Estimation results for (1) and (2) and the difference between effects
|
Variable |
X |
FDI |
||||
|
1 |
2 |
3 |
4 |
5 |
6 |
|
|
PTA |
0.60*** (0.04) |
– |
– |
0.01 (0.10) |
– |
– |
|
DTA |
– |
0.57*** (0.05) |
– |
– |
0.21** (0.09) |
– |
|
NONDTA |
– |
– |
0.81*** (0.17) |
– |
– |
-0.49** (0.23) |
|
Δ , % |
82.1 |
76.6 |
125.1 |
– |
23.6 |
-38.9 |
|
Constant |
9.77*** (0.47) |
14.87*** (0.36) |
15.29*** (0.48) |
23.03*** (0.41) |
16.64*** (0.72) |
20.79*** (0.82) |
|
Pseudo log-likelihood |
-2.09e+12 |
-2.11e+12 |
-2.31e+12 |
-3.30e+12 |
-3.31e+12 |
-3.34e+12 |
|
Pseudo R2 |
0.99 |
0.99 |
0.99 |
0.99 |
0.99 |
0.99 |
|
RESET-test |
0.02 |
0.02 |
0.02 |
0.01 |
0.01 |
0.01 |
|
Globalization effect, % |
60.2 |
61.1 |
79.1 |
– |
0 |
8.6 |
Notes. 1–3 correspond to different specifications of model (1); 4–6 correspond to different specifications of model (2). ** p < 0.05; *** p < 0.01; autocorrelation is accounted for using Newey-West standard errors; values in parentheses are standard errors. The globalization effect is calculated as the difference between the aggregate cumulative integration effect (Tab. 2) and the cumulative integration effect ( Δ , %; Tab. 1).
Source: own calculations.
From the perspective of effect direction, the estimates of the aggregate cumulative effect of integration between APR countries revealed a positive impact on trade from integration agreements in general (PTA), as well as from deep (DTA) and shallow (NONDTA) agreements. This positive influence significantly exceeded the direct impact of these agreements within the regionalization process (see Tab. 1). In contrast, for investment interactions, the aggregate cumulative integration effect (see Tab. 2) was comparable to the corresponding indicator of the direct influence of integration agreements on capital flows (see Tab. 1). This circumstance indicates that the globalization process notably stimulated only trade interactions and generally had an invariant effect on direct investment flows between APR countries that signed integration agreements. Although the globalization process mitigated the negative impact of shallow integration agreements on FDI flows between APR countries, this mitigation was insignificant. It is important to consider that in the global economy, trade in goods is facilitated by the WTO, while no similar integration framework exists for direct investment59. Therefore, the obtained estimates provide grounds to assert that in the context of barrier reduction, investment interactions in the APR were determined by deep integration agreements, which require mutual, endogenous lowering of restrictions on capital flows. Ceteris paribus, in the absence of such integration agreements, long-term expectations of FDI inflows into APR countries were generally unfounded, unlike trade interactions, which were stimulated by the global economic conjuncture and WTO membership.
Conclusion
Due to the absence of opportunities for creating more advanced forms of integration at the global level, two major groups of integration agreements have become increasingly distinct: shallow and deep. A significant proliferation of integration agreements is observed in the APR, which holds a leading global position in terms of economic size, trade, and FDI. The exchange of goods and direct capital within the APR is the primary source of foreign economic interactions for the region’s countries, facilitated by the reduction of various barriers, including those achieved through the conclusion of bilateral and multilateral deep and shallow integration agreements. Until the early 2000s, shallow integration agreements played the main role in the regionalization process in the APR, while from the first half of the 2000s, deep integration agreements took precedence. However, estimates of the long-term comparative influence of integration agreements on trade and investment interactions in the APR remain insufficiently studied. Therefore, this study, based on gravity modelling, has estimated the cumulative effects of shallow and deep integration agreements, given that their impact on trade and FDI inflows is delayed in the long term.
The obtained estimates indicated a stimulating effect of any integration agreements on trade between APR countries, contributing to its increase by an average of 21.9%, while their influence on FDI inflows was invariant. Shallow integration agreements between APR countries reduced FDI inflows by 47.5% and contributed to a 46% increase in trade on average over the period. In turn, APR countries that concluded deep integration agreements increased their bilateral trade by 15.5% and FDI inflows by 23.6%. Consequently, within the APR, shallow and deep integration agreements conflicted with each other in terms of attracting FDI. The long-term cumulative trade effect of the former was higher than that of the latter. This paradox is explained by the suppression of direct investment by goods trade, as well as the longer duration of shallow integration agreements. Nevertheless, deep integration agreements stimulated the exchange of both goods and direct capital between APR countries, indicating the creation of conditions in the region for complementarity between trade and FDI under more advanced integration formats aimed at reducing the costs of production cooperation.
As the assessment of the aggregate cumulative integration effect showed, the globalization process significantly stimulated only trade interactions and generally had an invariant effect on direct investment flows between APR countries that concluded integration agreements. Therefore, in the context of reducing barriers in interactions between APR economies, investment interactions were determined by deep integration agreements, which require mutual reduction of restrictions on capital flows between countries. A strategy of passively waiting for FDI inflows into APR countries, hoping for a favorable global economic conjuncture, was generally ineffective in the long run, unlike trade, which was stimulated in part by countries’ membership in the WTO. This circumstance indicates that the exchange of direct investment in the APR was more sensitive to existing barriers in economic interactions, as well as less flexible and more specific to FDI recipient countries compared to trade.
The assessment of the aggregate cumulative integration effect also indicated a difference in the dynamics of comparative total costs for trade and investment in interactions between APR countries. For trade interactions, a generally progressive trend of cost reduction was observed. In contrast, the costs for investment interactions between countries did not decrease as unequivocally as in the case of trade. Nevertheless, by 2023, a reduction in barriers to FDI inflows was observed relative to the early 2000s and mid-2010s, indicating to a certain extent a convergence of economies in terms of investment interactions.
The estimates obtained for the APR as a whole provide grounds to assert that the existing framework of integration agreements, both global and regional, will support trade relations based on a combination of principles of “political” loyalty and economic expediency when concluding deep integration formats between countries in the region. The simultaneous participation of countries in “proChina” and “pro-American” trade formats mitigates future disagreements among regional countries, restraining the process of fragmentation in the APR (Wei et al., 2022; Park, 2020). An important aspect for intensifying the attraction of foreign direct investment within deep integration agreements is likely to be their qualitative content (Osnago et al., 2019). Long-term stimulation of FDI inflows into APR countries could be based on a combination of strategies to reduce various endogenous investment risks and the conclusion of deep integration formats to subsequently develop countries’ comparative advantages, with the aim of prospectively enhancing their export specialization and expanding domestic market capacity.
It should be noted that Russia, as one of the APR countries, was predominantly a recipient of FDI from the economies of this region. Under the conditions of the large-scale sanctions imposed in 2022, the previous volume of FDI inflows from APR countries into the Russian economy decreased significantly, while trade was largely maintained with friendly countries in the region and within commodity niches not subject to these restrictions.
Prior to the imposition of large-scale sanctions, Russia had not established a network of deep integration agreements with APR countries, with the sole exception of an FTA+ with Vietnam. For this reason, under the new conditions, attracting FDI into the Russian economy based on regionalization mechanisms is quite problematic, especially given the potential imposition of secondary sanctions by Western countries. For significantly increasing Russian exports of raw commodities, integration agreements are apparently not as effective as for exports of high value-added goods, the production of which requires foreign technology and capital to participate in international production cooperation. However, as estimates show (Kimura et al., 2021), the reduction of trade and investment barriers through the implementation of integration agreements between APR countries will positively affect the economic indicators of the region’s countries in the medium term, sustaining high demand for imports of raw commodities, particularly those flowing from Russia to the Chinese market. The results of the study indicate the necessity for Russia to, at a minimum, maintain net goods exports by switching to domestic funding sources and creating exclusive conditions for foreign direct investment, and at a maximum, attract capital from friendly APR countries, including through the establishment of deep integration agreements with them.
