Traffic Adaptive Small Cell Planning in Heterogeneous Networks

Author: Kuna Venkateswararao, Tejas M. Modi, Pravati Swain, Srinivasa Rao Bendi
Journal: International Journal of Computer Network and Information Security @ijcnis
Article in issue: 2 vol.17, 2025.
Free access
Small cell is a key enabler for massive connectivity and higher data rate in the future generation of a cellular communication system. Few challenges in heterogeneous networks (HetNets) are effective resource utilization and de- ployment of optimal small base stations (SBSs) under dynamic mobile traffic patterns. In this paper, we design a traffic adaptive small cell planning (TASCP) schema to minimize the deployment of SBSs, enhancing the network energy efficiency without compromising the user equipment’s QoS (UEs). The proposed TASCP consists of two phases: small cell formation (SCF) and small Cell optimization (SCO). SCF creates the initial association between the UEs and SBS. The SCF operates the modes (active/sleep) of SBSs according to the dynamic traffic load. Changing the mode of SBS from an active mode to a sleep mode is based on the traffic load shared by other neighboring SBSs, cooperatively. The proposed TASCP method is compared with state-of-the-art algorithms, i.e., the Self-organized SBS Deployment Strategy (SSDS) and UE Association and SBS On/Off (USOF) algorithm. The network performance is calculated in terms of network energy efficiency, throughput, convergence time, and active small base stations. The performance of the proposed TASCP significantly increases as compared to state-of-the-art algorithms.
5G/6G, Small Cell Network, Heterogeneous Networks, Energy Efficiency
Short address: https://sciup.org/15019791
IDR: 15019791 | DOI: 10.5815/ijcnis.2025.02.06
Text of the scientific article Traffic Adaptive Small Cell Planning in Heterogeneous Networks
Nowadays, mobile traffic and data usage are increasing rapidly. The 5G cellular network [1, 2] supports dynamic mobile traffic demands. In order to control traffic demands, many techniques are used in 5G systems such as the introduction of small cells, massive multiple input multiple outputs (MIMO), millimeter-wave communications, cognitive radios, cloud radio access network (CRAN), and software-defined networks (SDN) [3, 4]. Small cells are one of the most promising techniques to increase the network throughput and coverage capacity of the 5G system. The small cell is operated by the small base station to provide Quality of Services (QoS) to User Equipment (UE) within its coverage area [5]. The small base station is integrated with MIMO antennas to handle the wireless mobile traffic using hundreds of antennas. The massive MIMO technique improves the spectrum efficiency of the 5G wireless communication system. Cognitive radio technology [6] plays a role in the next generation of a cellular network that will address the critical issue in spectralefficiency and inference management.
Ultra-dense networks (UDNs) [7, 8] is dense deployments of small base stations in a cellular area. UDNs are a key component of modern wireless communication systems, particularly in 5G and beyond. They are characterized by a high density of small cells, such as microcells, picocells, and femtocells, which are deployed to increase network capacity and coverage in areas with high user density and data traffic demands. UDNs handle the traffic load based on the UE demands and provide the QoS services. The SBSs are deployed in indoor area and outdoor areas. Deploying SBSs will reduce power consumption and traffic load on MBSs. Cloud Radio Access Network (CRAN) architecture is key enabling design for multiple base station cooperation in 5G architecture. The CRAN [9] is a centralized structure. It is used to share the computational resources of base stations in the network in a cooperative manner by using network virtualization. The CRAN is more flexible, and dynamic cooperation with complex inference concern which enhances resource utilization. The CRAN is managed by the SDN through forwarding devices, and controlled by the SDN controller. The SDN manages the resource allocation in 5G mobile networks which is adjustable with dynamic network scenarios [10, 11].
Small cell network (SCN) is a collection of small cells. Each small cell is operated by the small base station (SBS) to provides QoS to the UEs, and SBSs are controlled by a central macro base station (MBS). Hence, the dense deployment of SBSs is required to handle the dynamic mobile traffic in heterogenous networks (HetNets). However, some SBSs are underutilized because of dynamic traffic pattern. To improve the utilization of SBSs in terms of power consumption and QoS to UE, it is proposed to switch-off redundant SBSs [12]. The Energy Efficiency (EE) is considered a significant performance metric [12, 13] which is strongly reflected in network performance. The EE is based on the UE association scheme and the number of SBSs are active in the network. To address this issue, a traffic adaptive small cell planning (TASCP) framework is proposed to improve the EE and optimize (minimize) the number of active SBSs in the small cellnetwork to satisfy the QoS to UEs.
The order of the research article is presented in the following manner: Section 2 describes existing research work and presents the contribution of the proposed work. The model of the network system is described in Section 3. Section 4 presents the proposed framework by providing a complete overview of the proposed approaches. Section 5 provides a performance evaluation and Section 6 provides the paper conclusion and future work.
2. Related Works
Maximizing energy efficiency in the mobile communication system is a significant issue. To achieve higher communication efficiency and consistent connectivity, service providers are progressively deploying macro-cells, picocells, femtocells, and microcells in HetNets [14, 15]. Current state-of-the-art mechanism [16, 6] presents that the base station consumes higher than 50% of the energy during communication. Thus, to optimize the placement of the SBSs, a novel sleep strategy is implemented to decrease power consumption. A novel sleep strategy emphasizes the selection of different states of SBSs based on network traffic. If the network traffic is very low then it puts SBS in sleep mode and if network traffic is very high then it puts SBS in active mode.
The Cell Activation and Selection (CAS) algorithm [17] is proposed to optimize the network EE by considering whether the UEs remain static in the network for an extended time. Similarly, in paper [18], SBSs are turned on/off when there is no active connection between UEs and SBS. However, in this approach, the under-utilization of SBS scenario, i.e., the number of UEs connected to SBS is less than the maximum serving capacity of the SBS, is neglected. Moreover, the dynamic network traffic is also neglected in this approach.
In paper [19], the Self-Adaptive Scheduling (SAS) algorithm is proposed to operate the SBS states (active/sleep) according to their traffic loads. The SAS algorithm measures the load of each SBS in the network and classifies SBSs into two different classes, i.e., lightly loaded and heavily loaded based on predefined thresholds. Then, the heavily loaded SBSs share the load with the neighboring lightly loaded SBS s1. Likewise, the active/sleep state strategy for the base station is proposed in [20] which is based on the variation of the mobile users’ traffic pattern. First, identify the least loaded SBS among all SBSs and switch off. Then, list out neighboring SBSs within the transmission range of the least loaded SBS and sort them. Choose the first two SBSs from the sorted list and share the load among them. The same process is repeated until the load of the SBS is shared with the neighboring SBSs. The authors in [19, 20] consider the least loaded SBS for the sleeping approach and share the load with the two least loaded neighboring SBSs. Here, the traffic load of the SBSs is not shared among all neighboring SBSs within the transmission range.
Similarly, the UE connection and SBS On/Off (USOF) [21] algorithm is proposed to enhance the network EE and reduce the number of active SBSs in the UDN. Here, the UEs are associated with the SBS when the UE meets the minimum requirements of the SINR. Next, the calculation of traffic loads at the SBSs in the network determines the least loaded SBS. Based on this calculation the SBS is turned off and the respective UEs are re-connected with the active SBSs based on the targeted SINR threshold. This SBS On/Off process continues until the network reaches the maximum outage probability. Here, authors consider the least load SBS to be turned off and re-associate these UEs to the other SBSs. Here, the authors don’t take any constraints into account when re-associating UEs. This means that the UEs are connected to
SBSs next to each other without taking into account the loads on those SBSs.
The self-organized SBS deployment strategy (SSDS) is developed in paper [22] to improve the EE of SCN by turning off the redundant SBSs. For the sleeping strategy, one SBS is selected randomly and switched off. The respective UEs of selected SBS are re-connected to other SBSs. This procedure continues until it is impractical to turn off any other SBS on the model. Similarly, the Distributed Base Station Sleeping (DBSS) algorithm is developed in [23] to optimize the placement of SBSs. In this approach, the SINR-based association is considered for the new users. Then, randomly choose one SBS and switch off. The authors in [22, 23] consider randomly chosen SBS for the sleeping approach. Here, the selection of SBS does not consider any constraints such as the traffic load of the SBS. Moreover, these approaches take n 1 iterations to switch off one SBS where n is the number SBSs in the SCN. —
Towards this end, this paper contribution is related to the SBS sleeping cell strategy as described above. To address the above limitation, we have proposed a traffic adaptive small cell planning (TASCP) framework to enhance the networkEE and control the dynamic mobile traffic in the HetNets.
The contributions of this paper are summarized as follows:
• A traffic adaptive small cell planning framework is proposed, which consists of two phases, i.e., Small Cell Forma-tion (SCF) phase and Small Cell Optimization (SCO) phase.
• The SCF establishes the initial association from the UEs to SBSs according to the dynamic traffic pattern. The UEsare associated with SBS by considering the preference of UEs and load of the respective SBS.
• The SCO dynamically adjusts the modes of the SBSs (active/sleep) based on their loads. Based on traffic load, the active SBS enters a sleep mode. Then, other SBSs receive a proportionate share of that SBS’s load according to their current loads.
3. System Model
Consider a typical small cell network as the ultra-dense area managed by the MBS, which is placed at center of the SCN. We consider network architecture as shown in Fig.1. The SBSs are connected to cloud radio access network (CRAN) through the backhaul links. The CRAN is associated with SDN controller, which is defined as Controller and Traffic Collection Representative (CTCR).
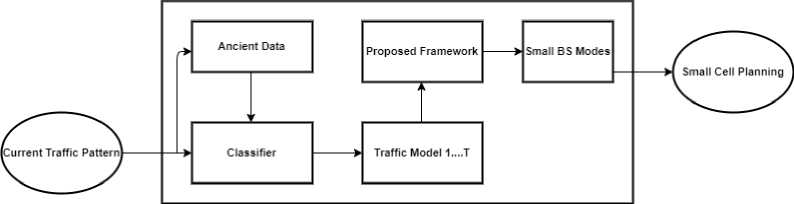
The flow diagram of the CTCR is shown in Fig.2. The current traffic pattern of UEs is given as input to the classifier and the existing traffic sub-module of the CTCR. The existing traffic data will be updated with the current traffic pattern. Then, the updated data forward to the classifier. The classifier classifies the data based on the pattern reorganization and machine learning techniques to define the traffic pattern of the UEs. The proposed framework creates the initial association of the UEs and SBSs. Moreover, it defines the active/sleep state of the SBSs in the HetNet.
Let M = {m1,m2,m3..mM} be the set of SBSs and N = {n1,n2,n3. .nN~} be the set of UEs. The distribution of UEs follows various traffic patterns denoted by T such as random, cluster and uniform pattern. The mode of the base stations is denoted by set of boolean variable, i.e., 5t = [S j ]1t M , under the given traffic pattern t. If S j = 1, the jth SBS is in active mode, otherwise the SBS is in sleep mode ( s j = 0). The association from ith UE to the jttl SBS is represented by At = [at ij ] ^ X M , where a^ j = 1 if the ith UE is connected with the jth SBS, otherwise a^ j = 0. On the basis of At values, we estimate the node degree of SBS and UE by using Equation (1) and Equation (2), respectively. The SINR between the ith UE and the jth SBS in mobile traffic pattern t is denoted by yP, as given in Equation (3). If y^j value of the ith UE to jth SBS is more than the given predefined threshold (3th ). Next, the ith UE associated to the jth SBS. The downlink capacity of the ith UE from jth SBS is given as R [j = log2(1 + Y ij ), where yP is the SINR value.
^aP VjEM
^^atj, ViEN t=^^h TP-j. The transmission power assigned by jth SBS to ith UE. Gi f. The channel gain from ith UE to jth SBS. IPlj. The Inference power from jth SBS to ith UE. Fig.1. Network model Fig.2. Flow diagram of controller and traffic collection representativ al f. The association between the ith UE and j^ SBS. a2: Thermal noise of the UE We can measure the EE of the SCN under the given traffic pattern t, which is written as a fraction of the network’s throughput (in bits) and energy usage (in joules) in Equation (4). The EE is typically expressed as bits per joule. The network throughput and energy usage are calculated by using Equation (5) and Equation (6). 5L ^F(4) CCct ^NC S^ = ^^а^(5) S^ = ^^(Ct + pf) + (1 - s^p!](6) where, C^p^t^i^ Cj : The jth SBS energy consumption p™ax: The jth SBS maximum TP Pf/pSj: The jth SBS power consumption in active/sleep state Problem Formulation The set of multiple SBSs and UEs creates the SCN where the UEs are associated with the SBSs. The dense placement of the SBSs in an ultra-dense network provides vulnerable traffic control, high data rates, and extensive connectivity. The energy utilization of the SBSs differs for different time intervals during the communication. However, few SBSs are lowly utilized such that they boost energy utilization and communication overhead. The sleeping cell strategy is proposed to optimize the EE of the SCN while fulfilling the QoSs of the UEs. This method minimizes the number of active SBSs and enhances the EE of the UDN. The problem is maximize the EE by minimizing the number of live SBSs using Equation (7) Maximize SEE s.t 01: ati,Ste{0,1}yiyj Cz.^a^Vj C3:YfL1aij C^OL^^aij < Si,Vi C^i^ia^ where C1 indicates boolean values for SBS deployment and UE association. Each UE is associated with one SBS represented by C2. Constraint C3 denotes the load of the SBS which is less than or equal to Smax. C4 represents that the UE connects to any active SBS. Constraint C5 states that the load of the SBS is less than a maximum threshold value.
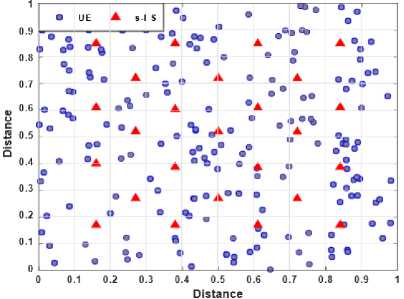
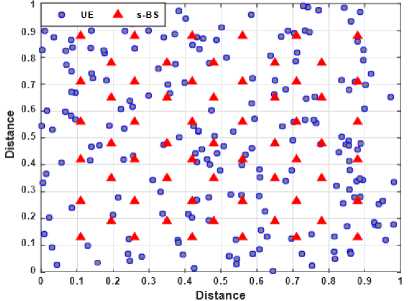
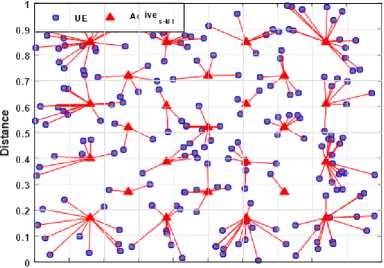
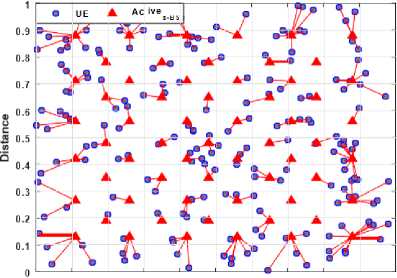
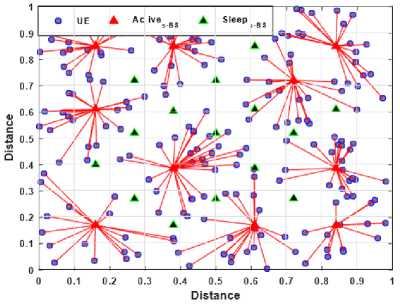
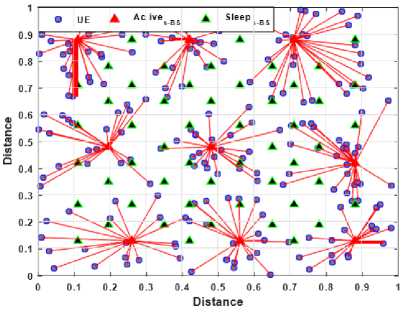
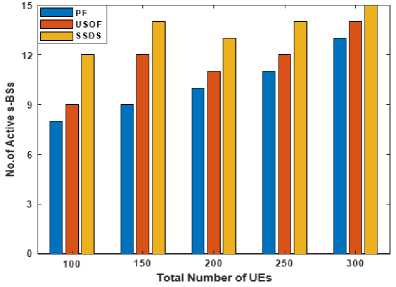
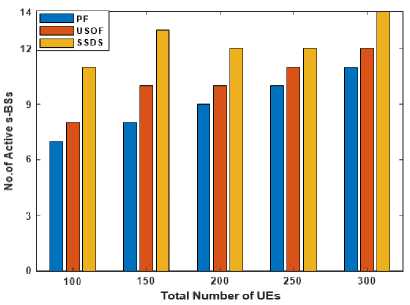
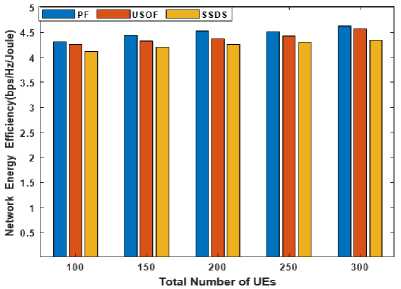
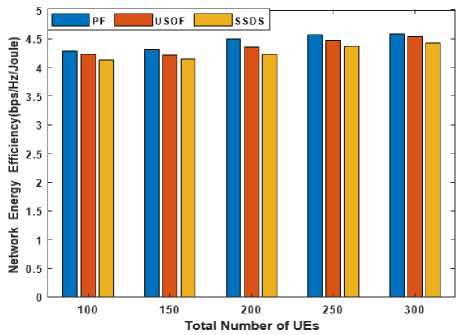
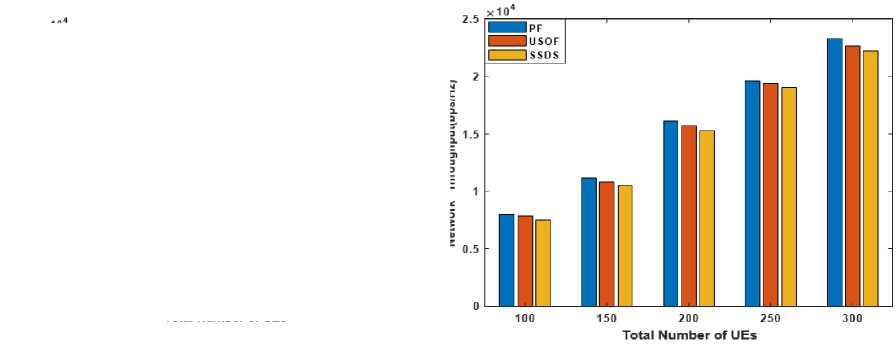
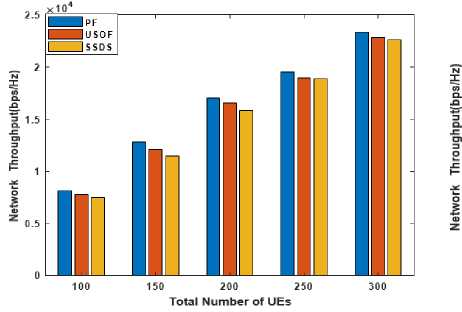
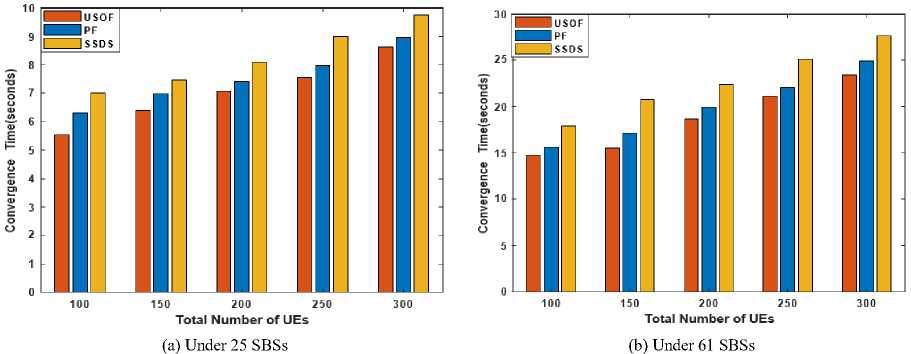
4. Proposed Framework The proposed framework aims to improve the EE and reduce the number of active SBSs in the HetNet. The sleeping approach is used to reduce the number of active SBSs in the network without compromising the quality of services to the UEs. This problem is solved by using the proposed traffic adaptive small cell planning (TASCP) schema, which consists of two Phases, phase-I is Small Cell Formation (SCF) and Small Cell Optimization (SCO) is phase-II. The TASCP framework is robust to sudden changes in traffic patterns due to its dynamic optimization capabilities. By continuously monitoring traffic loads and adjusting SBS modes using CTCR, the framework can respond quickly to fluctuations and maintain service quality. Phase-I prepares an initial connection from the UEs to SBSs, which is defined as cell formation. Phase II is used to decide the state (active/sleep) of the SBS and minimize the number of active SBSs in the network. The Controller and Traffic Collection Representative (CTCR) is responsible for recognizing and categorizing the given traffic pattern, periodically. Moreover, the identified traffic pattern is provided as input to the proposed TASCP, then apply the TASCP for the small cell planning in the network. Algorithm 1 Small Cell Formation() 0: Input: set of UEs N, set of SBSs M, SINR threshold (6th) 0: Output: Con_Grap 0: Initialization: UEd = 0, BSd = 0, UEr = 0, Con_Grap = 0. 0: while Con_Grap = 0 do 0: for each SBS i E M do 0: for each UE j E N do 0: Yi,j = Compute the SINR from s-BSi to UEj using Equation 3. 0: if (y^- > 6th) then 0: aij = 1, UEd = UEd + 1, BSd = BSd + 1 0: end if0: end for0: end for 0: for each SBS i E M do 0: for each UE j E N do 0: if (atj = 1 & UEd > 1) then 0: UEk = Identify the SBS with minimum Ytj 0: Con_Grap = Con_Net V UEk 0: aij = 0, UEf = UE? - 1, BS^1 = BSd - 1 0: else 0: Con_Grap = Con_Grap и aij 0: end if0: end for 0: if (B$d>Smax )then 0: Sort UEs associated with BS? 0: UE[ = BS? - Smax 0: UE[ associated with next choice of the SBSs 0: Update BS? 0: Update Con_Grap 0: end if 0: end for 0: end while=0 Phase I: Small Cell Formation The input to the cell formation phase is the number of SBSs (M) and UEs (N) in the mobile traffic pattern t. The SCF in Algorithm 4 provides the initial association between UEs and SBSs. The description of the algorithm is given below. • Initially, calculates the SINR yj value from all the SBSs to the UEs by using Equation (3). The jth UE (UEj) is connected to the ith SBS (SBSl) defined by alj = 1 when y^ value more than predefined threshold (6th). The degree of SBSi (BS?) and the degree UEj (UE?) is incremented by one. • If the UEj is associated with SBSl (alj = 1) and the UEj? is more than one, the SBSl with minimum SINR from the UEj is identified and keep the association of UEj to SBSl. Thereafter, the UEj disconnect from the other SBSs. Update the SBS?, UE? value. • If UEj degree is one and there is a connection between UEj and the SBSl (alj = 1), UEj is added to the connected graph (Con_Grap). • Furthermore, if the degree of the SBSl (BS?) exceeds the Smax value then the corresponding UEs are associated wtih the SBSl are sorted in decreasing order based on the received y^ from the SBSl. Next, the Smax UEs from the sorted list are connected with SBSl, and the remaining UEs (UE[) are associated to the other SBSs based on SINR choice. Thereafter, BS? and Con_Grap values are updated. The above steps are repeated until the Con_Grap is successfully constructed. Phase II: Small Cell Optimization The result of phase I is an initial connection between the UEs and the SBSs, which forms a connected graph (Con_Grap). The Con_Grap is used for the SCO. By operating the SSB modes in the HetNet, the total number of active SBSs is minimized. The Con_Grap, set of SBSs (M), and UEs (N) are input to the SCO phase, which outputs the deployment number of SBSs (Dep_BSs). The SCO is shown in detail in Algorithm 2, and a description follows. • First identifies the mode of the SBSs (S). Equation 8 is used to figure out the traffic load of the SBSl (BSl?s) when it is in active mode (Sl= 1). The SBSs deployment set (Dep_BSs) is then updated to include the SBSl. The SBSs’ loads are put in lower to a higher form and saved in the list written as SBl?s. • Find the SBS with the least traffic load in the list (SB1?'') and put it in leastBS variable. Local searches are done inside leastBS coverage area. The discovered SBS is then included in the list of nearby SBSs, called NSBlt. • The NSBlt is ordered in lower to higher order based on the loads and their ids contained in the SIDlt. Likewise, the SBS loads are recorded in higher to lower form in the SDlt. Using Equation (9), the leastBS load is thus transferred to the SIDlt. • If the leastBS SBS traffic load is successfully transferred to the SIDlt, the leastBS SBS status is changed to a sleep mode, and the Dep_BSs list is updated. Otherwise, this procedure is aborted, and the Con_Grap is reset to its original network. This procedure is repeated until the leastBS traffic burden is distributed among its adjacent SBSs. 5.1. Evaluation Scenario of TASCP A random traffic pattern is considered for UEs distribution, and uniform distribution for SBSs deployment in the network area of 1000 * 1000 m2. The random distribution of 200 UEs with different size of SBSs such as 25 and 61 are deployed as shown! in Fig.3. Here, the circles denote the UEs and diamonds represent the deployment locations of the SBSs in the network area. The main aim of the TASCP is to minimize the number of active SBSs and maximize the network energy efficiency. BSlds = l?=1((l^alj)/SMax) (8) SIDlds = tf^ [^Ц- leastBS] (9) ^^1 SDj Where SD1? is the traffic sharing percentages to the SIDlt. MATLAB is used to estimate the number of active SBSs that are used to provide services in the HetNet. The network performance in terms of energy efficiency, network throughput, convergence time, and number of active SBSs are calculated for different sizes of UEs. The metrics are validated through simulations. These simulations are based on a statistical model that includes parameters like user distribution, and traffic patterns to reflect realistic network scenarios. The experimental parameters are considered in the evaluation of the proposed TASCP which are presented in Table 1 based on [24, 25]. Table 1. Simulation parameters Parameter Value Bandwidth 20 MHz pmax 40 dBm $max 30 pa 39 dBm ps 35 dBm a -174 dBm/Hz 8th -5 dB 1 load 90% Algorithm 2 Small Cell Optimization() 0: Input: set of UEs N , set of SBSs M , Con_Grap 0: Output: Dep_BSs 0: Initialization: BS^ = 0,SNlds = 0,Dep1Ss = 0,leastBS = 0,NS Blt = 0 0: while Con_Grap = 0 do 0: for each SBS ieM do 0: if (Sj = 1) then 0: BSlds =Compute the traffic load of the SBSt using Equation 8 0: D ep_B S s = D ep_B S s U S B St 0: end for0: end if0: end for 0: SortBSLds 0: least1'' = Identify the least traffic SBS from the BSlds 0: for each SBS ieM do 0: Perform the local search within coverage area of least1' 0: if (Sj = 1) then 0: NSBlt = SBSt 0: end if0: end for 0: S!Dlt = Sort asc(NSBlt) 0: SDlt = Sort dsc(NSBlt) 0: SDLds = Share the least1' traffic to SIDLt by using Equation 9. 0: if (load (least1') shared successfully) then 0: State (least1') = sleep 0: Update Dep_BSs 0: else 0: Abort process and recover original Con_Grap 0: end if0: end while=0 (a) Distribution of 200 UEs with 25 SBSs Fig.3. Distribution scenario of UEs and SBSs (b) Distribution of 200 UEs with 61 SBSs О 0.1 0.2 0.3 0.4 0.5 0.6 0.7 0.8 0.9 1 Distance (a) Association of the 200 UEs with 25 SBSs Fig.4. SCF: Initial connection from the UEs to SBSs О 0.1 0.2 0.3 0.4 0.5 0.6 0.7 0.8 0.9 1 Distance (b) (b) Association of the 200 UEs with 61 SBSs The TASCP consists of two parts, i.e., SCF and SCO. The SCF provides the initial connection of the UEs to SBSs. The SCF results in a fully connected graph without redundant links between the UEs and SBSs. The results of the SCF algorithm with the distribution of 200 UEs under 25 and 61 SBSs are shown in Fig.4. The resultant connected graph is given as input to the proposed SCO. The SCO algorithm identifies the load of each SBS, and finds the least loaded SBS from the calculated load list. Then, a local search within the transmission range of the identified SBS is conducted, and a list of neighboring SBSs is generated. The load of the identified SBS (least loaded SBS) is shared among the neighboring SBSs list by considering Equation (9). If the load is transferred successfully, then the mode of the SBS is switched to sleep mode. This process is continued until there is no possibility of sharing the traffic of the SBS with neighbor SBSs. The result of the SCO is shown in Fig.5. (a) Under 25 SBSs Fig.5. SCO: Number of active SBSs (b) Under 64 SBSs Fig.5a shows the final deployment positions of the SBSs with 25 initial locations of the SBSs. Here, the active SBSs decrease from 25 to 10 and EE is improved. Similarly, in Fig.5b, the number of active SBSs are reduced from 61 to 9. From Fig.5, it is observed that when 61 SBSs are deployed, the active number of SBSs are found to be lower than when 25 SBSs are deployed. As the dense deployment locations of the SBSs that we have more option to find the final deploymentlocations of the SBSs. 5.2. Evaluation Results of TASCP The proposed TASCP method is compared with Self-organized SBS Deployment Strategy (SSDS) [22] and UE As- sociation and SBS On/Off (USOF) algorithm algorithm [21]. These algorithms are chosen for comparison due to their widespread use and relevance in improving energy efficiency and network performance. The SSDS, USOF algorithm and the Proposed Framework (PF) are simulated on the different instances of the network scenario to evaluate the network performance. The SSDS algorithm [22] randomly chooses one SBS and turns it off. Then, the associated UEs of that SBS are re-associated to the other SBSs. The main limitation of SSDS is that in each iteration, one base station is turned off randomly. The network is restored where the network specifications are unsatisfied. A total of (k 1) iterations are required to select one SBS for switching off. Here, k is the number of SBSs in the S-CN. This process continues until there is no more SBS that can be switched off. The SBS switch-off method minimizes the energy efficiency of the network. Similarly, USOF algorithm [21] switches off the least loaded SBS from the network, and the network is regenerated. If a network is not created then the network is recovered from the previous process, and the process is stopped. In the proposed framework, the least loaded SBSs are switched off until it is not possible to switch off any more SBSs, and thenetwork is recreated. If this is not possible then the old network is restored. In the following sections, the results of the proposed method are analyzed and compared with SSDS and USOF algorithms based on network performance parameters such as comparative assessment of number of active SBS, EE of the SCN, network throughput and convergence time of each algorithm. A. Comparative Number of Active SBSs Evaluation In this section, the number of active SBSs are identified by using the proposed framework. Also, the obtained results are compared with SSDS and USOF methods. The primary assessment of the Proposed Framework (PF), USOF and SSDS is performed on various size of UEs such as 100, 150, 200, 250 and 300 with different size of SBSs, i.e., 25 and 61number of SBSs, which are shown in Fig.6. (a) Under 25 SBSs (b) Under 61 SBSs Fig.6. Number of active SBSs with respect to different density of UEs and SBSs (a) Under 25 SBSs (b) Under 61 SBSs Fig.7. Energy efficiency with respect to different density of UEs and SBSs Fig.6a represents the number of active SBSs for a total of 25 deployed SBSs with different density of UEs for the proposed framework, USOF and SSDS algorithms. The number of active SBSs by the USOF model is increased by 12% for 100 UEs, 25% for 150 UEs and 10% for 200 to 300 UEs as compared to the proposed framework. Similarly, by the SSDS method, the number of active SBSs is increased by 50% for 100 to 150 UEs, 30% for 200 UEs and 25% for 250 to 300 UEs compared to the proposed framework. The number of active SBSs for different density of UEs with constant 61 number of SBSs for the proposed framework, USOF and SSDS algorithms are shown in Fig.6b. The number of active SBSs by the USOF model is increased by 14% for 100 UEs, 25% for 150 UEs and 12% for 200 to 300 UEs compared to the proposed framework. Similarly, by the SSDS method, the number of active SBSs is increased by 50% for 100 to 150 UEs, 30% for 200 UEs and 20% for 250 to 300 UEs compared to the proposed framework. The impact of deploying SBSs of different densities and various sizes of UEs is observed in Fig.6. Moreover, the number of active SBSs in the proposed framework are decreased when 61 number of SBSs are initially deployed as compared to the 25 number of SBSs are deployed. The distance between the UEs and the SBSs diminishes due to the different densities of the SBSs. (a) Under 25 SBSs (b) Under 61 SBSs Fig.8. Network throughput with respect to different density of UEs and SBSs B. Comparative Evaluation of Network Energy Efficiency The network Energy Efficiency (EE) is evaluated with respect to different densities of UEs and SBSs in Fig.7. Energy Efficiency of the proposed framework, USOF algorithms and SSDS algorithms are used with different size of UEs (i.e., 100, 150, 200, 250 and 300) at constant of 25 and 61 SBSs as shown in Fig.7a and Fig.7a, respectively. It is observed from Fig.7 that the network EE increases in the proposed framework as compared to USOF and SSDS. Moreover, the EE in the proposed framework is increased 5% approximately when 61 SBSs are initially deployed as compared to when 25 SBSs are deployed. This happens because of fewer active SBSs in the proposed framework when 61 SBSs are deployed. C. Comparative Evaluation of Network Throughput In this section, the achieved network throughput by the proposed framework is compared with USOF algorithms and SSDS algorithms. The achieved network throughput of the proposed framework, USOF model and SSDS model for the distribution of different size of UEs such as 100, 150, 200, 250, 300 with different number of SBSs, i.e., 25 and 61 are shown in Fig.8a and Fig.8b, respectively. As observed, network throughput achieved in the proposed framework is enhanced as compared to the USOF model and SSDS model. It is noticed that the network throughput of the proposed work is higher due to the less number of active SBSs in the SCN. D. Comparative Evaluation of Convergence Time Convergence time is defined as the time taken to optimize the number of active SBSs in the SCN. Fig.9 compares the convergence time of the proposed framework (PF) with USOF model and SSDS model when the different densities of UEs and SBSs are distributed. As different number of UEs at 25 SBSs and 61 SBSs (see Fig.9a and Fig.9b) are placed, the lowest convergence time in USOF model as compared to PF and SSDS model. The convergence time of the SSDS method increases by 10% for 25 s-SBs and 10% to 15% for 61 SBSs compared to the PF. Therefore, the convergence time is little higher in PF as compared to the USOF method. However, the Energy Efficieny (EE), network throughput is higher in proposed framework as compared to USOF model due to a smaller number of SBSs are activate. Proposed frameworkwill reduce the financial burden on network operators and improves network performance. Fig.9. Convergence time with respect to different density of UEs and SBSs We designed a Traffic Adaptive Small Cell Planning (TASCP) framework to handle dynamic mobile traffic in HetNets. The proposed TASCP consists of Small Cell Formation (SCF) and Small Cell Optimization (SCO)phases. The SCF phase provides the initial association of UEs to the SBSs, resulting in a fully connected graph without any redundant links from UEs to SBSs. The UE association is performed according to the dynamic mobile traffic by considering the choices of UE and load of the SBSs. The connected graph is given as input to the SCO phase, and it operates the modes of the SBS while minimizing the number of active SBSss in the HetNet. Changing the active SBS to a sleep mode is depend on the traffic load without compromising the UEs’ services. The extensive evaluation of the proposed TASCP improves the EE and minimizes the number of active small base stations in the HetNet. In the future, we develop a decentralized small cell network for network resource and computational operations management during traffic handling in the ultra-dense network. Moreover, small cell planning considers mobility and dynamic activity of the UEs for UE association and deployment of small base stations.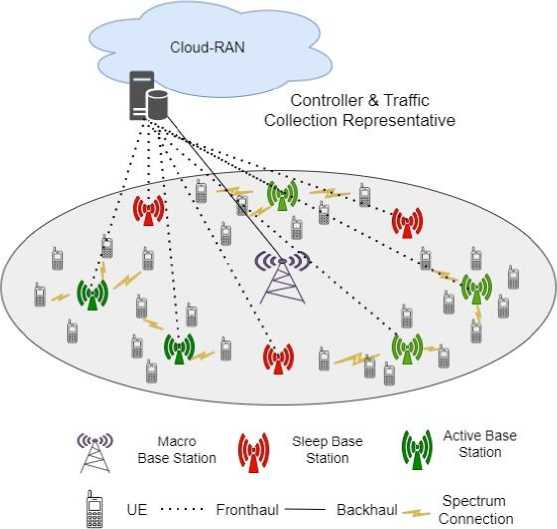
^2X,yi (7)