Traffic noise forecasting on Tashkent city main streets

Author: Kholikov Alisher I., Azizov Kudratulla Kh.
Journal: Журнал Сибирского федерального университета. Серия: Техника и технологии @technologies-sfu
Section: Математическое моделирование. Численный эксперимент
Article in issue: 2 т.15, 2022.
Free access
Traffic noise is considered to be the most important that must be eliminated within the environmental problems of cities, as well as lead to various diseases of the population living in the roadside area. The article analyzes the work done to date on this topic, and for the first time examines the relationship between traffic flow and its impact on the noise level, which is the main source of traffic noise on the main streets of Tashkent. Traffic noise measured by GOST 20444-2014 «Noise. Traffic flow. According to» methods of measuring noise description « conducted in the 1 class NORSONIC140(Nor140) noise according to GOST17187-2010(IES61672-2002). Also, on the basis of the research, a model for forecasting traffic noise on the main streets of Tashkent was developed and compared with other models.
City highway streets, traffic noise, traffic intensity, traffic composition, traffic speed, basic diagram of traffic flow, density of trasnport flow, practical road capacity, regression analyze, model prediction models
Short address: https://sciup.org/146282426
IDR: 146282426 | UDC: 625.78
Прогноз дорожного шума на главных улицах Ташкента
Считается, что шум трафика - наиболее важный элемент, который должен быть устранен в рамках решения экологических проблем городов, поскольку может привести к различным заболеваниям населения, проживающего в придорожной полосе. В представленной работе впервые исследуется связь между потоком трафика и уровнем шума на главных улицах Ташкента. Шум движения оценивали согласно ГОСТ 20444-2014 «Шум. Транспортные потоки. Методы определения шумовой характеристики» и ГОСТ 17187-2010 (IEС 61672-2002) «Шумомеры» в соответствии с руководством пользователя Norsonic 140 (NOR140). На основе исследования была разработана модель прогнозирования дорожного шума на главных улицах Ташкента, проведено ее сравнение с другими моделями.
Text of the scientific article Traffic noise forecasting on Tashkent city main streets
Цитирование: Холиков, А. И. Прогноз дорожного шума на главных улицах Ташкента / А. И. Холиков, К. Х. Азизов // Журн. Сиб. федер. ун-та. Техника и технологии, 2022, 15(2). С. 248–260. DOI: 10.17516/1999-494X-0388
|
SCHEME 1. Negative impact of noise on a person |
||||||||
|
' V |
||||||||
|
Noise level, 30-40 dBA - At night it can cause anxiety and malaise. |
Noise level, 50-60 dBA - Has a harmful mental effect. |
Noise level 70 -85 dBA (long time effect)
|
Noise level 85-90 dBA (long time effect) - Ear pain;
exposure. |
The noise level is higher than 130 dBA - Contusion; - Sharp weakening of the ability to lead. |
||||
-
2. Methods
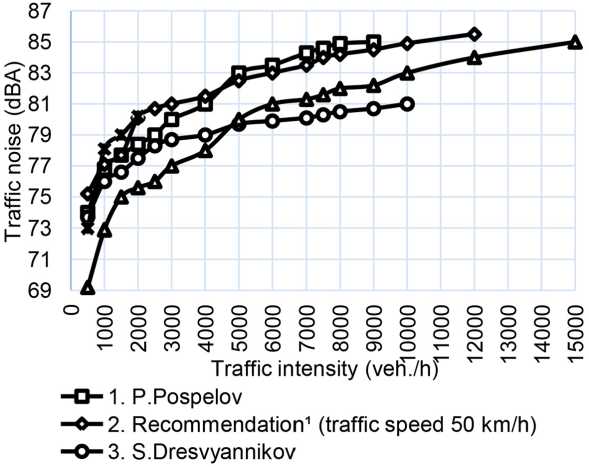
Traffic noise can also be seen as an increase in traffic noise with an increase in the amount and speed of movement on the basis of a certain law. The results of the research conducted by most scientists[10,11,12,13,14] are summarized below in Fig.1.
The results of the research presented in Fig. 1 above show that the traffic speed and the traffic intensity should be taken into account the percentage of trucks contained in it. To date, no observations
-
1 Recommendations for taking into account the requirements for environmental protection in the design of highways and bridge crossings.
Fig 1. The effect of the amount of movement on traffic noise (the graph was prepared by A. Kholikov based on the authors' data)
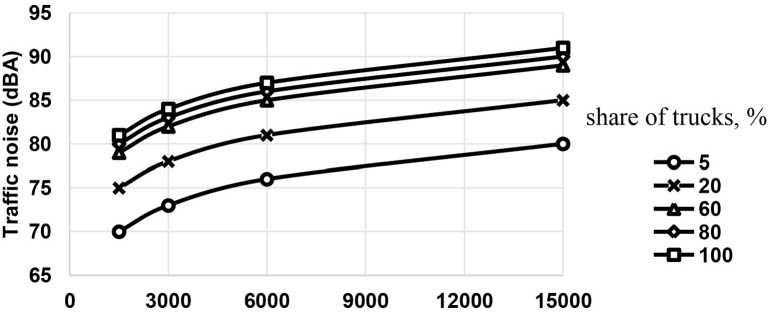
have been made on the impact of the share of trucks in the amount of movement of the main streets in the cities of the Republic on traffic noise. G. Osipov [13] and P. Pospelov [15] conducted observations of the influence of the share of trucks in the volume of traffic in the CIS countries on traffic noise, the results of which are presented in Fig. 2.3, respectively.
According to the above information, it is necessary to know the state of traffic noise in the main streets of Tashkent City. For the first time in Tashkent we conducted research on the effect of the amount, speed and composition of movement on traffic noise. Observations were carried out on the main streets of the city of Tashkent, which are presented in Table 1 as research objects:
Traffic intencity (veh./h)
Fig 2. According to the results of G. Osipov's observation, the impact of the share of trucks in the intensity on traffic noise.
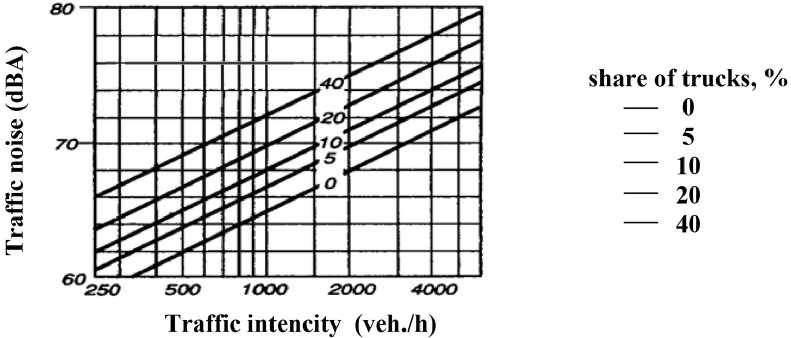
Fig 3. According to the results of P. Pospelov's observation, the impact of the share of trucks in the intensity on traffic noise.
Table 1. Characteristics of research object
|
№ |
Street name |
Surface condition |
Lanes |
|
1 |
Nurafshon |
3х2 |
|
|
2 |
New Sergeli |
||
|
3 |
Nukus |
Coating defect-free, movement structure 97–100 % light vehicles |
4х2 |
|
4 |
Amir Temur |
||
|
5 |
Little ring road |
Coating defect-free, movement structure 5–20 % heavy vehicles |
4х2 |
By analyzing several methods for measuring traffic noise [16], GOST 20444–2014 «Noise. Traffic flow. Methods of measuring the description of noise « [17] measuring work on the Nor140 device [18] in order to measure the traffic noise, the microphone of the Hummer was placed at a distance of 7,5±0.2 m from the axis of the edge motion tape of the vehicle and at a height of 1.5±0.1 m from the surface. The intensity was calculated by a mobile device to the image, the traffic speed was measured using a stopwatch, and the results obtained were processed by a mathematical-statistical method.
-
3. Results and discussion
The results of the research carried out on the main streets of the city with 3x2, 4x2 lanes, which are the selected objects, are presented in the following 4,5 pictures.
The research presented in Fig. 1 Above and the results obtained on the main streets in Tashkent City differ from each other. On the streets of the city of Tashkent, almost all light cars with the content of movement are cars produced in our country. The amount of movement itself to evaluate the traffic noise does not give a sufficiently accurate result, that is, with an increase intensity, the traffic speed also changes. This requires the study of the connection of the state of traffic noise according to the basic diagram of the traffic flow.

Fig 4. Influence of speed and traffic intensity on traffic noise on city highways with a 3х2 lane
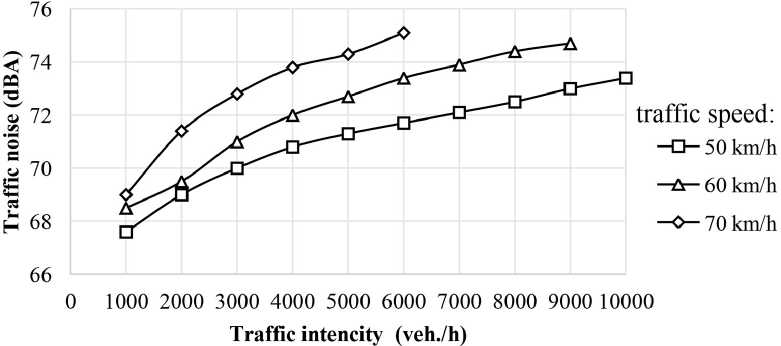
Fig 5. Influence of speed and traffic intensity on traffic noise on city highways with a 4х2 lane
In the study of traffic flows, it is considered a holistic process characterized only by external parameters. With this approach, macroscopic models are created that take into account such characteristics as the speed, intensity of traffic flow, traffic density, etc. (Fig. 6) [19].
If we analyze the diagram, then the left part of the curve reflects the steady state of the traffic flow, then the partially connected and connected stream reaches the point of maximum conduction – the ability to transfer (point Na max = Pa). In the process of these changes, the speed of the traffic flow decreases, characterized by the tangent of the angle of inclination α of the radius vector drawn from 0 point to the desired point of the curve, which characterizes the change of Na. One of the research findings was α. According to the results of observations conducted on Temur street, its ability to conduct was studied, as well as the link between the main diagram of the flow of transport and the level of noise in transport is presented in Fig. 7.
According to the basic diagram of the traffic flow, with an increase in the density of the traffic flow, the noise level decreases. In the observations of S. Dresvyannikov [11], the density of the traffic flow increased from 40 avt/km to 100 auto/km, which determined a decrease in the equivalent level of
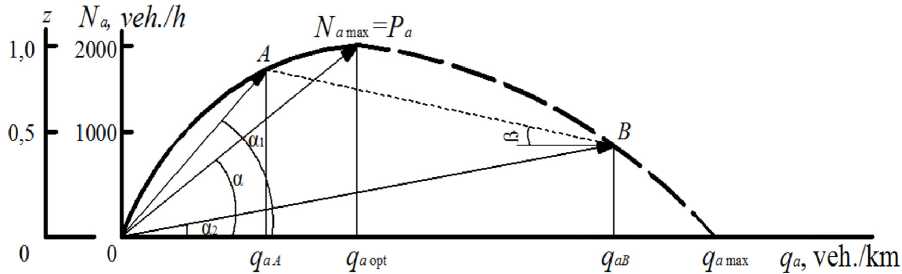
Fig 6. Basic diagram of traffic flow
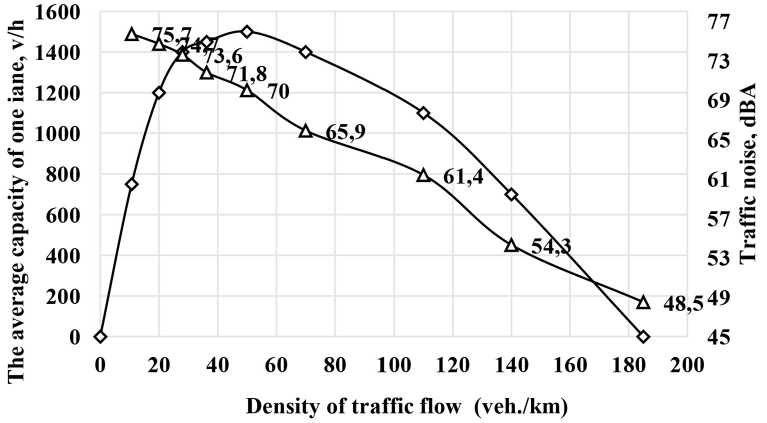
—О— Basic diagram of traffic flow
—Д— Traffic noise
Fig 7. Basic diagram of traffic flow and interaction of traffic noise noise from 75 DBA to 70 DBA. A. On Temur Shokh street, traffic flow density increased from 20 auto /km to 100 avt/km, noise equivalent level decreased from 75,8 DBA to 68,5 DBA (Fig. 8).
Another important consideration in obtaining a clear result on the main diagram of the traffic flow and the interaction of traffic noise is the share of trucks in the content of this amount of movement.
As a result of the study of the impact of the share of trucks in the amount of movement on the level of traffic noise, it was concluded that P. Pospelov, G. Osipov the state of traffic noise can be seen in Fig. 9 in case of 20 % of heavy trucks in the composition of the total amount of movement in the results of observation on the main streets of Tashkent City.
Since the state of traffic noise would be different, depending on the characteristics of the cars in which each country is involved in the amount of movement. The impact of the main indicators of traffic flow on traffic noise in the conditions of the city of Tashkent was determined. Based on the results obtained, preliminary data were obtained for the development of a model for forecasting future traffic noise in terms of the amount of movement, speed and composition, as well as the state of traffic noise of the main streets in the city of Tashkent will be possible to evaluate the model developed in the future.
Statistical methods are often used to find their empirical correlation by processing the observational results.
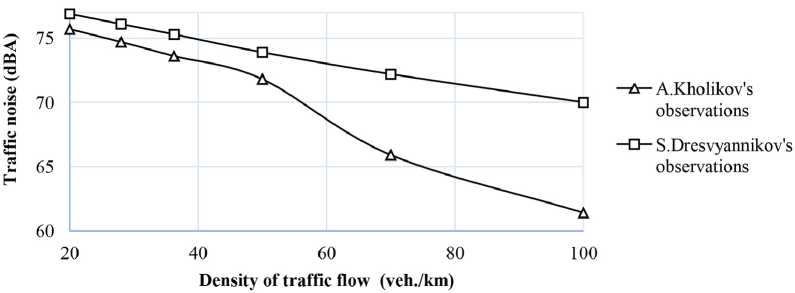
Fig 8. Change of traffic noise relative to traffic flow density
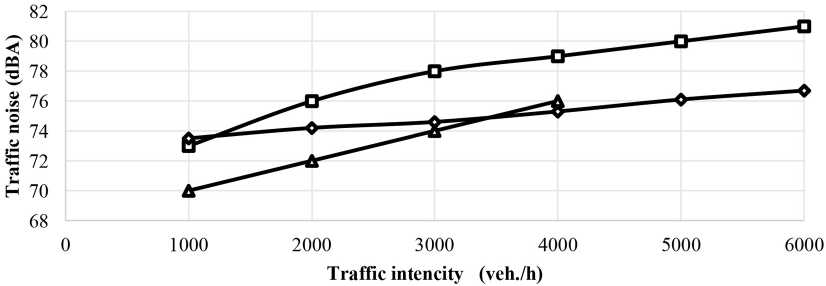
Fig 9. Traffic noise status of the intensity, which is 20 % of the heavy vehicles in the composition
The concept of relationship between mathematical quantities is represented by the concept of the function y = ((x) when one value of the argument x corresponds to only one of the values of the function y [20]. There is a linear relationship between the amount of motion and the noise level in the models improved by [21] and P. Pospelov[22], S. Yu. Dresvyannikov[12], N. N. Minina[23], Z. Xudoyberdiyev[24], V. Vasilova[25], E. S. Karnaux[26], T. Subramani [27] and between created models until these days as FHWA model(USA), CoRTN(Enland), German standard: RLS90 model (Germany), Italian C. N.R. model (Italy), StL86+(Shweden), ASJ RTN-Model 2008(Japan), Nord 2000 Model(Norway)
In the modeling of the conducted analyzes by the methods of correlation-regression analysis, the factors considered play an important role in the selection of the best forms of communication.
The multivariate regression equation can be expressed as follows [28]:
Y = f(β, X) + ε, here: X = (X1, X2,…, Xm) – vector of independent (explanatory) variables; β – vector of parameters (to be determined); ɛ – random error; Y – dependent variable.
The most commonly used theoretical linear regression equation of multivariate regression models is: Y = β0 + β1 X 1 + β2 X 2 + … + β mXm + ε or for individual observations i, i = 1,2, …, n:
y i = β 0 + β 1 x i 1 + β 2 x i 2 + … + β m x im + ε i .
here β=(β 0 , β 1 ,….β m )- vektor of unknown parametres (m+1), β j coefficient, j=1,2,… ., m, j-theoretical coefficient of regression. This coefficient describes the effect of the value of Y on the change in Xj. Based on n observation to asses equation of regression is evaluated as follows:
ŷ = b0 + b1x1 + b2x2 + … + bmxm here: b0, b1, …, bm ‒ evaluation of parameters β0, β1, …, βm.
During the measurement of traffic noise on the city's main streets, more than 400 measurements were made and 8 indicators affecting it were measured, and as a result of regression analysis using Excel on the basis of all indicators, we obtained the following model:
Lэкв=16,1+2,6ln(N)+7,5ln(V)+1,1ln(P)+0,83ϕ+0,03T+0,02F+0,41IRI‑0,02n here: N-movement rate, avt / h; V-speed, km / h; Percentage of trucks in the P-traffic volume,%; roughness of pH coating, mm; T-air temperature, ̊S; F-humidity,%; IRI-coating smoothness, m / km; n is the number of bands.
We examine the significance of the regression equation based on Fisher's F-criterion. Calculated value equal to (Fequal) = 381,47. The value of the F-criterion in the table is 0.95 with a confidence interval of 1.96 and the degrees of freedom u1 = k = 8 and u2 = p-k-1 = 411–8–1 = 402 drawn up.
If Fcalculations > Ftable, the regression equation must be recognized as true..
The R correlation indicates that there is a gypsum correlation between factors with a multiplicity factor of 0.94.
R2 shows that about 88 percent of the involuntary variable variability with a plurality coefficient of 0.88 was accounted for in the model, and 12 percent was conditioned by other factors not included in the model.
Table 2
|
Y (L) |
X1(N) |
X2(V) |
X3(P) |
X4( ϕ) |
X5(n) |
X6(T) |
X7(F) |
X8(IRI) |
|
|
В fl o > Q ri fl |
45 Ph SI |
fl fl Ch 45 P О ^ 5 у й 5 5 ° 6 Я у н й д 2 Ph cj .Д 45 |
S E 00 S s SS |
s о ч cd e5 |
О |
о U S |
Table 3. Conclusion of the results
Regression statistics
|
Multiple R |
0,940003 |
|
R-square |
0,883605 |
|
Normalized R-square |
0,881289 |
|
Standard error |
1,208997 |
|
Observations |
411 |
|
Analysis of variance |
||||
|
df |
SS |
MS |
F |
|
|
Regression |
8 |
4460,683 |
557,5853 |
381,4705 |
|
Remainder |
402 |
587,5927 |
1,461673 |
|
|
Итого |
410 |
5048,275 |
||
|
Coefficients |
Standard error |
t-statistics |
P-Value |
Lower 95 % |
Upper 95 % |
Lower 95,0 % |
Upper 95,0 % |
|
|
Y-inter-section |
16,20114 |
1,408877 |
11,49933 |
1,19E-26 |
13,43146 |
18,97083 |
13,43146 |
18,97083 |
|
N |
2,580842 |
0,111717 |
23,10154 |
9,41E-76 |
2,361219 |
2,800465 |
2,361219 |
2,800465 |
|
V |
7,427337 |
0,21682 |
34,2557 |
2,7E-121 |
7,001093 |
7,85358 |
7,001093 |
7,85358 |
|
P |
1,079308 |
0,083466 |
12,21226 |
2,17E-29 |
0,855224 |
1,183392 |
0,855224 |
1,183392 |
|
ϕ |
0,856587 |
0,183324 |
4,672526 |
4,06E-06 |
0,496193 |
1,216981 |
0,496193 |
1,216981 |
|
T |
0,032808 |
0,009853 |
3,32962 |
0,00095 |
0,013437 |
0,052178 |
0,013437 |
0,052178 |
|
F |
0,015933 |
0,006207 |
2,566704 |
0,010628 |
0,00373 |
0,028136 |
0,00373 |
0,028136 |
|
IRI |
0,424058 |
0,153309 |
2,766034 |
0,005936 |
0,12267 |
0,725445 |
0,12267 |
0,725445 |
|
n |
-0,02015 |
0,049087 |
-0,41044 |
0,681705 |
-0,11665 |
0,076353 |
-0,11665 |
0,076353 |
Table 4
|
L |
N |
V |
P |
ϕ |
T |
F |
IRI |
n |
|
|
L |
1 |
||||||||
|
N |
0,21182265 |
1 |
|||||||
|
V |
0,83052255 |
-0,16115103 |
1 |
||||||
|
P |
0,51788157 |
-0,2782489 |
0,45128775 |
1 |
|||||
|
ϕ |
0,06870358 |
0,05175355 |
-0,056536 |
0,11298845 |
1 |
||||
|
T |
0,01221733 |
-0,13292011 |
-0,07001468 |
0,33622374 |
-0,05461618 |
1 |
|||
|
F |
0,02763409 |
0,02371008 |
0,13004953 |
-0,30293307 |
-0,20318145 |
-0,66446049 |
1 |
||
|
IRI |
0,18571707 |
-0,06484675 |
0,26848534 |
-0,09254632 |
-0,2366946 |
-0,13568968 |
0,23209232 |
1 |
|
|
n |
-0,24053778 |
0,25905384 |
-0,35085319 |
-0,33315244 |
0,23911646 |
-0,15889478 |
0,06007489 |
0,08451249 |
1 |
We evaluate the significance of the regression coefficients using the Student's t criterion.
The calculated values of the Student criterion are as follows: b1 = 23.1; b2 = 34.2; b3 = 12.2; b4 = 4.67; b5 = 3.3; b6 = 2.6; b7 = 2.8 b8 = 0.4; At the significance level a = 0.05 and the number of degrees of freedom y = p-k-1 = 402, the value of the criterion in the table is 1.96. When │bn│> ttable, the regression coefficients b1,2,… ..8 are significant. │b5│
Lэкв=16,1+2,6ln(N)+7,5ln(V)+1,1ln(P)+0,83ϕ+0,03T+0,02F+0,41IRI
The improved model matrix shows that the increase in traffic noise is mainly due to the speed of movement. Next is the amount and composition of action in terms of importance. The movement was excluded because the number of tapes was not significant.
This formula serves to determine the noise level when planning buildings along city highways. To verify the reliability of the improved model and compare it with existing models, the following real measured noise levels are shown in the graph in Table 5 and Fig. 10.
-
4. Conclusion
For the first time, the state of traffic noise on the main streets of Tashkent was studied as a result of research. Due to the fact that 90–95 % of the cars in the traffic volume are national cars, the basic model of noise forecasting for the main streets of Tashkent has been improved. The R correlation of the improved model indicates that there is a gypsum correlation between factors with a multiplicity factor of 0.94. Also, R2 shows that about 88 percent of the involuntary variable variability with a plurality coefficient of 0.88 was accounted for in the model, and 12 percent was conditioned by other factors not included in the model. It can be seen that the difference between the improved model and the real measured results is up to 0.5–2 dBA. You can also see the StL86 + model with a difference of 4–5 dBA close to the real results compared to other models. The results of the remaining 8 models cannot be used to determine the noise level of the main streets of Tashkent. Based on the results of traffic noise forecasting using the improved model, it is possible to take measures to prevent future acoustic inconveniences.
Table 5
|
№ |
Time, hour |
N, avt / hour |
V, km / h |
P,% |
Φ, mm |
T, °C |
F,% |
IRI, m/km |
Real result, дБА |
Model result, дБА |
|
1 |
700–800 |
3552 |
65 |
3 |
1,2 |
25 |
40 |
2,5 |
73,3 |
73,3 |
|
2 |
800–900 |
5688 |
60 |
3 |
1,2 |
25 |
40 |
2,5 |
73,9 |
73,9 |
|
3 |
900–1000 |
6180 |
30 |
3 |
1,2 |
25 |
40 |
2,5 |
71,5 |
68,9 |
|
4 |
1000–1100 |
5580 |
40 |
3 |
1,2 |
25 |
40 |
2,5 |
70,6 |
70,9 |
|
5 |
1100–1200 |
5544 |
40 |
3 |
1,2 |
25 |
40 |
2,5 |
70,6 |
70,8 |
|
6 |
1200–1300 |
5751 |
40 |
3 |
1,2 |
25 |
40 |
2,5 |
70,6 |
70,9 |
|
7 |
1300–1400 |
5280 |
42 |
3 |
1,2 |
25 |
40 |
2,5 |
70,8 |
71 |
|
8 |
1400–1500 |
5220 |
42 |
3 |
1,2 |
25 |
40 |
2,5 |
72,8 |
71 |
|
9 |
1500–1600 |
5076 |
44 |
3 |
1,2 |
25 |
40 |
2,5 |
71,1 |
71,3 |
|
10 |
1600–1700 |
5352 |
42 |
3 |
1,2 |
25 |
40 |
2,5 |
70,9 |
71,1 |
|
11 |
1700–1800 |
5290 |
42 |
3 |
1,2 |
25 |
40 |
2,5 |
70,8 |
71 |
|
12 |
1800–1900 |
4644 |
45 |
3 |
1,2 |
25 |
40 |
2,5 |
69,1 |
71,3 |
|
13 |
1900–2000 |
6840 |
30 |
3 |
1,2 |
25 |
40 |
2,5 |
69,8 |
69,2 |
|
14 |
2000–2100 |
5616 |
50 |
2 |
1,2 |
25 |
40 |
2,5 |
72 |
72,1 |
|
15 |
2100–2200 |
4068 |
62 |
1 |
1,2 |
25 |
40 |
2,5 |
72,2 |
72,2 |
|
16 |
2200–2300 |
2676 |
68 |
1 |
1,2 |
25 |
40 |
2,5 |
70,9 |
71,8 |
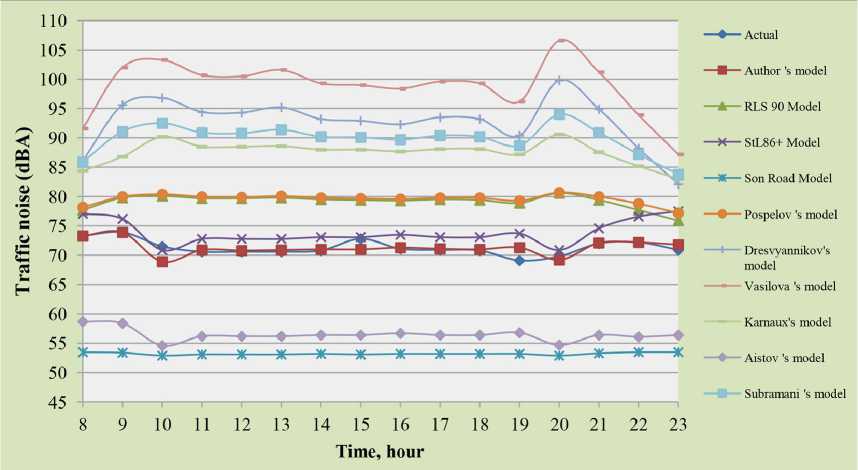
Fig 10. Comparison of improved model and existing models
References Traffic noise forecasting on Tashkent city main streets
- A. Vaitkus et al. Surface Type and Age Effects on Tyre/Road Noise Levels Environmental Engineering. Proceedings of the International Conference on Environmental Engineering. ICEE. Vilnius Gediminas Technical University, Department of Construction Economics & Property. Vilnius, 2017, 10, 1-8. Google scholar. D01:10.3846/enviro.2017.152 https://search.proquest.com/openview/15a 758c2991d577d73b18243f3c2375f/1?pq-origsite=gscholar&cbl=1646341
- S. A. Ahmad, P. K. Sarkar. Traffic noise studies on arterial and collector road in Delhi, India, Int. J. Struct. Civ. Eng. Res. 2014, 3(2). Google scholar http://ijscer.com/uploadfile/2015/ 0421/ 20150421032521626.pdf
- M. Maghrour Zefreh, A. Torok. Theoretical Comparison of the Effects of Different Traffic Conditions on Urban Road Traffic Noise. Hindawi Journal of Advanced Transportation, 2018, Article ID7949574, pp. 1-12. Google scholar. https://doi.org/10.1155/2018/7949574
- H. Karibasappa, L. Yeshodha, G. Seemon Rayappa Raja. Effect of Traffic Volume and Speed on Noise Level Under, Interrupted and Uninterrupted Traffic Flow Condition - A Case Study on NH - 7. International Journal of Science and Research (IJSR), 2015, 4 (9), September Paper ID: SUB157852. pp. 163167. Google scholar. https://pdfs.semanticscholar.org/1914/9a3870f44c364b5f6c63066cc918898ede4d.pdf
- Actual problems of development of highways: report «Highway Traffic» 2019 year. Tashkent, 2020.
- S. A. Misnichenko, and N. V. Priymak., Accounting for the roughness of the coating in determining traffic noise on highways. Student club «Alternative». 2013. http://www.cs-alternativa. ru/author/2381.
- A. S. Ivanova, Influence of parameters of roadside forest strips on noise reduction near highways (on the example of the Saratov right bank), Ph.D. thesis. Saratov, 2014. https://www.sgu.ru/ sites/default/files/dissertation/2014/09/23/ivanovaas_diss.pdf
- M. M. Haines, S. Brentnall, S. A. Stansfeld, E. Klineberg. Qualitative responses of children to environmental noise. Noise & Health, 2003, 5, 19, 19-30. Google scholar. https://www.noiseandhealth. org/article.asp?issn=1463-1741; year=2003; volume=5; issue=19; spage=19; epage=30; aulast=Haines
- Yu. V. Yermina, Development and research of special clothing for protection against aggressive acoustic environment. Ph.D. thesis. Mines, 2016. 261 p. https://www.dissercat.com/content/ razrabotka-i-issledovanie-spetsialnoi-odezhdy-dlya-zashchity-ot-vozdeistviya-agressivnoi-aku
- P. I. Pospelov, V. I. Purkin, B. A. Shit. ODM 218.2.013-2011. Methodological recommendations for the protection of territories adjacent to highways from traffic noise. Moscow, 2011. 127 p. https://rosavtodor.gov.ru/storage/app/media/uploaded-files/16odm-2182013-2011.pdf
- Recommendations for taking into account the requirements for environmental protection in the design of highways and bridge crossings. Ministry of Transport of the Russian Federation. Moscow, 1995. https://rosavtodor.gov.ru/file/6416411
- S. Y. Dresvyannikov, «Research and justification of reducing the acoustic impact of traffic flow on the ecosystem of Bishkek», Ph.D. thesis, Bishkek, 2014. https://bilim.akipress.org/lib/book:1209/ dresvyannikov-sergej-yurevich-issled/
- M. V. Butorina, «Drawing up a road noise map and using it to reduce noise in residential buildings», Ph.D. thesis. Saint-Petersburg, 2002. https://elibrary.ru/item.asp?id=16065479
- G. L. Osipov, V. E. Korobkov, A. A. Klimukhin, et al.; Ed. by G. L. Osipov. Noise protection in urban planning. Stroyizdat, 1993. 96 p. http://science.totalarch.com/book/2824.rar
- E. V. Shcherbina. Assessment of the impact of road traffic flows on the noise regime of the urban environment. [Electronic resource]. Access mode: https://e-univers.ru/upload/iblock/fe0/ fe07a8f614c1e571ed8e900eb60d49d7.pdf
- K. X. Azizov, A. I. Kholikov Methods of measuring traffic noise. Bulletin of TARI. Tashkent 2019, 2, 38-44 https://www.researchgate.net/publication/351059093_Methods_of_measuring_traffic_ noise_Bulletin_of_TARI_No_22019_Tashkent_2019_pp_38-44
- GOST 20444-2014 «Noise. Traffic flow. Methods for measuring noise description». Moscow, 2014. https://allgosts.ru/17/140/gost_20444-2014
- Technical characteristics of the Nor 140. [Electronic resource]. Access mode: (https://web2. norsonic.com/product_single/soundanalyser-nor140/).
- I. N. Pugachev, A. E. Gorev, E. M. Oleshchenko. Organization and road safety: a textbook for students. higher. studies. Moscow: Publishing Center «Academy», 2009. p. https://www.studmed.ru/ pugachev-in-organizaciya-i-bezopasnost-dorozhnogo-dvizheniya_5191adba9e5.html
- 20.V.B.Shashkov. Applied regression analysis. Multivariate regression: Textbook. Orenburg: GOU VPO OSU, 2003. 363 p.
- J. Quartieri and etc. A Review of Traffic Noise Predictive Models. Conference: Recent Advances in Applied and Theoretical Mechanics Recent Advances in Applied and Theoretical Mechanics. 2009. P 72-80. https://www.researchgate.net/publication/239729871_A_Review_of_ Traffic_Noise_Predictive_Noise_Models
- P. I. Pospelov. Fighting noise on highways. Moscow, Transport, 1981. 88 p.
- N. N. Minina. The problem of reducing the acoustic impact on residential buildings during the design, construction and operation of transport facilities. Abstract for the competition of the scientist Doctor of Technical Sciences. St. Petersburg. 2012-51 p.
- Z. I. Khudaiberdiev. «The influence of road conditions and the mode of movement of a mixed vehicle-tractor flow on the formation of traffic noise in the area of residential development. Abstract for the competition of the scientist Ph. D. Moscow, 1995. 18 p.
- V. Vasilieva. Assessment of the impact of traffic flows on the acoustic environment of the urban area. Abstract. Dissertation for the degree of candidate of technical sciences. Eagle. -2008. -18 s.
- Yu. I. Zakharov, E. S. Karnaukh. Model for calculating the equivalent sound level from a moving stream of road transport. Visnik PDABA. No. 6 worm 2014. pp. 22-29.
- T. Subramani, M. Kavitha, K. P. Sivaraj. Modelling Of Traffic Noise Pollution. International Journal of Engineering Research and Applications (IJERA). Vol. 2, Issue 3, May-Jun 2012, pp. 3175-
- Lyubimtsev O. V., Lyubimtseva O. L. Linear Regression Models in Econometrics. Toolkit. Nizhny Novgorod, NNGASU, 2016. 45 p.
