Transformation of the resettlement system and its demographic manifestations: research experience at the regional and municipal levels

Author: Korolenko Aleksandra V.
Journal: Economic and Social Changes: Facts, Trends, Forecast @volnc-esc-en
Section: Social and economic development
Article in issue: 2 т.16, 2023.
Free access
The global demographic trend of the 20th and early 21st century was the process of urbanization, which manifested itself, among other things, in the concentration of the population in large and superlarge megacities with a rapid decline in the rural population. In Russia the transformation of resettlement was expressed in polarization and localized compression of the socio-economic space, fragmentation of the supporting framework of territories. Despite the fact that the issues of resettlement transformation at the national and regional level have been studied, there is still a need for in-depth research on its intraregional trends and patterns. The purpose of the work was to look into the peculiarities of urban and rural resettlement transformation and its demographic manifestations at the regional and municipal level. The model region was the Vologda Oblast, a typical constituent entity of the Russian Federation and northern Non-Chernozem region. The information base consisted of data from the All-Russian Population Censuses of 2002, 2010 and 2020, and the current statistical records of Rosstat and its territorial department in the Vologda Oblast. The methods of cartography, structural-dynamic analysis of resettlement characteristics and demographic indicators, the typology of municipal entities by the ratio of the components of population change, and the main indicators of the demographic situation were used. We have identified the following trends in the transformation of resettlement systems in the region: increasing polarization of urban and rural resettlement, expressed in the concentration of residents either in large or in small settlements; depopulation of rural areas; weakening of the supporting framework of urban resettlement (system of small towns); strengthening “focality” rural settlement. In more than half of the Vologda Oblast municipal entities the urban and rural population decrease is caused by the double effect of natural and migration losses. At the same time, the number and the share of such municipalities have grown significantly over the past 20 years. Some municipalities have the potential of migration growth or age structure, but only in Kaduysky District there is an increase in population due to the migration growth of urban residents. In the conclusion the threats and opportunities for development for different types of municipalities are outlined.
Resettlement system, urban and rural resettlement, demographic situation, natural movement, migration, municipal entities, vologda oblast
Short address: https://sciup.org/147240784
IDR: 147240784 | UDC: 911.3:312.9 | DOI: 10.15838/esc.2023.2.86.7
Text of the scientific article Transformation of the resettlement system and its demographic manifestations: research experience at the regional and municipal levels
The research was carried out at the expense of the Russian Science Foundation, project no. 22-28-01986,
Today’s most important global demographic trend is the process of urbanization, which manifests itself in a rapid increase in the number and proportion of the urban population, especially those who live in large and super-large megacities, and a rapid decrease in the rural population. Thus, according to the UN, the urban population grew from 750 million to 4.2 billion people from 1950 to 2018, and its share in the total population increased from 30 to 70%. Almost a quarter of the world’s population lives in million-plus cities (23%), and 7% of them live in megacities (with a population of 10 million or more). According to the forecast, by 2035, 29% of the world’s population will live in million-plus cities1. In the late 20th and early 21st centuries in a number of countries (USA, Germany, UK, France, Japan, Russia) the problem of “shrinking cities” characterized by significant population decrease due to various reasons – suburbanization, deindustrialization, economic crises, transition to a market economy (in the case of Russia), etc., clearly manifested itself (Efremova, 2015).
The key trends in the transformation of resettlement, according to Russian experts, are the concentration of rural and urban population in large settlements against the background of depopulation of the rest of the countryside and depopulation of most cities, which inevitably leads to the shrinkage of socio-geographical space and its polarization (Nefedova, Glezer, 2020). The stratification of Russia’s inhabited space is connected with the relatively sparse network of large cities. Huge spaces outside the suburbs with a strong outflow of population become a socio-demographic “desert”. Particularly strong are the processes of population polarization in the rural areas of the old-developed areas of the Non-Chernozem region with its small population2.
One of the objectives of the Spatial Development Strategy of the Russian Federation for the period until 2025 was to reduce the level of interregional differentiation in the socio-economic development of the constituent entities of RF by improving the sustainability of the resettlement system3. The sustainability of the resettlement system largely depends on the presence of a supporting framework of territories formed by major centers and transport highways. But the influence of such cities on the socio-economic development is gradually decreasing in the “center – periphery” direction, which leads to the formation of strong spatial gaps both between and within regions (Sobolev, 2015). As the population is moving into large settlements centers and their zones of influence in peripheral areas, the demographic and labor potential, and socio-economic well-being are significantly reduced. In the Non-Chernozem regions, the problem of polarization of resettlement, especially rural resettlement, is the most acute due to significant intraregional contrasts along the vector “center-periphery” (Egorov, 2020). This fact leads to the need for studies that deepen the understanding of the nature and consequences of the transformation of resettlement at the intraregional level. The purpose of our study was to examine the transformation of urban and rural resettlement and its demographic manifestations at the regional and municipal level.
Theoretical aspects of the research
Population resettlement is both a process of people’s distribution over the territory, and its result in the form of a set (network) of settlements on a certain territory4. For a long time it was considered that the study of resettlement was of interest only to the geography of population and settlements, but nowadays this concept is used not only in socioeconomic geography, but also in landscape studies, geoecology, and many non-geographical sciences (urban planning, regional and spatial economy, sociology, demography, history, ethnology) (Tkachenko, 2018).
The concept of “resettlement system” is widely used in Russian studies, while the corresponding English-language term is difficult to find (more often applied at the local level). In Russian science, it is understood as a group of settlements within one territory, between which there are spatial and functional relationships (Glezer et al., 2014).
Spatial transformations of population resettlement systems are considered by foreign and Russian researchers within the framework of diffe rential urbanization and resettlement evolution theories (Fielding, 1989; Geyer, Kontuly, 1993; Zayonchkovskaya, 1991; City and Village..., 2001; Glezer, Weinberg, 2013; Nefedova et al., 2015), concepts of economic space organization (Christaller, 1933; Losch, 1954), the theory of regional inequality in the level of socio-economic development (Zubarevich, 2010), the center-periphery concept of spatial development (Partridge et al., 2006; Polese, Shearmur, 2006; Borsdorf, Salet, 2007; Swiaczny et al., 2009; Karachurina, Mkrtchyan, 2013), “shrinking cities” theory (Baron et al., 2010; Pallagst et al., 2013; Haase et al., 2014; Nam, Richardson, 2014), concepts of agglomeration processes (Friedmann, 1966; Richardson, 1993; Krugman, 1998; Morgunov et al., 2021). Russian authors, when interpreting the drivers and consequences of the transformation of resettlements systems, more often rely on the concepts of differential urbanization and center-periphery spatial development. They focus on the evolution of the settlement structure and the accompanying changes in socio-economic and demographic processes.
As features of urban and rural space changes, considered through the prism of the history of Russian territories development, their socioeconomic contrasts and demographic dynamics, the deficit and low density of cities (big, large and the largest), population concentration in regional centers, depopulation and disappearance of small rural settlements, concentration of rural residents in large settlements and suburbs of large cities are noted. As a result, there is a fragmentation of the basic framework of territories and a pronounced localized shrinkage of socio-economic space (Nefedova, Glezer, 2020).
The problem of increasing polarization in resettlement systems is analyzed, in particular, for the Northwestern economic region. During the study on how the level of development and distribution of productive forces affects demographic processes and trends in the transformation of the resettlement system in the Leningrad, Novgorod and Pskov oblasts, the discrepancy of existing regional systems of resettlement to the spatial structure of the regional economy, with a negative impact on demographic processes and migration activity of residents, especially in rural settlements, which is expressed in the excessive concentration of labor resources in the largest and medium-sized cities of the regions, and also in the increase of the demographic burden on the working-age population in peripheral areas (Sobolev, 2015).
Based on the grouping of Russian municipal entities by population density and position in the center-periphery system, it was found that more than half of the country’s residents (53%) live in densely populated areas close (up to 50 km) to regional centers, which occupy only 5% of RF territory. In turn, 5% of Russians live in 14% of municipal entities, located more than 300 km from the regional center and with a population density of less than 10 people/km2, but occupy 66% of the territory of the country. There have been identified municipalities called “bear corners”, which are remote from regional centers for 500 km or more and with a population density of less than 1 person/km2, but occupy more than % of the area of Russia. The grouping of municipal entities simultaneously according to the population density indicator and migration parameters showed that net migration in all streams, except international, has a clearly expressed relationship with population density: the more sparse the territory, the more often it experiences an outflow of residents, and vice versa (Karachutina, Mkrtchyan, 2016).
In the development of Russia’s urban settlement system, such trends have been detected as an increase in the number and share of population in million-plus cities; a decrease in the number of residents in cities with a population of 50,000 or less; an outflow of migrants, labor force and intellectual capital from small and medium-sized cities; the aging of small city population; and the increasing contrast of resettlement due to the growing gap between megacities and provincial cities (Fattakhov et al., 2019).
The key trend in the transformation of the rural resettlement structure in the country is the polarization of the network of rural settlements, expressed in the rapid growth of the smallest settlements share and a slight increase in the share of the largest, with the simultaneous washout of small and medium-sized settlements. According to the indicators of rural resettlement (average population, the share of unoccupied and small settlements, the proportion of the population of small and large settlements) N.V. Zubarevich distinguishes the following types of territories of Russia: small-settled Non-Chernozem (7% of the rural population), shredded medium-settled regions (12%), agglomerations with the most polarized settlement (5%), medium-settled regions (30%), medium-large-settled regions (26%), large-settled regions (20%) (Zubarevich, 2013). Uneven evolution of rural resettlement in RF regions is also manifested in the fact that a gradual “subsidence”
of the entire network with a slow decrease in the average population occurs in relatively prosperous regions of the forest-steppe zone, while the “collapse” of the network is typical for regions of the Non-Chernozem zone with a decrease in the average number of settlements due to their fragmentation and transfer into the category of the smallest. The constant enlargement of settlements while maintaining the overall pattern of the network is characteristic only of a small number of regions in southern Russia (Alekseev, Safronov, 2015).
The transformation of resettlement systems has become an object of research of Vologda scientists. The rural resettlement of the region for the period between the censuses of 2002 and 2010 revealed trends of increasing the number and share of empty rural settlements, reducing the share of residents of small and medium-sized rural settlements with a simultaneous increase in the number of large settlements, population concentration in the zone of influence of large cities – Vologda and Cherepovets (Soldatova, 2016; Uskova, Patrakova, 2021). At the same time, the largest share of uninhabited settlements is characteristic of the rural areas of the near periphery: Vologodsky, Ust-Kubinsky, Gryazovetsky, Velikoustyugsky and other districts (Uskova, Patrakova, 2021). A unique feature of the Vologda Oblast’s rural resettlement system is its “cluster” character in the north and east of the region, where relatively small (within 200 people) settlements are grouped in treeless areas, forming a kind of “bushes”, most often in river valleys (Averkieva, 2017).
Despite the fact that the issues of resettlement transformation at the national and regional level have been studied, there is still a need to study its intraregional trends and patterns in depth. Of particular importance is the consideration of longterm trends in urban and rural resettlement systems in relation to the characteristics of the demographic development of territories, which allows us to assess not only the development of territories, but also their demographic potential and the prospects for population dynamics. The relevance of studying these problems increases in connection with the release of data from the All-Russian Population Census 2020 (conducted in 2021; hereinafter – ARPC-2020). The key categories of this work are “resettlement system” and “demographic situation”: the former reflects the characteristics of the population distribution in the territory, the later – the parameters of population size, its dynamics and structure. The combination of both categories in a single study allows us to assess the interdependence of population distribution across the territory with the ongoing demographic processes on it, which is extremely relevant to the search for tools to ensure a sustainable and balanced spatial development of the country and its individual regions.
Materials and methods
The Vologda Oblast, which is a typical representative of the Russian Federation and the northern regions of the Non-Chernozem region, was chosen as the object of the study. By the area occupied, the Vologda Oblast is ranked 26th out of 85 constituent entities of RF (144.5 sq. km), but by the permanent population size it takes only 43rd place (1151.0 thousand people), and by population density it is ranked 62nd (8.0 people per 1 sq. km)5 in the bottom half of the rating. This fact indicates a low population density in the region and indirectly the focal character of resettlement. In addition, the region is steadily included in the number of RF constituent entities with descending population dynamics (Shabunova et al., 2021), which against the background of low density of resettlement creates a real threat of depopulation of most of its territories and, consequently, the growth of space polarization and socio-economic inequalities.
The need of understanding the nature, demographic and socio-economic consequences of the resettlement transformations observed on the territory of the region, determines their consideration from the perspective of the normative approach , according to which all settlements located within the boundaries of the considered territory are automatically included in the corresponding system of resettlement. Its advantages are the inseparability of the resettlement system from the administrative-territorial division of the region and the accessibility of the information required for analysis.
The information base of the study is the data of the All-Russian censuses of 2002, 2010 and 2020, and the current statistical records of the Federal State Statistics Service and its territorial department in the Vologda Oblast. The resettlement was described with the use of its key indicators: population density, average population, the amount of settlements and the number of population in each of them. Demographic manifestations of the resettlement transformation were assessed by indicators of changes in the population and its components (natural movement and migration), the age composition of the population. Among the research methods of the resettlement systems and demographic manifestations of their transformation, structural-dynamic analysis, which allows us to trace both the current state and characteristics of changes in the indicators of population distribution, cartographic and geoinformation methods, which help to reflect the spatial features of population distribution and visualize them, are generally recognized. The methods mentioned above have been used in previously reviewed works (Sobolev, 2015; Alekseev, Safronov, 2015; Karachutina, Mkrtchyan, 2016; Fattakhov, Nizamutdinov, Oreshnikov, 2019; Nefedova, Glezer, 2020; etc.). In the course of the study, in addition to the above methods, we used the typology of municipal entities by the ratio of components of population change, and by the ratio of the main indicators of the demographic situation. The advantage of this method is in the demographic classification of municipalities: in the first case by the contribution of indicators of natural movement and migration to the dynamics of urban and rural population, in the second case by the nature of the demographic situation and, among other things, the potential for its improvement in urban and rural areas. Before the mapping and typology of municipal entities, they were grouped according to the values of indicators (population density, population size, age structure of the population). Three groups of municipalities were distinguished: with low, average and high values of indicators. Municipalities with values of indicators in the range “arithmetic mean ± standard deviation” were selected in the middle group, municipalities with values below or above this range were assigned to the groups with low and high levels of indicators respectively.
In our study the resettlement systems of the Vologda Oblast at the municipal level are considered in the context of 26 municipal districts and two urban okrugs. Since January 1, 2022 in the course of the territorial organization of local self-government reform, 20 municipal districts were transformed into municipal okrugs. In view of the need to track long-term trends in the transformation of settlement at the intraregional level, this paper takes the old system of administrative-territorial organization as the basis.
Main results
Transformation of urban and rural resettlement systems in the region
The index of population density by municipalities of the Vologda Oblast demonstrates a wide range of values and indicates an uneven distribution of residents on the region’s territory (Fig. 1) . An increased concentration of population, in addition to the territories of large cities – Vologda and Cherepovets – is characteristic of the nearby municipal entities – Sheksninsky, Vologodsky and Sokolsky districts. Municipalities with medium and
Figure 1. Population density of Vologda Oblast municipal entities, 2021, people per 1 km2
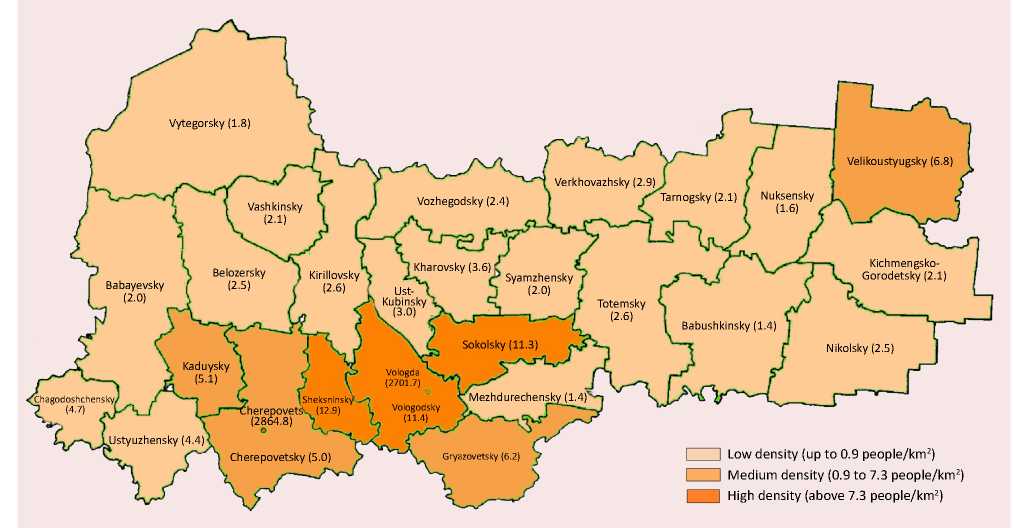
According to: Demographic Yearbook of the Vologda Oblast. 2021: Statistical Collection. Vologdastat, 2022.
high population density (excluding Velikoustyugsky District) are located in the agglomeration zone of the Vologda and Cherepovets monocentric agglomerations. The former includes Vologodsky, Gryazovetsky and Sokolsky districts and the latter includes Cherepovetsky, Sheksninsky and Kaduysky districts (Kozhevnikov, 2018). The observed features of population distribution over the region’s territory may be caused by the agglomeration factor.
According to the ARPC-2020, the Vologda Oblast has 15 cities and 8 urban-type settlements (hereinafter – UTS; Tab. 1 ). 13 of the 15 cities are small (with a population of up to 50 thousand people), and 7 of them are cities with a population of 5 to 10 thousand people (Belozersk, Krasavino, Kirillov, Nikolsk, Totma, Ustyuzhna, Kharovsk). The region has two large cities (from 250 to 500 thousand people) – Vologda and Cherepovets. Among eight urban-type settlements three have a population of up to 5 thousand people (Kuzino,
Khokhlovo, Sazonovo), three – from 5 to 10 thousand people (Vozhega, Vokhtoga, Chagoda) and two – from 10 to 20 thousand people (Kadui, Sheksna). At the same time, 80% of the urban population lives in large cities, 55% of the inhabitants of urban-type settlements live in UTS with a population of 10 to 20 thousand people.
The following transformations took place in the urban resettlement system of the Vologda Oblast in the period between the censuses of 2002 and 2020: the number of the smallest cities (with a population under 10 thousand people) and their population increased, while the number of small towns with a population from 10 to 50 thousand people and their population decreased, the concentration of urban population in large cities and large urban-type settlements increased. The observed changes indicate the increasing polarization of the urban resettlement system and the weakening of its supporting framework (the system of small cities).
Table 1. Grouping of urban settlements of the Vologda Oblast by population
Groups by population, people Number of settlements, units 2002 2010 2020 2020 to 2002 (+/-) 2020 to 2010 (+/-) abs. % abs. % abs. % abs. % abs. % Cities Total 15 100.0 15 100.0 15 100.0 0 - 0 - up to 5000 - - 1 6.7 1 6.7 +1 +6.7 0 0,0 5000–9999 4 26.7 6 40.0 7 46.7 +3 +20.0 +1 +6.7 10000–19999 7 46.7 4 26.7 3 20.0 -4 -26.7 -1 -6.7 20000–49999 2 13.3 2 13.3 2 13.3 0 0.0 0 0,0 50000–99999 - - - - - - - - - - 100000–249999 - - - - - - - - - - 250000–499999 2 13.3 2 13.3 2 13.3 0 0.0 0 0.0 Urban-type settlements (UTS) Total 12 100.0 9 100.0 8 100.0 -4 - 0 - up to 5000 6 50.0 4 44.4 3 37.5 -3 -12.5 -1 -6.9 5000–9999 4 33.3 3 33.3 3 37.5 -1 +4.2 0 +4.2 10000–19999 1 8.3 1 11.1 2 25.0 +1 +16.7 +1 +13.9 20000–49999 1 8.3 1 11.1 0 0.0 -1 -8.3 -1 -11.1 Population, people Cities Total 795476 100.0 789290 100.0 776964 100.0 -18512 - 0 - up to 5000 - - 4796 0.6 4106 0.5 +4106 +0.5 -690 -0.1 5000–9999 30451 3.8 52144 6.6 53687 6.9 +23236 +3.1 +1543 +0.3 10000–19999 83649 10.5 48168 6.1 36630 4.7 -47019 -5.8 -11538 -1.4 20000–49999 76461 9.6 70117 8.9 63412 8.2 -13049 -1.4 -6705 -0.7 50000–99999 - - 0 0.0 - - - - - - 100000–249999 - - 0 0.0 - - - - - - 250000–499999 604915 76.0 614065 77.8 619129 79.7 +14214 +3.7 +5064 +1.9 Urban-type settlements (UTS) Total 81096 100.0 60563 100.0 50613 100.0 -30483 - 0 - up to 5000 17582 21.7 8306 13.7 5699 11.3 -11883 -10.4 -2607 -2.4 5000–9999 30101 37.1 20020 33.1 17325 34.2 -12776 -2.9 -2695 +1.1 10000–19999 11798 14.5 11284 18.6 27589 54.5 +15791 +40.0 +16305 +35.9 20000–49999 21615 26.7 20953 34.6 0 0.0 -21615 -26.7 -20953 -34.6 According to: Results of the All-Russian Population Census of 2002. Available at: ; Results of the All-Russian Population Census of 2010. Federal State Statistics Service. Available at: ; Results of the All-Russian Population Census of 2020. Federal State Statistics Service. Available at:
Since 2000, the population of urban-type settlements Kuzino (Velikoustyugsky District), Vokhtoga (Gryazovetsky District), Sazonovo (Chagodoshchensky District), and small cities Krasavino (Velikoustyugsky District) and Kharovsk has decreased by more than 30%, more than a quarter – UTS Chagoda and Belozersk (Fig. 2). Gryazovets and the UTS Kaduy had the smallest decrease in the urban population (less than 10%). The increase in population during this period was noted only in the UTS Sheksna (by 16%) and in Vologda (by 3%). The number of Cherepovets residents decreased insignificantly (by 4%). Five urban-type settlements (Ustye, Tonshalovo, Chebsara, Imeni Zhelyabova and Molochnoe) were administratively transformed into rural settlements in the 2000s.
Figure 2. Cities and urban-type settlements in the Vologda Oblast by urban population in 2000 and 2021*, thousand people
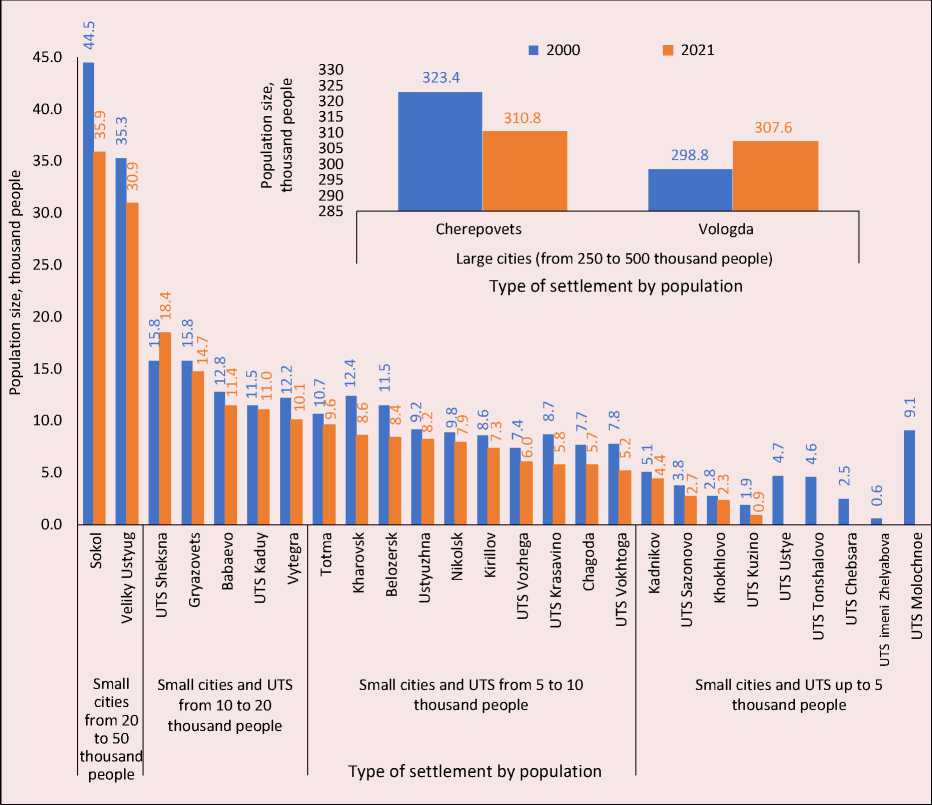
* Cities and UTS are ranked by urban population in 2021.
According to: Demographic Yearbook of the Vologda Oblast. 2021: Statistical Collection. Vologdastat, 2022; Demographic
Yearbook of the Vologda Oblast. 2000: Statistical Collection. Vologdaoblkomstat, 2001.
According to the ARPC-2020, the most common type of rural settlements by population in the Vologda Oblast are settlements with the number of inhabitants up to 10 people, or the so-called one-ward settlements (40% of the total number of rural settlements; Tab. 2). The second most common are rural settlements without population, they account for 30% of the total number of rural settlements. It is noteworthy that the Vologda Oblast is among the regions with the maximum share of rural settlements without population, maintaining its position since 2002 (Korolenko, 2023). Small settlements with a population of 11 to 200 people account for 27% of the total number of rural settlements. The share of medium-sized and large settlements does not exceed 5% of the total number of rural settlements. It is remarkable that the largest contribution to the total number of rural residents in the region comes from small settlements with a population of up to 200 people
Table 2. Grouping of rural settlements of the Vologda Oblast by population
|
Group by population, people |
Number of settlements, units |
|||||||||
|
2002 |
2010 |
2020 |
2020 to 2002 (+/-) |
2020 to 2010 (+/-) |
||||||
|
abs. |
% |
abs. |
% |
abs. |
% |
abs. |
% |
abs. |
% |
|
|
Total |
8041 |
100.0 |
8006 |
100.0 |
7844 |
100.0 |
-197 |
- |
-162 |
- |
|
Uninhabited |
1625 |
20.2 |
2131 |
26.6 |
2313 |
29.5 |
+688 |
+9.3 |
+182 |
+2.9 |
|
up to 10 |
3046 |
37.9 |
3228 |
40.3 |
3160 |
40.3 |
+114 |
+2.4 |
-68 |
0.0 |
|
11–200 |
2971 |
36.9 |
2300 |
28.7 |
2079 |
26.5 |
-892 |
-10.4 |
-221 |
-2.2 |
|
201–500 |
266 |
3.3 |
229 |
2.9 |
186 |
2.4 |
-80 |
-0.9 |
-43 |
-0.5 |
|
501–1000 |
81 |
1.0 |
69 |
0.9 |
62 |
0.8 |
-19 |
-0.2 |
-7 |
-0.1 |
|
1001–2000 |
31 |
0.4 |
26 |
0.3 |
22 |
0.3 |
-9 |
-0.1 |
-4 |
0.0 |
|
2001–5000 |
17 |
0.2 |
17 |
0.2 |
19 |
0.2 |
+2 |
0.0 |
+2 |
0.0 |
|
over 5000 |
4 |
0.0 |
6 |
0.1 |
3 |
0.0 |
-1 |
0.0 |
-3 |
-0.1 |
|
Population, people |
||||||||||
|
Total |
392996 |
100.0 |
352591 |
100.0 |
315250 |
100.0 |
-77746 |
- |
-37341 |
- |
|
up to 10 |
14288 |
3.6 |
14207 |
4.0 |
12995 |
4.1 |
-1293 |
+0.5 |
-1212 |
+0.1 |
|
11–200 |
124590 |
31.7 |
99208 |
28.1 |
89207 |
28.3 |
-35383 |
-3.4 |
-10001 |
+0.2 |
|
201–500 |
84072 |
21.4 |
70266 |
19.9 |
57878 |
18.4 |
-26194 |
-3.0 |
-12388 |
-1.5 |
|
501–1000 |
56905 |
14.5 |
48446 |
13.7 |
44306 |
14.1 |
-12599 |
-0.4 |
-4140 |
+0.4 |
|
1001–2000 |
40014 |
10.2 |
34454 |
9.8 |
31025 |
9.8 |
-8989 |
-0.4 |
-3429 |
0.0 |
|
2001–5000 |
49936 |
12.7 |
50473 |
14.3 |
61518 |
19.5 |
+11582 |
+6.8 |
+11045 |
+5.2 |
|
over 5000 |
23191 |
5.9 |
35537 |
10.1 |
18321 |
5.8 |
-4870 |
-0.1 |
-17216 |
-4.3 |
According to: Results of the All-Russian Population Census of 2002. Available at: ; Results of the All-Russian Population Census of 2010. Federal State Statistics Service. Available at: croc/; Results of the All-Russian Population Census of 2020. Federal State Statistics Service. Available at:
(28% of the total rural population). In turn, every fourth rural inhabitant lives in a large rural settlement with a population of 2,000 or more.
In the rural settlement system of the Vologda Oblast in the intercensal period there were trends of depopulation of territories, an increase in the number of one-ward settlements in the total number of rural settlements, an increase in the concentration of rural residents either in small settlements or in large settlements. Thus, the rural space of the region is characterized by increasing polarization and increasing “focality” of settlement.
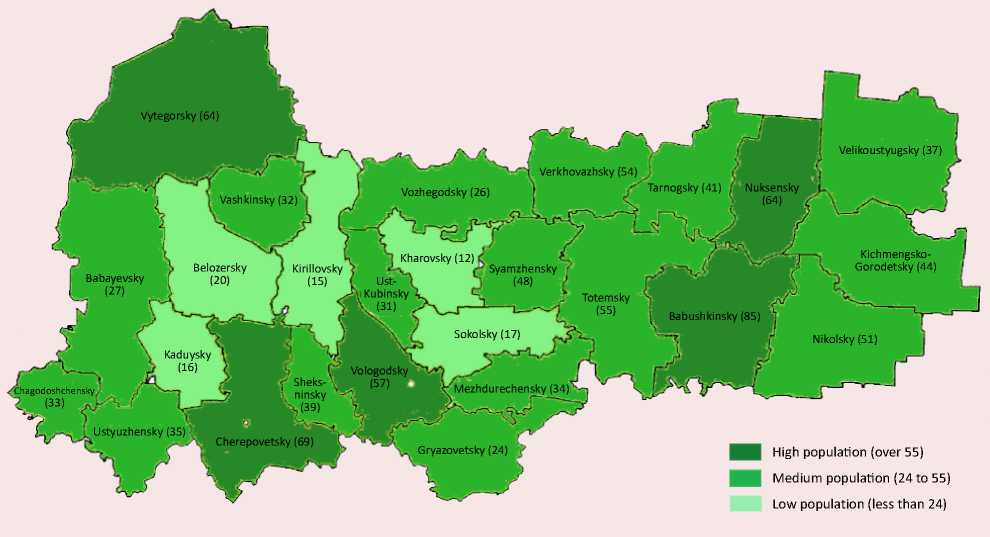
In 2021 the average population of rural settlements in the Vologda Oblast was 40 people. A high level of average population is observed in Babush-kinsky, Cherepovetsky, Nyuksensky, Vytegorsky, Vologodsky and Totemsky districts (Fig. 3). In turn, the lowest indicator is characteristic of Kharovsky, Belozersky, Sokolsky, Kaduysky and Kirillovsky districts. In other municipalities there is an average value of human population. Obviously, the eastern part of the region is less characterized by the problem of low population density of rural settlements and small populations, which is associated with the later development of these territories and the valley nature of settlement in them (Soldatova, 2016).
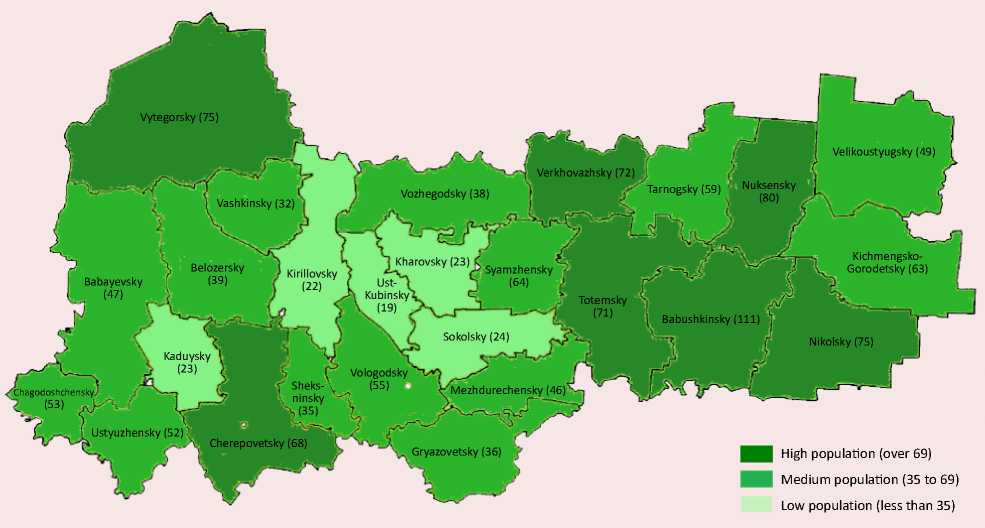
Compared to 2000, in 2021 in most municipal districts of the Vologda Oblast there was a decrease in the population of rural settlements, with the most intensive process in western districts – Belozersky, Kharovsky, Babaevsky, Vashkinsky and Chago-doshchensky (Fig. 3, 4) . The increase in population during this period was recorded only in four municipalities – Ust-Kubinsky, Sheksninsky, Vologodsky and Cherepovetsky, but it was due solely to administrative factors, namely the transformation of UTS into rural settlements in some areas (Ustye in Ust-Kubinsky, Chebsara in Sheksninsky, Tonshalovo in Cherepovetsky, Molochnoe in Vologodsky).
Figure 3. Average population of rural settlements in municipal districts of the Vologda Oblast in 2021, people per settlement
Vytegorsky (64)
Velikoustyugsky (37)
Verkhovazhsky (54)
Vozhegodsky (26)
Babushkinsky (85)
Sokolsky (17)
Nikolsky (51)
Mezhdurechensky (34)
Gryazovetsky (24) ?
High population (over 55)
Medium population (24 to 55)
Low population (less than 24)
Kichmengsko-Gorodetsky (44)
Kaduysky (16)
Totemsky (55)
Belozersky (20)
Vologodsky (57)
Babayevsky (27)
Tarnogsky (41) Nuksensky (64)
Kirillovsky (15)
Chagodoshchensky (33)
Sheks-ninsky (39)
Ust-Kubinsky (31)
Kharovsky (12)
Syamzhensky (48)
Ustyuzhensky (35)
: <—'л Cherepovetsky (69)
According to: Demographic Yearbook of the Vologda Oblast. 2021: Statistical Collection. Vologdastat, 2022.
Figure 4. Average population of rural settlements in municipal districts of the Vologda Oblast in 2000, people per settlement
Vytegorsky (75)
Velikoustyugsky (49)
Verkhovazhsky (72)
Vozhegodsky (38)
Babushkinsky (111)
Sokolsky (24)
Nikolsky (75)
Mezhdurechensky (46)
Gryazovetsky (36)
Kichmengsko-Gorodetsky (63)
Kaduysky (23)
Kirillovsky (22)
Totemsky (71)
Belozersky (39)
Vologodsky (55)
Babayevsky (47)
Tarnogsky (59) Nuksensky (80)
Chagodoshchensky (53)
Sheks-ninsky (35)
Ust-Kubinsky (19)
Kharovsky (23)
Syamzhensky
- (64)
Ustyuzhensky (52)
Cherepovetsky (68)
High population (over 69)
Medium population (35 to 69)
Low population (less than 35)
According to: Demographic Yearbook of the Vologda Oblast. 2000: Statistical Collection. Vologdastat, 2001.
In general, the observed situation allows us to talk about the existence of “centers” of rural settlement: on the one hand, in municipalities located in the zone of socio-economic influence of large cities (Vologda and Cherepovets), on the other hand, in eastern areas of the region with historically established “clusters” of resettlement, but their role in the concentration of rural residents is reduced.
Demographic manifestations of the resettlement systems transformation
In 2000–2009 and 2015–2021 in the Vologda Oblast there was a total loss of urban population: in 2000–2002, 2005–2009 – due to the excess of its natural loss over migration growth, in 2016 – due to the excess of its migration loss over natural growth, in 2003, 2017–2021 – due to the double effect of natural and migration loss (Fig. 5). In some years the total loss of urban population in the region was mainly due to the administrative transformation of urban settlements into rural ones: in 2004 – the transformation of the UTS Ustye and Tonshalovo into settlements, and the UTS Molochnoe into a village, in 2012 – the transformation of the UTS Chebsara into a settlement, in 2015 – the transfer of part of the urban population of the UTS Sheksna into a rural settlement. In 2010–2011, 2013–2014 there was an increase in the number of urban residents of the region, in 2010–2011 – due to the excess of migration growth over natural loss, in 2013–2014 –
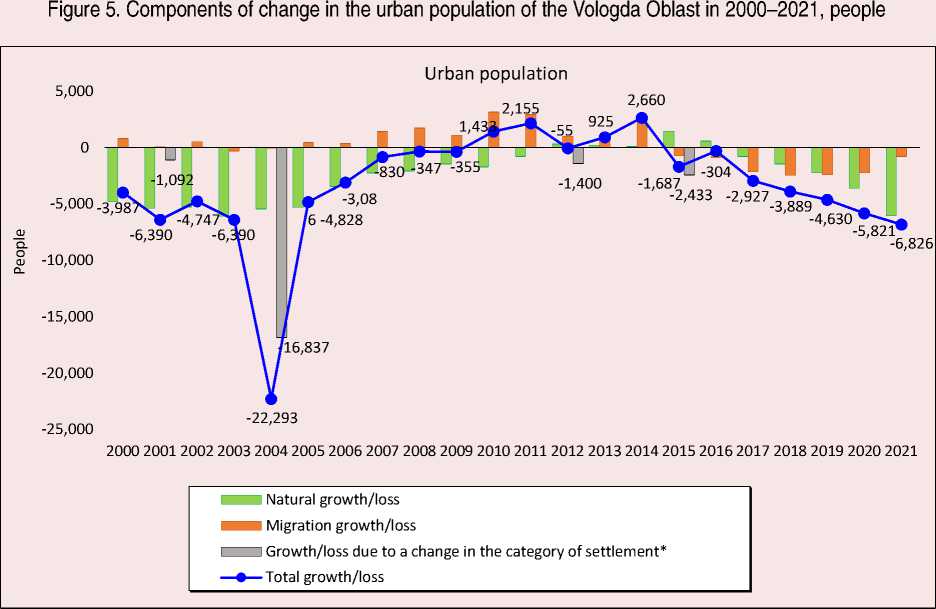
* Changes in the number of urban (rural) population, which occurred as a result of the transformation of rural settlements into urban (or urban into rural) by decision of the authorities: since 2001, the UTS Imeni Zhelyabova was transformed into a settlement, since 2004 the UTS Molochnoye was transformed into a village settlement, the UTS Tonshalovo and Ustye were transformed into village settlements, since 2012 the UTS Chebsara was transformed into a village settlement, since 2015 part of the urban population of the UTS Sheksna was transferred to the Ugolskoye rural settlement.
Source: Vologda Oblast Demographic Yearbook 2001–2022.
due to the double effect of migration and natural growth. In 2021 the total loss of urban population in the region reached the value of -6,826 people. At the same time 88% of it was provided by natural loss of population (-6,035 people).
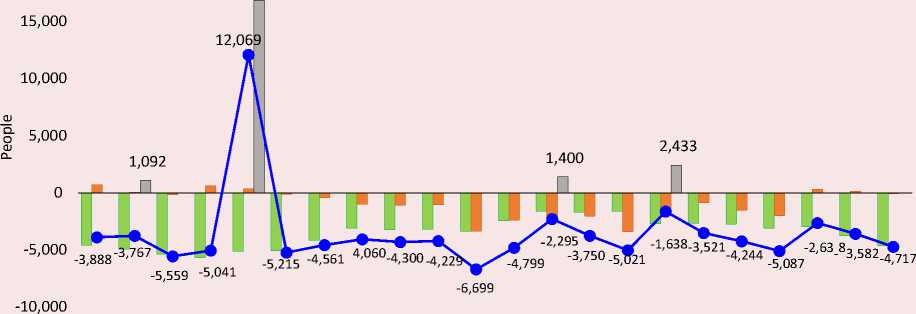
Throughout practically the entire period under consideration (excluding 2004), there was a general decline in the rural population in the Vologda Oblast ( Fig. 6 ). In some years, it was provided by the excess of natural loss over migration increase (2000, 2003, 2019–2020), but at other time by the double effect of both natural and migration loss. Only in 2004, the transfer of some urban settlements to rural ones (UTS Ustye, Tonsholovo and Molochnoe) covered the natural loss and provided the maximum total increase of rural residents in the region (12,069
people). In 2001, 2012 and 2015, administrative transformation could not compensate for the contribution of natural and/or migration losses to the decrease in the rural population. The total loss of rural residents reached its maximum value in 2010 (-6,699 people). In 2021 its size was -4,717 people and 98% of it was due to natural loss (-4,623 people).
The grouping of municipalities by the ratio of the components of change in the urban population showed that in 2021 65% of urban municipalities (15 of 23) had the most unfavorable situation, characterized by the total loss of residents due to the double effect of natural and migration losses (Tab. 3) . Among these municipalities were large cities – Vologda and Cherepovets. In six urban
Figure 6. Components of change in the rural population of the Vologda Oblast in 2000–2021, people
20,000 Rural population
16,837
2000 2001 2002 2003 2004 2005 2006 2007 2008 2009 2010 2011 2012 2013 2014 2015 2016 2017 2018 2019 2020 2021
I I Natural growth/loss
^^ ■ 1 Migration growth/loss
Growth/loss due to a change in the category of settlement*
—•—Total growth/loss
* Changes in the number of urban (rural) population, which occurred as a result of the transformation of rural settlements into urban (or urban into rural) by decision of the authorities: since 2001, the UTS Imeni Zhelyabova was transformed into a settlement, since 2004 the UTS Molochnoye was transformed into a village settlement, the UTS Tonshalovo and Ustye were transformed into village settlements, since 2012 the UTS Chebsara was transformed into a village settlement, since 2015 part of the urban population of the UTS Sheksna was transferred to the Ugolskoye rural settlement.
Source: Vologda Oblast Demographic Yearbook 2001–2022.
Table 3. Grouping of Vologda Oblast municipal entities by the impact of natural movement and migration indicators on the change in the number of urban population
|
Group |
2000 |
2010 |
2021 |
|||
|
Number |
Municipal entities (cities and UTS) |
Number |
Municipal entities (cities and UTS) |
Number |
Municipal entities (cities and UTS) |
|
|
NL, ML, TL |
10 (36%) |
Vologda, Velikii Ustyug, Sokol, Belozersk, Vytegra, Nikolsk, Ustyuzhna, Kadui, Molochnoe**, Khokhlovo |
13 (54%) |
Sokol, Babaevo, Belozersk, Vytegra, Ustyuzhna, Kharovsk, Vozhega, Vokhtoga, Kuzino, Sazonovo, Chagoda, Chebsara***, Sheksna |
15 (65%) |
Vologda, Velikii Ustyug, Cherepovets, Belozersk, Gryazovets, Kadnikov, Kirillov, Krasavino, Nikolsk , Totma, Ustyuzhna , Kharovsk, Vokhtoga, Kuzino, Sheksna |
|
NL, MG, TL |
15 (54%) |
Cherepovets, Babaevo, Gryazovets, Kadnikov, Kirillov, Krasavino, Totma, Kharovsk, Imeni Zhelyabova*, Kuzino, Sazonovo, Ustye**, Chagoda, Chebsara***, Sheksna |
3 (12%) |
Krasavino, Kadui, Khokhlovo |
6 (26%) |
Sokol, Babaevo , Vytegra, Vozhega, Sazonovo , Chagoda |
|
NG, ML, TL |
- |
- |
4 (17%) |
Gryazovets, Kadnikov, Kirillov, Nikolsk |
- |
- |
|
NL, MG, TG |
2 (7%) |
Vozhega, Vokhtoga |
4 (17%) |
Vologda, Velikii Ustyug, Cherepovets, Totma |
2 (9%) |
Kadui, Khokhlovo |
|
NG, ML, TG |
- |
- |
- |
- |
- |
- |
|
NG, MG, TG |
1 (3%) |
Tonshalovo** |
- |
- |
- |
- |
|
Total |
28 |
24 |
23 |
|||
|
Hereinafter: NL, ML, TL – natural, migration, total loss of population; NG, MG, TG – natural, migration, total growth of population. In green color are marked the municipal entities that have improved their position in 2021 in comparison to 2000, in red – those that have worsened their position, and in black – those that have not changed their position.
According to: Demographic Yearbook of the Vologda Oblast. 2000: Statistical Collection. Vologdastat, 2001; Demographic Yearbook of the Vologda Oblast. 2010: Statistical Collection. Vologdastat, 2011; Demographic Yearbook of the Vologda Oblast. 2021: Statistical Collection. Vologdastat, 2022. |
||||||
municipalities (Sokol, Babaevo, Vytegra, UTS Vozhega, Sazonovo, Chagoda) the migration growth did not compensate the natural population loss, as a result of which there was an overall population loss. Only in two municipalities – the urban-type settlements Kaduy and Khokhlovo of Kaduysky District – there was an increase in the population due to migration growth.
Compared to 2000, in 2021 there were negative trends in the grouping of urban municipalities by the ratio of population change components: the share of the most disadvantaged cities and UTS increased from 36% to 65%, and cities and UTS with a general decline, but migration growth – decreased from 54% to 26%. Over the observation period, 10 urban settlements worsened their position in terms of the ratio of population components, most significantly – the UTS Vozhega (Vozhegodsky District) and Vokhtoga (Gryazovetsky District), nine have not changed it and only four have improved their positions (most significantly – the UTS Kadui and Khokhlovo). The positive dynamics of the population size of the UTS Kadui and Khokhlovo can be explained by the functioning of developed industrial enterprises that create jobs. For example, Kaduysky District holds leading positions in the Vologda Oblast in the production of electricity (Cherepovets State District Power Plant) and the production of food sturgeon caviar (fish processing firm “Diana”), and is among the leaders in the production of plywood and furniture components (LLC “Kaduysky plywood mill”, OJSC “Sivets”, etc.)6.
In 2021 in 59% of municipal entities (16 of 27) rural population decreased due to both natural and migration losses, in 41% (11 of 27) due to the excess of natural loss over migration gain (Tab. 4) . The overall increase in the rural population was not
Table 4. Grouping of municipal entities of the Vologda Oblast by the impact of natural movement indicators and migration on the change in the number of rural population
|
Type |
2000 |
2010 |
2021 |
|||
|
Number |
Municipal entities. (districts, urban okrugs) |
Number |
Municipal entities. (districts, urban okrugs) |
Number |
Municipal entities. (districts, urban okrugs) |
|
|
NL, ML, TL |
8 (31%) |
Babushkinsky, Vologodsky, Gryazovetsky, Kaduysky, Kichmengsko-Gorodetsky, Nikolsky, Sokolsky, Tarnogsky |
24 (89%) |
Babayevsky, Babushkinsky, Belozersky, Vashkinsky, Velikoustyugsky, Verkhovazhsky, Vozhegodsky, Vytegorsky, Gryazovetsky, Kirillovsky, Kichmengsko-Gorodetsky, Mezhdurechensky, Nikolsky, Nuksensky, Sokolsky, Syamzhensky, Tarnogsky, Totemsky, Ust-Kubinsky, Ustyuzhensky, Kharovsky, Chagodoshchensky, Cherepovetsky, Sheksninsky |
16 (59%) |
Babayevsky, Babushkinsky , Belozersky, Vashkinsky, Verkhovazhsky, Vozhegodsky, Vytegorsky, Gryazovetsky , Mezhdurechensky, Nikolsky , Sokolsky, Sokolsky , Ustyuzhensky, Kharovsky, Chagodoshchensky, Sheksninsky |
|
NL, MG, TL |
16 (61%) |
Babayevsky, Belozersky, Vashkinsky, Verkhovazhsky, Vozhegodsky, Vytegorsky, Kirillovsky, Mezhdurechensky, Nyuksensky, Syamzhensky, Ust-Kubinsky, Ustyuzhensky, Kharovsky, Chagodoshchensky, Cherepovetsky, Sheksninsky |
2 (7%) |
Vologodsky, Kaduysky |
11 (41%) |
Velikoustyugsky, Vologodsky, Kaduysky, Kirillovsky , Kichmengsko-Gorodetsky, Syamzhensky , Tarnogsky, Totemsky, Ust-Kubinsky, Cherepovetsky , Molochnoe village (Urban Okrug of Vologda)* |
|
NG, ML, TL |
- |
- |
- |
- |
- |
- |
|
NL, MG, TG |
2 (8%) |
Velikoustyugsky, Totemsky |
1 (4%) |
Molochnoe village (Urban Okrug of Vologda)* |
- |
- |
|
NG, ML, TG |
- |
- |
- |
- |
- |
- |
|
NG, MG, TG |
- |
- |
- |
- |
- |
- |
|
Total |
26 |
27 |
27 |
|||
* Since 2004, the UTS Molochnoe was transformed into a village.
According to: Demographic Yearbook of the Vologda Oblast. 2000: Statistical Collection. Vologdastat, 2001; Demographic Yearbook of the Vologda Oblast. 2010: Statistical Collection. Vologdastat, 2011; Demographic Yearbook of the Vologda Oblast. 2021: Statistical Collection. Vologdastat, 2022.
recorded in any municipality. From 2000 to 2021 the share of municipal districts with the most unfavorable ratio of the components of change in the rural population almost doubled, which confirms the trend of deterioration of the demographic situation in rural areas of the region. Over the period under consideration, 14 municipalities worsened their positions in terms of the components ratio of changes in the number of rural population, most significantly – Velikoustyugsky and Totemsky districts, which moved from the category of municipalities with growth of rural residents due to migration inflows to the group of municipalities with loss of rural population under the double pressure of natural and migration losses. Four districts of the Vologda Oblast, on the contrary, improved the situation (Vologodsky, Kaduysky, Kichmengsko-Gorodetsky, Tarnogsky districts) due to the replacement of migration outflow with population growth, which, however, could not cover its natural loss. Positive trends in the Vologodsky and Kaduysky municipal districts may be related to the high socio-economic development potential of their rural areas due to their proximity to large cities (Voroshilov, 2021). In eight municipal entities of the region the ratio of the contribution of natural movement and migration to the dynamics of the population remained at the same level (consistently unfavorable situation).
Table 5 presents the Vologda Oblast municipalities by main demographic indicators in the context of urban and rural population. The most unfavorable situation is observed in Belozersky and Kharovsky districts, where both urban and rural population decrease under the dual influence of natural and migration losses, and also there are markers of population aging: a high share of population aged 65 and older, a low share of population aged 15–64 and children under 14 (in rural areas). In 10 municipalities
(Babushkinsky, Vashkinsky, Verkhovazhsky, Gryazovetsky, Mezhdurechensky, Nikolsky, Nyuksensky, Ustyuzhensky, Sheksninsky districts and Cherepovets) the number of urban and/or rural residents is also decreasing due to natural and migration losses.
Some municipalities (16 of 28) have the potential to improve the demographic situation associated with the migration population growth. Six districts have a migration inflow of urban population (Chagodoshchensky, Babaevsky, Vozhegodsky, Sokolsky, Vytegorsky, Kaduysky), but only in one of them – in Kaduysky District – it compensates the natural loss and leads to an increase in the number of urban residents. In 11 municipalities there is a migratory increase in the rural population, but in none of them it compensates the natural loss.
It is noteworthy that in some municipalities the migration loss of urban population is accompanied by an increase in the rural population (Kirillovsky, Velikoustyugsky and Totemsky districts, Urban Okrug of Vologda, Vologodsky and Cherepovetsky districts – at the expense of the cities of Vologda and Cherepovets), which indirectly may indicate the deurbanization processes within them. In other municipalities (Babayevsky, Vytegorsky, Sokolsky, Chagodoshchensky and Vozhegodsky), on the contrary, against the background of the migration outflow of rural residents there is a migration growth of the urban population, which indicates the trend of urbanization.
The most favorable parameters of the age composition of urban residents due to the high proportion of children have Babayevsky, Vyte-gorsky, Nikolsky districts, due to the high share of the population aged 15–64 – Sheksninsky and Ustyuzhensky districts. The most favorable age characteristics of the rural population are in Nikolsky District (a high share of children and
Table 5. Vologda Oblast municipal entities by main demographic indicators in terms of urban and rural population, 2021
The markers of population aging (high share of the elderly and low share of children) are in urban and rural areas of Kaduysky, Chagodoshchensky, Belozersky and Kharovsky districts, in rural areas of Kirillovsky and Ustyuzhinsky districts. In a number of municipalities there is a low share of the population aged 15–64: in the urban areas of Babayevsky, Vytegorsky, Belozersky and Kharovsky districts, in the rural areas of Kaduysky, Chagodoshchensky, Kirillovsky, Ustyuzhensky, Vashkinsky, Belozersky and Kharovsky districts.
Discussion of the results, and conclusions
Thus, the conducted study on the example of the Vologda Oblast revealed the following trends in the transformation of resettlement systems: increasing polarization of urban and rural settlements, expressed in the concentration of residents either in large or small settlements; depopulation of rural areas; weakening of the supporting framework of urban resettlement (small towns system); strengthening of “focality” of rural settlement. Regional trends in changes of resettlement systems and their demographic consequences in many aspects repeat the all-Russian, especially occurring in the Non-Chernozem region. A special role in the observed transformations of the resettlement is played by large cities – Vologda and Cherepovets, attracting the population in the zone of their influence, which leads to a decrease in the population of remote rural settlements of municipal districts and the decrease in the urban population of district centers. The role of the Oblast’s eastern districts in the concentration of rural residents in “bush” settlements is gradually decreasing.
In more than half of the municipalities in the Vologda Oblast the reduction of urban and rural population is due to the double effect of natural and migration losses. At the same time, the number and the share of such municipalities have increased significantly over the past 20 years. The most unfavorable situation is observed in Belozersky and Kharovsky districts, where the decrease in population under the “double pressure” of natural and migration losses is accompanied by unfavorable parameters of the age composition (population aging). In these municipalities throughout 2000– 2021 there was a significant decrease in the population of rural settlements and the number of residents in the district centers (Belozersk and Kharovsk). Similar trends in the transformation of resettlement have affected the current demographic situation in the other 10 municipalities with “double” population loss.
Some municipalities of the Vologda Oblast have the potential of migration growth, however, compensation of natural decrease by migration growth currently occurs only in the urban areas of Kaduysky District. Obviously, a major role in this process is played by the urban-type settlements Kaduy and Khokhlovo, actively attracting population, due to which, however, the rural settlements of the municipal district are becoming less crowded.
A number of municipalities have favorable parameters of the age composition of the population (high share of children and/or population aged 15–64, low share of the elderly population), which can have positive consequences for the labor market in the form of an expanded supply of labor, for example, in rural and urban areas of Nikolsky District, in urban areas of Sheksninsky District, in rural areas of the Urban Okrug of Vologda, Vologodsky, Babushkinsky and Vytegorsky districts. In some of these municipalities, however, migration outflows undermine the advantages of the age structure, as they “wash out” the young and working-age population from these territories.
Spatial transformations of urban and rural resettlement inevitably lead to changes in the demographic situation in the region and its municipalities – migration losses from donor territories and migration inflows to acceptor territories, transformation of the age composition of the population, changes in reproduction characteristics. Emerging socio-demographic disparities entail a decrease in the labor potential of small cities and small rural settlements and the concentration of labor resources in large settlements. As a result, intraregional socioeconomic inequality is growing, the situation of the periphery population becomes vulnerable both in terms of access to social facilities and digital technologies, and the realization of opportunities in the labor market.
The study identified different types of territories in the region: the most vulnerable territories exposed to depopulation, territories in a state of depopulation, but with the potential to improve the situation (migration or age structure), and territories with the most favorable situation. The first group is characterized by the most unfavorable situation, since the decrease in the population of rural settlements is accompanied by the “shrinkage” of district centers, which entails an imminent reduction not only in demographic, but also in economic, labor and other potentials. Such municipal entities require the adoption of serious managerial measures at the regional level (for example, the creation of “zones of disadvantage”). In the case of the second group of municipalities, attention should be paid to using their strengths to improve and stabilize the situation as a whole. In particular, it is necessary to maintain the trend of migration growth (where it exists), stimulating the increase in its scale, the competent use of the potential of the age structure, creating favorable living conditions for the population and their fixation on the territory of the municipality (especially young and working-age citizens). In the case of the third group (Kaduysky District), it is advisable to ensure the preservation of positive trends (migration growth), paying particular attention to the development of rural areas of the municipality.
The results of the study contribute to the development of ideas about intraregional trends in the transformation of resettlement and related demographic trends; they can serve as a basis for the development and implementation of activities in the framework of municipal management programs, including the ongoing municipal reform of territorial organization.
References Transformation of the resettlement system and its demographic manifestations: research experience at the regional and municipal levels
- Alekseev A.I., Safronov S.G. (2015). Changes in rural settlement patterns in Russia during the late 20th – early 21st centuries. Vestnik Moskovskogo universiteta. Ser.5. Geografiya=Moscow University Bulletin. Series 5, Geography, 2, 66–76 (in Russian).
- Averkieva K.V. (2017). Symbiosis of agriculture and forestry on the early-developed periphery of the Non-Black Earth Region: The case of the Tarnogsky district of the Vologda Region. Krest’yanovedenie=Russian Peasant Studies, 2(4), 86–106 (in Russian).
- Baron M. et al. (2010). Villes et regions europeennes en decroissance, maintenir la cohesion territorial. Paris: Lavoisier.
- Borsdorf A., Salet W. (2007). Spatial reconfiguration and problems of governance in urban regions of Europe: An introduction to the Belgeo issue on advanced service sectors in European urban regions. Belgeo, 1, 3–14. DOI: 10.4000/belgeo.11604
- Christaller W. (1933). Die zentralen Orte in Süddeutschland. Jena: Gustav Fischer.
- Efremova V.A. (2015). Russian and international research on shrinking cities: Themes, methods and centers. Regional’nye issledovaniya, 3, 86–98 (in Russian).
- Egorov D.O. (2020). Spatial shrinking and polarization of rural space in the Republic of Tatarstan in the context of population depopulation. Regional’nye issledovaniya, 4, 32–45. DOI: 10.5922/1994-5280-2020-4-3 (in Russian).
- Fattakhov R.V., Nizamutdinov M.M., Oreshnikov V.V. (2019). Analyzing and modelling of trends in the development of the territorial settlement system in Russia. Ekonomika regiona=Economy of Region, 15(2), 436–450. DOI: 10.17059/2019-2-10 (in Russian).
- Fielding A. (1989). Migration and counter urbanization in Western Europe since 1950. Geographical Journal, 155, 60–69. DOI: 10.2307/635381
- Friedmann J. (1966). Regional development policy: A case study of Venezuela. Boston: The MIT Press.
- Geyer Y.S., Kontuly T. (1993). The theoretical foundation of the concept of differential urbanization. International Regional Science Review, 15(3), 157–177. DOI: 10.1177/016001769301500202
- Glezer O.B., Kolosov V.A., Brade I. et al. (2014). Integrated forms of urban settlement pattern in Russia, Europe, and worldwide. Regional Research of Russia, 4, 80–89. DOI: https://doi.org/10.1134/S207997051402004X
- Glezer O.B., Vainberg E.I (2013). The population’s living space and settlement patterns as the factors and conditions of modernization in Russia. Region: Ekonomika i Sotsiologiya=Region: Economics and Sociology, 3, 21–38 (in Russian).
- Haase A. et al. (2014). Conceptualizing urban shrinkage. Environment and Planning A, 46, 1519–1534. DOI:10.1068/a46269
- Kapelyushnikov R.I. (2019). The phenomenon of population aging: Major economic effects. Ekonomicheskaya politika=Economic Policy, 14(3), 8–53. DOI: 10.18288/1994-5124-2019-3-8-53 (in Russian).
- Karachurina L.B., Mkrtchyan N.V. (2013). Change of population numbers in administrative units and cities of Russia (1989–2010): Centre-periphery relationships. In: Voprosy geografii. Sb. 135: Geografiya naseleniya i sotsial’naya geografiya [Problems of Geography. Vol. 135: Geography of Population and Social Geography]. Moscow: Kodeks Publishing House.
- Karachurina L.B., Mkrtchyan N.V. (2016). Role of migration in enhancing contrasts of settlement pattern at municipal level in Russia. Izvestiya RAN. Seriya Geograficheskaya=Proceedings of the RAS. Geographic Series, 5, 46–59 (in Russian).
- Korolenko A.V. (2023). Spatial transformations of Russia’s territories: Trends and regional differences in resettlement. Problemy razvitiya territorii=Problems of Territory’s Development, 27(1), 47–75. DOI: 10.15838/ptd.2023.1.123.4 (in Russian).
- Kozhevnikov S.A. (2018). Agglomeration processes in the European North of Russia: Eexperience of the Vologda region. Regionologiya=Regionology, 26(4), 718–741. DOI: 10.15507/2413-1407.105.026.201804.718-741 (in Russian).
- Krugman P. (1998). Space: The final frontier. Journal of Economic Perspectives, 12(2), 161–174.
- Lösch A. (1954). The Economics of Location. New Haven: Yale University Press.
- Morgunov E.V., Shutov O.L., Fatullaev S.T. (2021). Theoretical and methodological approaches to the definition of urban agglomeration as a spatially localized subsystem of Russian regions. Vestnik MIRBIS=Vestnik MIRBIS, 3(27), 28–36. DOI: 10.25634/MIRBIS.2021.3.3 (in Russian).
- Nam C.W., Richardson H.W. (Eds.). (2014). Shrinking cities: A global perspective (Regions and Cities Series). New York, Routledge.
- Nefedova T.G., Glezer O.B. (2020). Transformation of Russia’s social-geographical space. In: Vyzovy i politika prostranstvennogo razvitiya Rossii v XXI veke [Challenges and Policy of Russia’s Spatial Development in the 21st Century]. Moscow: KMK Publishing House.
- Nefedova T.G., Pokrovskii N.E., Treivish A.I. (2015). Urbanization, desurbanization and rural-urban communities in the face of growing horizontal mobility. Sotsiologicheskie issledovaniya=Sociological Studies, 12, 60–69 (in Russian).
- Nefedova T.G., Polyan P.M., Treivish A.I. (Eds.). (2001). Gorod i derevnya v Evropeiskoi Rossii: sto let peremen. Pamyati Veniamina Petrovicha Semenova-Tyan-Shanskogo [The Town and the Country in European Russia: One Hundred Years of Changes. In Memory of Veniamin Petrovich Semenov-Tyan-Shansky]. Moscow: O.G.I.
- Pallagst K., Martinez-Fernandez C., Wiechmann (Hrsg) Th. (2013). Shrinking Cities-International Perspectives and Policy Implications, Routledge Publishers.
- Partridge M. et al. (2006). Does the new economic geography explain U.S. core-periphery population dynamics? Paper prepared for the 45th Annual Meetings of the Southern Regional Science Association, March 30–April 1, St. Augustine, Florida.
- Polese M., Shearmur R. (2006). Why some regions will decline: A Canadian case study with thoughts on local development strategies. Papers in Regional Science, 85, 23–46. DOI: 10.1111/j.1435-5957.2006.00024.x
- Richardson H.W. (1993). Regional Growth Theory. London: Macmillan.
- Shabunova A.A., Kalachikova O.N., Korolenko A.V. (2021). Demograficheskaya situatsiya i sotsial'no-demograficheskaya politika Vologodskoi oblasti v usloviyakh pandemii COVID-19: II regional’nyi demograficheskii doklad [Demographic Situation and Socio-Demographic Policy in the Vologda Oblast in the Context of the COVID-19 Pandemic: 2nd Regional Demographic Report]. Vologda: VolRC RAS.
- Sobolev A.V. (2015). Structural and functional characteristics of the spatial development of rural and urban areas in the Northwestern economic district. Baltiiskii region=The Baltic Region, 1(23), 143–158. DOI: 10.5922/2074-9848-2015-1-9 (in Russian).
- Soldatova N.V. (2016). Transformation of the rural settlement system in the Vologda Oblast. In: Voprosy geografii. Sb. 141: Problemy regional’nogo razvitiya Rossii [Problems of Geography. Vol. 141: Problems of Regional Development of Russia]. Moscow: Kodeks Publishing House.
- Swiaczny F., Graze P., Schlömer C. (2009). Spatial impacts of demographic change in Germany. Zeitschrift für Bevölkerungswissenschaft, 33, 181–205. DOI: 10.1007/s12523-009-0010-9
- Tkachenko A.A. (2018). Key concepts of the settlement theory: An attempt of rethinking. Vestnik Moskovskogo universiteta. Ser.5. Geografiya=Moscow University Bulletin. Series 5, Geography, 2, 10–15 (in Russian).
- Uskova T.V., Patrakova S.S. (2021). Rural development in the context of spatial compression of a northern region. Ekonomicheskie i sotsial’nye peremeny: fakty, tendentsii, prognoz=Economic and Social Changes: Facts, Trends, Forecast, 14(5), 34–52. DOI: 10.15838/esc.2021.5.77.2 (in Russian).
- Voroshilov N.V. (2021). Assessing the socio-economic potential of rural territories. Ekonomicheskie i sotsial’nye peremeny: fakty, tendentsii, prognoz=Economic and Social Changes: Facts, Trends, Forecast, 14(1), 91–109. DOI: 10.15838/esc.2021.1.73.7 (in Russian).
- Zaionchkovskaya Zh.A (1991). Demograficheskaya situatsiya i rasselenie [Demographic Situation and Resettlement]. Moscow: Nauka.
- Zubarevich N.V. (2010). Regiony Rossii. Neravenstvo, krizis, modernizatsiya [Regions of Russia. Inequality, Crisis, Modernization]. Moscow: Independent Institute for Social Policy.
- Zubarevich N.V. (2013). Transformation of rural settlement pattern and service network in rural areas. Izvestiya RAN. Seriya Geograficheskaya=Proceedings of the RAS. Geographic Series, 3, 26–38 (in Russian).
