Tropical Rain Intensity Impact on Raindrop Diameter and Specific Signal Attenuation at Microwaves Communication Link

Author: Isabona Joseph, Ibrahim Habibat Ojochogwu, Ituabhor Odesanya
Journal: International Journal of Image, Graphics and Signal Processing @ijigsp
Article in issue: 2 vol.15, 2023.
Free access
Realistic knowledge of rainfall characteristics and modeling parameters such as size, shape, and drop size distribution is essential in numerous areas of scientific, engineering, industrial and technological applications. Some key application areas include, but not limited to microphysics analysis of precipitation composition phenomenon, weather prediction, signal attenuations forecasting, signal processing, remote sensing, radar meteorology, stormwater management and cloud photo detection. In this contribution, the influence of rain intensity on raindrop diameter and specific attenuation in Lokoja, a typical climate region of Nigeria is investigated and reported. Three different rain rates classes obtained due to heavy rainfall depth, heavy rainfall depth, and heavy rainfall depth have been explored for the raindrop size distribution analysis. The three-parameter lognormal and Weibull models were utilised to estimate the influence of rain rates on the drop sizes and specific rainfall attenuation in the study location. For Lognormal model, the maximum raindrop concentration occurred approximately at diameter of 1 mm before showing downfall performance trends as the drop diameter increases. In the case of Weilbull model, the maximum raindrop concentration occurred at different drop diameter with the three rain rate classes, before showing downfall concentration trends with increasing rain drop diameter values. By means of the two models, the highest raindrops concentration values attained in correspondence with the specific rain attenuation were made by drop diameters not more than 2.5 mm. In terms of rain rate, specific attenuation and frequency connection, the results disclose that attenuation of propagated electromagnetic waves increases at increasing rainfall depth and increasing operating frequency bands. The results also disclose that the specific attenuation is directly proportional to the increase in rain intensity levels in correspondent with the operational frequency. As a case in point, at 4GHz frequency, the attenuation level of about 20 dB/km level is attained for mean, minimum and maximum rain rates of 29.12, 12.23 and 50.22 mm/hr, respectively. But as the frequency increased from 4GHz to 20GHz, the attenuation level almost doubles from 20 to 45dB/km at still same rain rates. The above performance is so, because at higher radio-microwave frequencies, the wavelength of the propagated electromagnetic waves approaches the mean diameter of the raindrop. The results display gradual increase in attenuation levels as the diameter rain drop sizes and intensity increases or become broader. The attenuation grows because the raindrops interfere, distort, absorb and scatter major portion of the microwave energy. However, the gradual trend in the attenuation level increase becomes slower and tending to logarithm stability at larger rain drop values. This may suggest that the attenuation level may come to equilibrium state at higher rain drop diameters. The resultant outcome of this work can assist microwaves communication engineers and relevant stakeholders in the telecommunication sector with expedient information needed to manage specific attenuation problems over Earth–space links communication channels, particualry during rainy seasons.
Lognormal model, Weilbull model, Rain rate, Rain attenuation, Raindrop concentration, Raindrop diameter, Specific attenuation
Short address: https://sciup.org/15018754
IDR: 15018754 | DOI: 10.5815/ijigsp.2023.02.06
Text of the scientific article Tropical Rain Intensity Impact on Raindrop Diameter and Specific Signal Attenuation at Microwaves Communication Link
Rainfall events remained one vital natural phenomenon affecting the coverage strength and energy propagation of signals at different frequency bands. The energy of propagated microwaves signals can be attenuated over spatial communication channels as a result of their distortion, scattering and absorption that cause attenuation of electromagnetic waves and this in turn degrade the coverage quality of the transmitted signals at receiver end and the entire service reliability of communication links [1, 2]. Particularly, at certain transmission frequencies signal attenuation due water vapour absorption, dispersive molecular absorption and scattering has been reported to have significant effects on cellular communication systems [3, 4]. The absorption leads to equivalent loss and reduction transmitted signal energy and momentum. Moreover, refractive effects due to rainfall events can cause phase and amplitude scintillations (fast fading) at round the user equipment terminal.
Lokoja is situated in the tropics and raining seasons in this region is convectional in nature. The heating of the land and terrain during the day set convectional currents into motion. The rising of atmospheric events due to warm air often results to cumulonimbus clouds (i.e., hot tower cloud) formation, thunderstorm cloud formation and torrential rainfall [4]. Therefore, a good knowledge of rain drops size distribution (DSD), rain depth and their intensity levels are very critical in the evaluation and prognostic assessment various attenuations due to rain over the wireless communication channels and systems during planning and optimization. Information about raindrop size distribution (DSD) due to rain is very vital for predictive estimation and analysis microwave signal coverage [5-10]. The DSD modeling is particular important for microwave planning application in the tropical region over the counter part region because tropical region is characterized with heavy rain rate and very heavy experiences [11-15].
Our main objects in this paper are to expore relevant rain rate models to analyse and provide clear information on raindrop size concentration level that can be attained in Lokoja; determined connection between the raindrop sizes and specific attenuation levels four different rainfall distribution models and also quantified the influence of the raindrop diameter and rain rate on specific attenuation
-
A. Literature Review and Research Motivation
Various studies on rainfall characteristic parameters modeling and analysis such as rain attenuation, rain drop diameter, raindrop size distribution, velocity and depth of fall utilising simulated and measured data have been reported in literature, but particularly at higher frequencies [15-22], Semi-Temperate [31], and Mediterranean [32-34]. However, a detailed clear-cut study on raindrop size rainfall distribution analysis and their influence on specific signal attenuation are mixing in typical Tropical climate region where this study is conducted. In our previous works, the effect of rain rate, cloud, snow and atmospheric gases were modeled and quantified to estimate their resultant impact on RF communications in Dry Savanna and Tropical Wet Climate [36, 37].
In this paper, rain intensity impact on raindrop diameter and specific attenuation at microwaves communication links is investigated using Tropical climate region as a case study.
To this end, the research paper is motivated by the following prime contributions:
■ We conducted a detailed statistical analysis and classification of 12 years of empirical rain rate data in the tropical climare region.
■ We provide a detailed survey on most commonly propabaility distribution models used for raindrop size distibution (DSD) analysis in literature
■ We expore the models to conduct and provide raindrop size concentration that can be attained using the propabaility distribution models in the study location
■ We determined connection between the raindrop sizes and specific attenuation levels four different rainfall distribution models
■ We quantified the influence of the raindrop diameter and rain rate on specific attenuation
2. Background
The remaining lot of the paper is structured-out as follows. Section 2 highlights the paper preliminaries. In section 3, materials, case study area and data collection method are given. Section 4 delivers the results accompanied with clear discussions. Lastly, summarized conclusion of the paper is provided in section 5.
-
A. Rain
Basically, there exist two main types of rain in the tropics, namely the stratiform rain and the convective rain. Stratiform rain is by definition conditionally stable and stratified. This type of rain occurs when a pool or large amount air masses grow transversely in correspondence with larger-scale force of atmospheric dynamics.
Convection rain is by definition unconditionally stable and short. This rain type occurs when the Earth's surface, particularly in the interior of the moist atmosphere, get heated above its surroundings temperature, which in turn result to significant evaporation. Convective rainfall falls from active cumulus and cumulonimbus clouds while Stratiform rainfall falls from nimbostratus clouds.
-
B. Rain Drop Size and Distribution Models
In a cloud, there exist numerous banks of droplets of different sizes, which accumulate up in the air, but not yet large enough to fall as rain. By way of a process, known as ‘collision and coalescence’, larger and smaller cloud droplets collide and fall as rain.
In the radio microwave frequency range of the electromagnetic spectrum, the drop size, velocity, depth and shape of rainfall all play key part in the attenuation and degradation of propagated signals energies via scattering, absorption and diffraction. The rain drops size distribution, N (Di), expresses the raindrops’ number falling per cubic meter (mm-3m-1), with drop diameters, Di. There exist many models in literature that connects rain drop size and rain rate (i.e rate of falling rain). One of the first ever empirically based models was proposed in [35] to model median diameter to rain rate and it is given by:
Dt =- 1.238 Rt 0128 (1)
where Rt defines the rain rate in mm/hr.
Later on, the authors in [38] came up with an exponential based distribution model provided a superior performance on raindrop-size distribution analysis and rainfall rate computations. The empirically based exponential distribution model is given by:
N ( D , ) = N o e i (2)
where the sloe parameter, л = 4.11.238 R - 0-21 and No indicating the scaling parameter. The expression in (2) is the popular so-called exponential model.
Furthermore, researchers conducted by the authors in [38-40], introduced three-parameters based Gamma and Lognormal models for raindrop size analysis. The three Gamma model is expressed in the form:
N(D,) = NDue ^ ‘(3)
where Л = 7.09 R — °'27, N = 64500 R - 0'5 and with u being the shape parameter.
The three-parameter lognormal model is given by:
N (D) = NL11 f- 1f '"'D1 '■J' 1
2ПСТ ct Di ^ \ CT J J where
Л = 7.09 R 2(5)
No = aRb(6)
M = Ац + Вц ln Rt ct2 = A, + B, ln Rt
Apart from the gamma, exponential, and lognormal distributions models, which are most common for raindrop distribution modeling and analysis in the literature, there exist other distribution model like the Weibull model and it is the form [41];
'i 1
N(D,) = No -1 - J eI ст \ ct J I
n I D, 1 I ct J
where
Л = 7.09 R "°'27 (10)
N = 64500 R - 0.5 (11)
In this paper, the three-parameter lognormal and Weibull models are engaged to estimate the influence of rain rates on the drop sizes and specific rainfall attenuation in the study location.
3. Methods
A robust stepwise approach is adopted here to conduct a detailed clear-cut study on raindrop size distribution analysis. To this end, we engaged the three-parameter lognormal and Weibull models described in equations (4) and (9) to achieve the driving goal. Information on the study location and the method of rainfall data collection explored are provided as follows:
-
A. Study Area
Lokoja, the research study location, is the commercial and administrative capital of Kogi State. Lokoja is a medium-sized semi-urban city and it is situated between Longitude 60 41’E - 60 46’E and Latitude in north central, Nigeria as displayed in Fig. 1. The climate is naturally tropically moist, characterized by oppressive and overcast wet season. The dry season is partly cloudy, hot and muggy all year round, with temperature range between 37 oC to 41oC, and with January and March most times being the hottest period. The climatic condition of Lokoja is highly influenced by two main big rivers, which are River Niger and River Benue. The mean rainfall of Lokoja is approximately 1214mm in terms of depth level during rainy season. Rainfall season usually commences in the first quarter of the year between months of March and April [42].
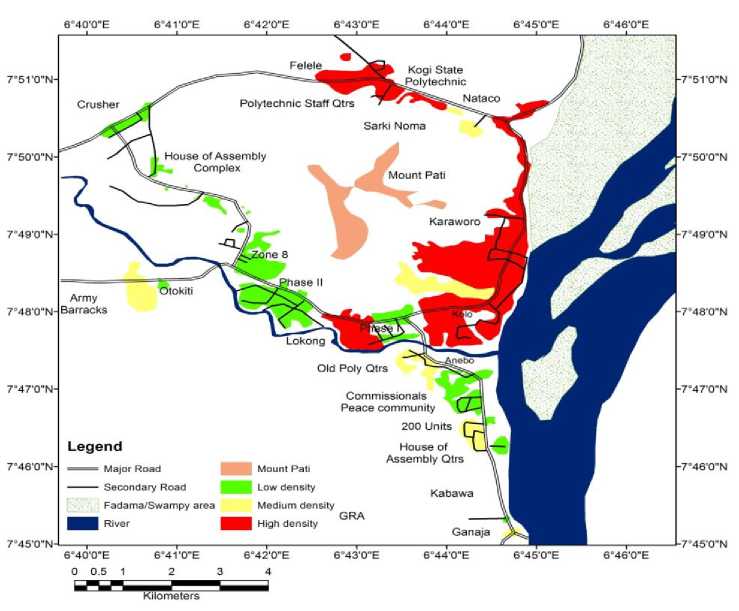
Fig. 1. Map Display of study location and their geographical coordinates
-
B. Data Collection Method
The empirical 12-year rainfall data engaged to conduct the influence of rain intensity (i.e., rain rate) on raindrop diameter and specific attenuation at microwave frequency band in this study has obtained from the Nigerian Meteorological Agency (NIMET). This is the first and only main agency equipped and empowered by Nigeria government to monitor and acquire daily/yearly data concerning weather and climatic conditions. The said task is given to the agency for policy planning, formulation, planning, management, and research purpose in the sector [4].
The agency has many work stations equipped with manual and electronic measuring tools such as weather radar and tipping-bucket rain gauge, all which stationed in different region of the Nigeria, wherein rainfall data, including precipitation are taken and recorded daily. The tipping-bucket is an automatic mechanical device designed to measures rainfall depth in increments of approximately 0.25mm. The tipping-bucket has a detached point and a tip with pail and funnel for the rainfall data collection. As soon as an equivalent amount of 0.25mm rainfall depth has been obtained and recorded with the bucket, it is tipped off (emptied). Displayed in Fig. 2 is Mean Annual Depth of Rainfall depths obtained from study location.
Mean Annual Rainfall Depth (mm)
2020 ^^^^^^^^^^^^^^^^^n
2018 ^^^^^^^^^^^^^^^^
2016 ^^^^^^^^^^^^^^^^^H
2014 ^^^^^^^^M
2012 ^^^^^^^^^^^^^^^^ш
2010 ^^^^^^^^^^^^^^^^M
2008 ^■^^^■^^^■^^^M ________
1000.00 1050.00 1100.00 1150.00 1200.00 1250.00 1300.00
Fig. 2. Mean Annual Depth of Rainfall depths from study location
4. Results and Discussion
The required scripts coding, computations, results and their graphical displays are provided in detail in this section with the aid of MATLAB software.
Generally, rain is classified according to the depth and rate at which it falls. The duration of fall can long, very long or short. Here, the obtained depth of rainfall data collected from the study location were first converted to rain rates (i.e., rain intensity) by dividing the rainfall depth by the duration of fall. Then, similar to the authors in [4], the rain rate has been classified into three parts, namely heavy, very heavy and extreme heavy rate. While the very heavy rain rates are the ranged of 1-30 mm/hr, the very heavy rain rates were ranged from 60-120 mm/hr. The extreme heavy category falls under 121 mm/hr and above. The chart in Figure 2 displays the mean, minimum and maximum of the classified rain rates.
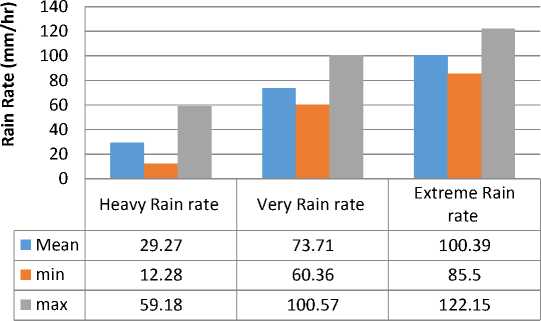
Fig. 3. Classified Rain Rates values due to different Rain Depth and Duration
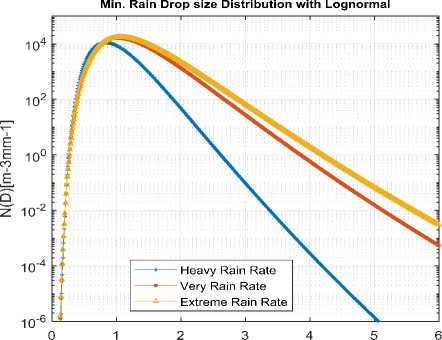
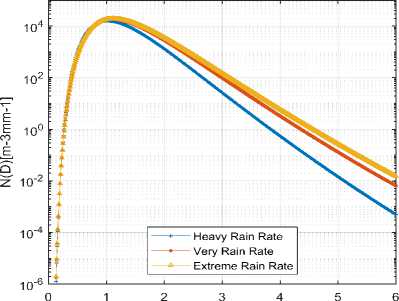
Figs. 4 to 9 show the rain drop distribution levels attained versus drop diameter for minimum, maximum and mean rain rates using the Lognormal and Weibull models expressions in equations (4) and (9), respectively. For Lognormal models, the maximum concentration occurred approximately at diameter of 1 mm before showing downfall concentration trends as the drop diameter increases. In the case of Weilbull model, the maximum concentration occurred at different drop diameter with the three rain rate types, before showing downfall concentration trends of rain drop diameter increases.
Diameter (mm)
Fig. 4. Rain drop count versus drop diameter and relationship minimum Rain Rates with Lognormal model
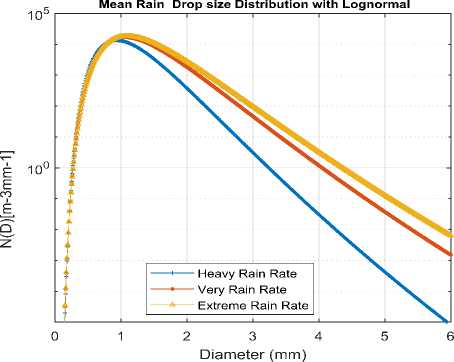
Fig. 5. Rain drop count versus drop diameter and relationship mean Rain Rates with Lognormal model
Max. Rain Drop size Distribution with Lognormal
Diameter (mm)
Fig. 6. Rain drop count versus drop diameter and relationship maximum Rain Rates with Lognormal model
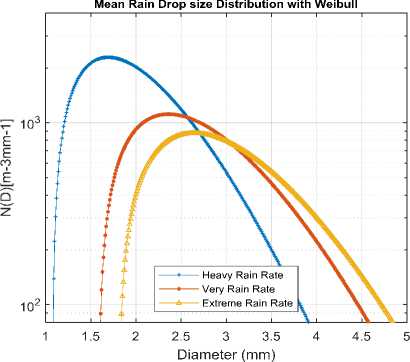
Fig. 7. Rain drop count versus drop diameter and relationship minimum Rain Rates with Weibull model
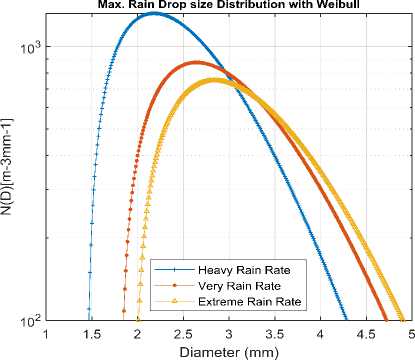
Fig. 8. Rain drop count versus drop diameter and relationship mean Rain Rates with Weibull model
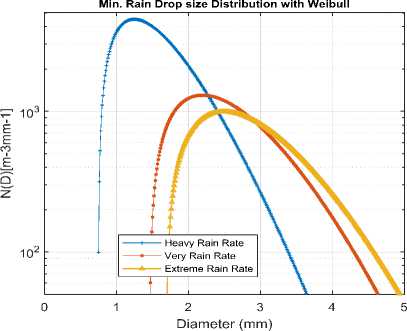
Fig. 9. Rain drop count versus drop diameter and relationship maximum Rain Rates with Weibull model
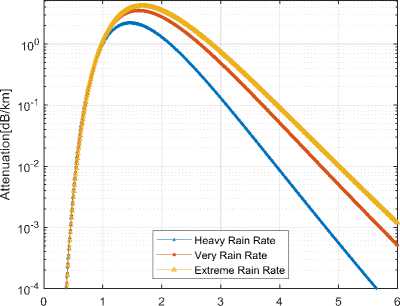
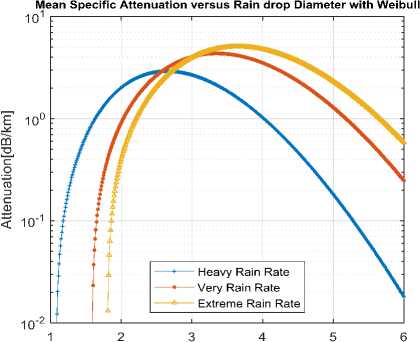
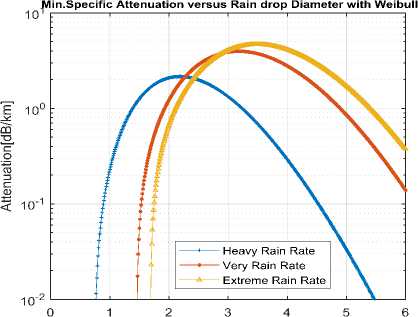
Figs. 10 to 15 show the graphical attenuation levels attained as function of drop diameter for the three rain rates types using lognormal and Weibull models. By observation in all figures, the entire graphs first depict growing attenuation level trends as the drop diameter increases, then get to maximum attenuation point with drop diameter before showing downfall attenuations trends as even the drop diameter increases. For Lognormal model, the maximum drop diameter with the signal attenuation occurred stand at 1.0, 1.5, 1.6 mm. In the case of Weilbull model, the maximum drop diameter with which highest signal attenuation occurred 2.0, 2.3 and 2.9mm, respectively, before showing downfall concentration trends of rain drop diameter increases. These results may suggest that the one-to-one connection between both signal attenuation and rain drop size does not grow continuously and preposterously. These simply imply that signal attenuation only grows linearly on at lower drop diameter and nonlinear at higher drop diameter, which occurs at after stable equilibrium has been reached as seen in in the figures.
Mean Specific Attenuation versus Rain drop Diameter with Lognormal
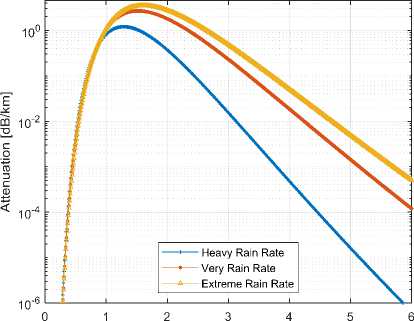
Diameter (mm)
Fig. 10. Specific attenuation versus drop diameter and relationship minimum Rain Rates with Lognormal model.
Min. Specific Attenuation versus Rain drop Diameter with Lognormal
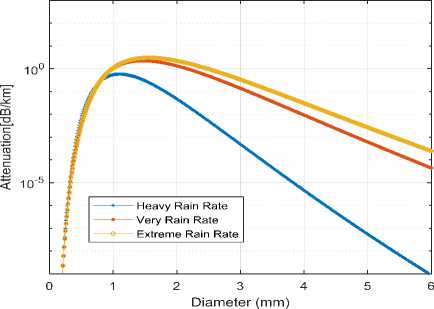
Fig. 11. Specific attenuation versus drop diameter and relationship mean Rain Rates with Lognormal
Max. Specific Attenuation versus Rain drop Diameter with Lognormal
Diameter (mm)
Fig. 12. Specific attenuation versus drop diameter and relationship maximum Rain Rates with Lognormal model
Diameter (mm)
Fig. 13. Specific attenuation versus drop diameter and relationship minimum Rain Rates with Weibull model
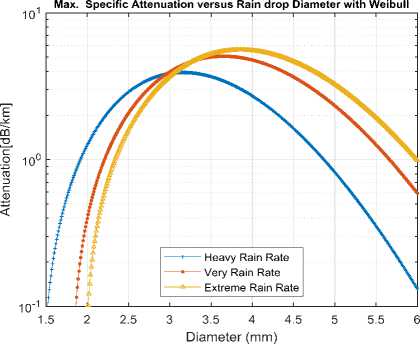
Fig. 14. Specific attenuation versus drop diameter and relationship mean Rain Rates with Weibull model
Diameter (mm)
Fig. 15. Specific attenuation versus drop diameter and relationship maximum Rain Rates with Weibull model
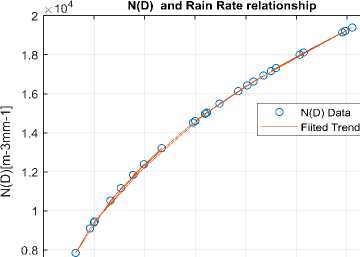
Figs. 19 to 22 show the graphical representation of attenuation levels impact with drop diameter for the three classified rain rates types by also using models lognormal and Weibull rain distribution models. A gradual increase in attenuation levels is seen for graphs as the diameter rainfall sizes increases or become higher and wider. Clear observations from the graphs indicate that attenuation of microwave signals grows more as the raindrop sizes increases. The attenuation grows because the raindrops interfere, distort, absorb and scatter major portion of the microwave energy and this in turn can degrade the coverage quality of the transmitted signals at receiver end and the entire service reliability of communication links. However, the gradual trend in the attenuation level increase becomes slower and tending to logarithm stability at larger rain drop values. This may suggest that the attenuation level may come to equilibrium state at higher rain drop diameters.
60 80 100 120 140
Rain Rate (mm/h)
Fig. 16. Rain drop count and Rain Rates relationship with lognormal model
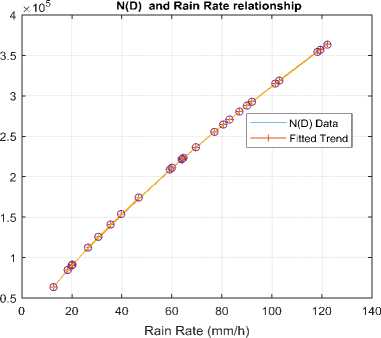
Fig. 17. Rain drop count and Rain Rates relationship with Weibull model
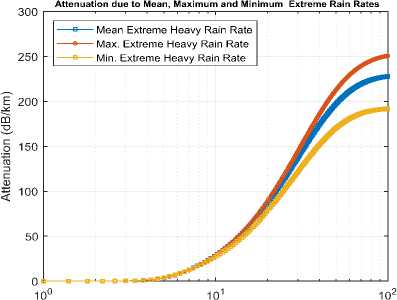
The graphs in figures 22 to 24 display electromagnetic wave attenuation at different frequencies. The graphs simply disclose that attenuation of propagated electromagnetic waves increases at increasing rainfall depth and increasing operating frequency bands. It also shows attenuation to rain is directly proportional to the increase in rain intensity levels and increase of the operational frequency. As a case in point in figure 22, at 4GHz frequency, the attenuation level is at 20 dB/km level for mean, minimum and maximum rain rates of 29.12, 12.23 and 50.22 mm/hr, respectively. But as the frequency increased from 4GHz to 20GHz, the attenuation level almost doubles from 20 to 45dB/km at still same rain rates. The above performance is so, because at higher frequency bands, the wavelength of the propagated electromagnetic waves approaches the mean diameter of the raindrop. Consequently, this will result to substantial energy tradeoff between the raindrops and the propagated electromagnetic waves. Such energy interaction tradeoff will in turn leads to major attenuation of the propagated electromagnetic wave signals. The attenuation effect becomes more serious with larger rain rates. This is simply based on the principle of physics, wherein the higher transmission frequency of waves, the smaller the wavelength will become smaller. Also at lower frequency bands, the wavelength of the propagated electromagnetic waves becomes much larger than the mean raindrop diameter [43-47].
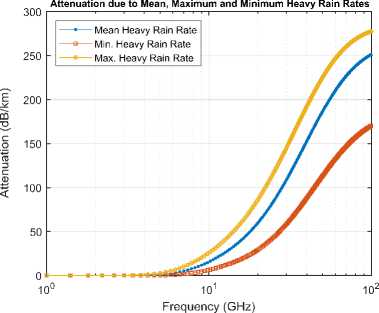
Fig. 18. Specific attenuation and frequency relationship for Heavy rain rates
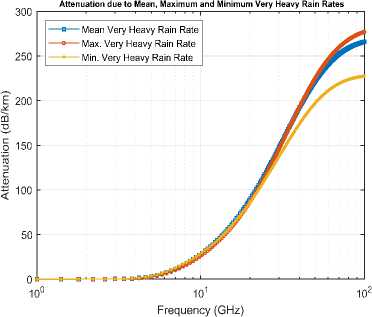
Fig. 19. Specific attenuation and frequency relationship for Very Heavy rain rates
Frequency (GHz)
Fig. 20. Specific attenuation and frequency relationship for Extreme rain rates
5. Conclusion
Atmospheric based impairments remained one key source of signal degradation in cellular communication links. This contribution was designed to investigate the rain intensity influence on raindrop diameter and specific attenuation of microwaves in the 3-30GHz band. The aim has been fully accomplished by engaging combined empirical rain rate data and relevant models such as lognormal and Weibull for the investigation. By means of the two models, the highest raindrops concentration values attained in correspondence with the specific rain attenuation were made by drop diameters not more than 2.5 mm. In terms of rain rate, specific attenuation and frequency connection, the results disclose that attenuation of propagated electromagnetic waves increases at increasing rainfall depth and increasing operating frequency bands. It also shows that attenuation to rain is directly proportional to the increase in rain intensity levels and increase of the operational frequency. The above performance is so, because at higher frequency bands, the wavelength of the propagated electromagnetic waves approaches the mean diameter of the raindrop. The results display gradual increase in attenuation levels as the diameter rain drop sizes and intensity increases or become broader. The attenuation effect becomes more serious with larger rain rates. This is simply based on the principle of physics, wherein the higher transmission frequency of waves, the smaller the wavelength will become smaller. Also at lower frequency bands, the wavelength of the propagated electromagnetic waves becomes much larger than the mean raindrop diameter.
Author Contributions: The manuscript was written through the contributions of all authors. J.I., was responsible for the conceptualization of the topic; article gathering and sorting were carried out by J.I. and I.H.O; manuscript writing and original drafting and formal analysis were carried out by J.I., I.A, and I.H.O.,writing of reviews and editing were carried out by J.I., and I.A.; and J.I., led the overall research activity. All authors have read and agreed to the published version of the manuscript.
References Tropical Rain Intensity Impact on Raindrop Diameter and Specific Signal Attenuation at Microwaves Communication Link
- Ekpenyong, M., Umoren. E., & Isabona, J. (009). A Rain Attenuation Model for Predicting Fading Effect on Wireless Communication Systems in the Tropics,” Niger. J. Sp. Res., 6, 21–32.
- Linga, P., Iddi, H., & Kissaka, M. (2020). Contour Mapping for Rain Rate and Rain Attenuation in Microwave and Millimetre Wave Earth-Satellite Link Design in Tropical Tanzania,” Tanzania J. Sci., 46, (3), 886–902.
- Ebhota, V. C., Isabona, J & Srivastava, V. M. (2019). Environment-Adaptation Based Hybrid Neural Network Predictor for Signal Propagation Loss Prediction in Cluttered and Open Urban Microcells,” Wirel. Pers. Commun., 104 (3), 935–948. doi: 10.1007/s11277-018-6061-2.
- Isabona, J.; Imoize, A.L.; Ojo, S.; Lee, C.-C.; Li, C.-T. Atmospheric Propagation Modelling for Terrestrial Radio Frequency Communication Links in a Tropical Wet and Dry Savanna Climate. Information 2022, 13, 141. https://doi.org/10.3390/info13030141.
- Isabona.J & Imoize, A.L. (2021). Terrain-based adaption of propagation model loss parameters using non-linear square regression, J. Eng. Appl. Sci., 68 (33). https://doi.org/10.1186/s44147-021-00035-7
- J. Isabona, and S. Azi, Measurement, Modeling and Analysis of Received Signal Strength at 800MHz and 1900MHz in Antenna Beam Tilt Cellular Mobile Environment, Elixir Comp. Sci. & Engg. 54 (2013) 12300-12303
- Isabona. J. (2020). Wavelet Generalized Regression Neural Network Approach for Robust Field Strength Prediction,” Wirel. Pers. Commun., 114, 3635–3653. https://doi.org/10.1007/s11277-020-07550-5.
- Ebhota, V. C., Isabona, J & Srivastava, V. M. (2018). Base line knowledge on propagation modelling and prediction techniques in wireless communication networks, Journal of Engineering and Applied Sciences (JEAS), 13 (4), 235-240.
- Moupfouma, F. (1987). Rain induced attenuation prediction model for terrestrial and satellite-earth microwave links,” in Annales des télécommunications, 42, (9), 539–550.
- Afahakan, I. E., Udofia, K. M., & Umoren, M. A. (2016). Analysis of Rain Rate and Rain Attenuation for Earth-Space Communication Links over Uyo-Akwa Ibom State,” Niger. J. Technol., 35(1), 137–143.
- Hassan, N. U. L., Huang, C., Yuen, C., Ahmad, A., & Zhang, Y. (2020). Dense small satellite networks for modern terrestrial communication systems: Benefits, infrastructure, and technologies,” IEEE Wirel. Commun., 27(5),96–103.
- Barclay, L. (2003). Propagation of Radiowaves, Third Edition IET, 1-433.
- Rimven, G. R., Paulson, K. S., & Bellerby,T. (2018). Estimating One-Minute Rain Rate Distributions in the Tropics from TRMM Satellite Data, IEEE J. Sel. Top. Appl. Earth Obs. Remote Sens., 11(10), 3660–3667.
- Linga, P., Iddi, H., & Kissaka, M. (2020). Contour Mapping for Rain Rate and Rain Attenuation in Microwave and Millimetre Wave Earth-Satellite Link Design in Tropical Tanzania,” Tanzania J. Sci., vol. 46 (3), 886–902.
- Abdulrahman, A. Y., Rahman, T. B. A., Rahim, S. K. B. A., & Md. Rafi Ul Islam (2010). A new rain attenuation conversion technique for tropical regions,” Prog. Electromagn. Res., 26, 53–67.
- Kestwal, M. C., Joshi, S & Garia, L.S (2014). Prediction of rain attenuation and impact of rain in wave propagation at microwave frequency for tropical region (Uttarakhand, India),” Int. J. Microw. Sci. Technol., vol. 2014, https://doi.org/10.1155/2014/958498
- Haule, P., Iddi, H., & Kissaka, M. (2020). Rain attenuation distribution for satellite microwave links application in Tanzania,” Indones. J. Electr. Eng. Comput. Sci., 17 (2), 982–987.
- Marzuki Marzuki, Dea Kurnia Harysandi, Rini Oktaviani, Lisna Meylani, Mutya Vonnisa, Harmadi Harmadi, Hiroyuki Hashiguchi, Toyoshi Shimomai, L. Luini, Sugeng Nugroho, Muzirwan Muzirwan, Nor Azlan Mohd Aris “ITU-R P. 837-6 and ITU-R P. 837-7 performance to estimate indonesian rainfall,” TELKOMNIKA Telecommunication, Computing, Electronics and Control Vol. 18 (5). 2292-2303 DOI: http://dx.doi.org/10.12928/telkomnika.v18i5.14316
- Bhattacharya, R., Das, R., Guha, R., Barman, S. D., & Bhattacharya, A. B. (2007). Variability of millimetrewave rain attenuation and rain rate prediction: A survey, Indian Journal of Radio & Space Physics, 36, 325-344.
- Maitra, A & Chakraborty, S. (2009). Cloud liquid water content and cloud attenuation studies with radiosonde data at a tropical location,” J. Infrared, Millimeter, Terahertz Waves, 30 (4), 367–373.
- Adhikari, A., Bhattacharya, A & Maitra, A. (2012). “Rain-induced scintillations and attenuation of Ku-band satellite signals at a tropical location,” IEEE Geosci. Remote Sens. Lett., 9 4), 700–704.
- Huang, J., Gong, S & Cai, B. (2011). The frequency scaling ratio factor of rain attenuation in Ka waveband along earth-space path in China,” in 2011 Second International Conference on Mechanic Automation and Control Engineering, 2011, 7831–7833.
- Ahuna, M. N., Afullo, T. J. & Alonge, A. A. (2016). 30-second and one-minute rainfall rate modelling and conversion for millimetric wave propagation in South Africa, SAIEE Africa Res. J., 107(1), 17–29.
- Owolawi, P. A., Malinga, S. J. & Afullo, T. J. O. (2012). Estimation of terrestrial rain attenuation at microwave and millimeter wave signals in South Africa using the ITU-R model,” PIERS Proceedings, Kuala Lumpur, Malaysia, 2012.
- Ojo, J. S. & Owolawi, P. A. (2014). Development of one-minute rain-rate and rain-attenuation contour maps for satellite propagation system planning in a subtropical country: South Africa,” Adv. Sp. Res., 54, no. 8, 1487–1501.
- Sumbiri, D., Afullo, T. J. O. & Alonge, A. (2016). “Rain attenuation prediction for terrestrial links at microwave and millimeter bands over Rwanda,” in 2016 Progress in Electromagnetic Research Symposium (PIERS), 4233–4236.
- Sumbiri, D., Afullo, T. J. & Alonge, A., “Rainfall zoning and rain attenuation mapping for microwave and millimetric applications in Central Africa,” Int. J. Commun. Anten. Propag, 6(4), 198–210, 2016.
- Shrestha, S & Choi, D.Y. (2019). Rain attenuation study over an 18 GHz terrestrial microwave link in South Korea,” Int. J. Antennas Propag., vol. 2019.
- Rose, T & Czekala, H. (2009). RPG-RATPRO radiometer operating manual (version 7.70),” Radiom. Phys. GmbH, Meckenheim, Ger. Tech. Rep, 2009.
- Grábner, M., Kvicera, V & Kostelecky, J. (2009). Application of Water Vapour Profiling for Gaseous Attenuation Estimation–Radiometer versus Radiosonde Results, 2009.
- Ben-Daoud, A., Ben-Daoud, M., Moroșanu, G. A., & M’Rabet, S. (2022) The use of low impact development technologies in the attenuation of flood flows in an urban area: Settat city (Morocco) as a case,” Environ. Challenges, 6, p. 100403.
- Christofilakis, V.; Tatsis, G.; Chronopoulos, S.K.; Sakkas, A.; Skrivanos, A.G.; Peppas, K.P.; Nistazakis, H.E.; Baldoumas, G.; Kostarakis, P. Earth-to-Earth Microwave Rain Attenuation Measurements: A Survey on the Recent Literature. Symmetry (2020), 12, 1440. https://doi.org/10.3390/sym12091440
- Christofilakis, V, Tatsis, G, Lolis, CJ, et al. A rain estimation model based on microwave signal attenuation measurements in the city of Ioannina, Greece. Meteorol Appl. 2020; 27:e1932.
- Papatsoris, A. D, Polimeris, K., & Lazou, A.A. (2008). Development of rain attenuation and rain rate maps for satellite communications system design in Greece,” in 2008 IEEE Antennas and Propagation Society International Symposium, 2008, 1–4.
- Laws, J.O., & Parsons, D.A, The relation of raindrop size to Intensity, Trans. Am. Geophys. Union, 1943, 24,452-460.
- Isabona, J, Imoize, A.L & Ojo, S Lee, C. Li. C (2022). "Atmospheric Propagation Modelling for Terrestrial Radio Frequency Communication Links in a Tropical Wet and Dry Savanna Climate" Information 13, no. 3: 141. https://doi.org/10.3390/info13030141
- Isabona, J, Imoize, A.L Rawat, P., Jamal, S.S., Pant, B., Ojo, S & Hinga, S.K (2022). "Realistic Prognostic Modeling of Specific Attenuation due to Rain at Microwave Frequency for Tropical Climate Region", Wireless Communications and Mobile Computing, 2022.https://doi.org/10.1155/2022/8209256
- Ulbrich, C. W., & D. Atlas (1984), Assessment of the contribution of differential polarization to improved rainfall measurements, Radio Sci. J., 19(1), 49–57
- Marshall, J.S. & W.M. Palmer. (1948). The distribution of raindrops with size. J. Meteorol. 5:165-166.
- Adimula, A.I & Ajayi, G.O. (1996). Variation in raindrop size distribution and specific attenuation due to rain in Nigeria,” Ann. Telecom, 51, 1-2, 87–93.
- Sekine, M., & G. Lind (1982), Rain attenuation of centimeter, millimeter and submillimeter radio waves, in Proceedings of the 12th European Microwave Conference, 586–589, IEEE, Helsinki, Finland.
- Olatunde, A.F & Isaac A (2018). Rainfall characteristics in Lokoja from 1981 to 2015. J Res Dev Arts Soc Sci 2:228–242.
- J. Isabona Joseph and D.O. Ojuh. (2021), ‘‘Application of Levenberg-Marguardt Algorithm for Prime Radio Propagation Wave Attenuation Modelling in Typical Urban, Suburban and Rural Terrains, I.J. Intelligent Systems and Applications, 2021, 7, 35-42
- D.O . Ojuh, and J. Isabona, (2021), Empirical and Statistical Determination of Optimal Distribution Model for Radio Frequency Mobile Networks Using Realistic Weekly Block Call Rates Indicator, I. J. Mathematical Sciences and Computing, 2021, 3, 12-23.
- D.O . Ojuh, and J. Isabona (2021) Field Electromagnetic Strength Variability Measurement and Adaptive Prognostic Approximation with Weighed Least Regression Approach in the Ultra-high Radio Frequency Band, J. Intelligent Systems and Applications, 2021, 4, 14-23
- I. Odesanya Joseph Isabona, Jangfa T. zhimwang, and Ikechi Risi, Cascade Forward Neural Networks-based Adaptive Model for Real-time Adaptive Learning of Stochastic Signal Power Datasets, I. J. Computer Network and Information Security, 2022, 3, 63-74 (http://www.mecs-press.org/) DOI: 10.5815/ijcnis.2022.03.05.
- J. Isabona, (2019), Maximum likelihood Parameter based Estimation for In-depth Prognosis Investigation of Stochastic Electric Field Strength Data, BIU Journal of Basic and Applied Sciences, vol. 4(1): 127 – 136, 2019.
