Typology of regions by level and dynamics of the quality of life

Author: Grinchel Boris Mikhailovich, Nazarova Evgeniya Andreevna
Journal: Economic and Social Changes: Facts, Trends, Forecast @volnc-esc-en
Section: Social development
Article in issue: 3 (39) т.8, 2015.
Free access
The paper considers the methodology and algorithm for the construction of typologies of regions in a two-dimensional space “level of development - dynamics of development” taking into account the quality of life, which is one of the most relevant competitiveness factors at the present stage of Russia's development. The authors analyze the concept of “quality of life” and propose their own variant of the concept, on the basis of which they make a list of indicators for measuring and assessing the “quality of life” factor. In the implementation of the algorithm it is proposed to transform specific indicators, which assess the level and dynamics of the quality of life, into nonmetric numerical scores, normalized to the weighted average values of indicators for the Russian regions. The method of transformation of indicators into scores was tested on the example of the Northwestern Federal District regions, and the typologies in a two-dimensional space “level - dynamics” of the quality of life were made for 80 regions of Russia; the level of the quality of life was assessed according to official statistics for 2013, and the dynamics of the quality of life was assessed with the use of official statistics for 2011-2013...
Typology of regions, competitive potential, quality of life, dynamics of the quality of life
Short address: https://sciup.org/147223722
IDR: 147223722 | UDC: 338.24(1-2/-3):316.42 | DOI: 10.15838/esc/2015.3.39.9
Text of the scientific article Typology of regions by level and dynamics of the quality of life
The regions are developing in the complex macro system of the country and the world and the degree of competitive attractiveness of a region depends not only on positive changes in the socio-economic environment, but also on the speed and vectors of change in the totality of regions participating in competitive interaction.
This work is aimed at:
-
• proposing methods to assess the development and construction of typologies of regions in function of two interdependent variables – level of development and growth dynamics;
-
• testing the method and identify patterns in the spatial development of Russian regions in terms of their competitive attractiveness for residents on the example of the life quality factor.
In accordance with the given objectives the study tries to solve the following tasks:
-
1. Offer the algorithm for twodimensional analysis and construction of typologies of regions by life quality in the function of two variables – level of life quality and dynamics of its change;
-
2. Create the system of indicators to assess the life quality level and dynamics in the regions, which is adequate to social development vectors in Russia;
-
3. Offer the method to translate different private indicators of life quality into generalized assessments;
-
4. Assess the feasibility and practical value of constructing typologies of regions in terms of their competitive attractiveness on the example of life quality.
Most often the economy dynamics is estimated by the index method applied to private and general indicators. However, it considers only the dynamics of development, but ignores the achieved level of economic indicators and their interactions. When the index method is used, the objects with lower more dynamic values of the initial indicators look more attractive. For example, developing countries have an advantage over developed ones by growth indices. “The index number is a widely prevalent disease in modern life... Many of...index numbers... lose their practical value immediately after calculation”, the well-known researcher of economic indices R. Allen quotes the statement of M.D. Maroki [1, p. 9].
Our model to measure the properties of competitive attractiveness of the territorial space takes into account changes in primary and general indicators of regions’ competitive potential by level and dynamics of life quality. The dynamics of regions’ competitive potential changes over time both by absolute values of private generalized assessments and relative to other regions. These changes depend on the growth rate of competitive properties indicators in the region and the average dynamics of analyzed indicators of Russia’s competitive attractiveness [4, 5, 9, 13]. The general algorithm of the two-dimensional analysis method and the construction of typologies of regions by a competitive potential factor are presented below (fig. 1).
The starting point of the algorithm to evaluate and analyze the increase in the attractiveness of regions by life quality is to define the term “life quality” relative to current time and identify the indicators. Enhancement of life quality is a critical challenge and a key goal of the strategic development of Russia and many foreign countries. The most common definition of “life quality” is given in the Encyclopedic sociological dictionary: this is a category that expresses the quality of satisfaction of material and cultural needs of people
-
Figure 1. Algorithm of the two-dimensional analysis method and construction of typologies of regions by quality of life
Elaboration of the concept “life quality” and formation of assessments
Calculation of the life quality level and growth dynamics in the regions by selected private indicators
Transformation of natural indicators of life quality and indices of their dynamics into scores
I
Calculation of generalized assessments of the life quality level and dynamics in the regions
I
Ranking of the regions according to the estimates and construction of a two-dimensional typology of the regions by combination of the life quality level and dynamics
I
Analysis of regional differences in the life quality level and dynamics for the development of strategies for increasing the competitive attractiveness of regions
(quality of food, clothing, comfort of home, quality of health, education, service sector, environment, etc.) [14, p. 265].
According to I.I. Sigova, the category of life quality is rather vague and this complicates its use in the practice of social management [11, p. 117]. V.E. Rokhchin and S.F. Zhilkin interpret this category as comprehensively characterizing the level and degree of well-being, freedoms, social and spiritual development [12, c. 35]. But this definition is also wide enough and does not take into account the differences in priorities with respect to countries at different levels of economic development. Considering the latter, we believe that in relation to the Russian regions’ development this category should be currently interpreted in the narrower sense of satisfaction of human needs in food, housing, safety, education, sustainable heat, power and water supply, operation of housing and utilities services. These requirements are obvious priorities in the strategic development of most regions; the degree of their satisfaction is still insufficient for most population [8, 10]. It can be confirmed by the fact that many strategic plans of Russian cities define the quality of life as a set of most urgent needs of the residents: wages exceeding the subsistence minimum, social security for the disabled population, quality housing and utilities services and protection from violence, corruption, extortion, etc. As for more developed countries, such as the European Union, people’s needs are a bit different: operation and security of public and private transport, a new level of infrastructure, energy and water saving and minimization of the harmful effects of waste. This caused by fact that many of the tasks concerning welfare and housing sectors are solved in these countries and the priorities are shifted to new problems and challenges. At the same time, there are many countries where the standard of living is much lower than in Russia. The assessment of life quality is focused on the satisfaction of most urgent necessities (food availability, protection from epidemics, primary education, reduction in child mortality, etc.).
With that said, we believe that the competitive attractiveness of Russian regions by life quality can be evaluated quite satisfactorily by the following partial indices ( tab. 1 ) [3, p. 115-119]. These figures are provided by official statistics in the Russian regions or easily calculated by means of interrelated statistical data [7]. This is equally true both for the assessment of the level of indicators and indicators of growth.
To obtain a generalized assessment of life quality it is necessary to reduce private indicators (for example, wages in rubles, construction of housing in meters per year per 1000 inhabitants, population per doctor, etc.) to a dimensionless form. The same is true for the assessment of life quality by the index of particular indicators. Due to the fact that by one set of indicators indices vary by 1–2%, by another – 8–15%, by the third – they can even be lower, simple averaging out of these indices decreases the value of the final assessment. As these indicators values are significantly uneven, we propose to divide the operational range of each level
Table 1. Private indicators of the life quality factor
LQ P
LQ n - LQ "avr
LQ "max — LQ »_ if LQ- > LQ"avr
x 50 + 50,
LQ n - LQ n
•p = i ----v i av^ x 50
ij LQLr - LQnmin if LQ j < LQ where LQipj – is a scoring value of the i-th indicator of life quality for the j-th region;
LQ i n j – is a natural value of the i -th indicator of life quality for the j -th region;
LQ i n avr – weighted average estimation of the i -th indicator of life quality all regions;
LQ i nmax ; LQ i nmin – maximum and minimum natural values of the i -th indicator of life quality for all regions;
50 – a reference point of the scale to the weighted average estimation of a natural value for all regions.
The use of both formulas (1) and (2) allows us to divide the total 100-point range of the estimates by each indicator into two sub-ranges by 50 points. This is caused by the fact that the overall 100-point range scale is non-linear for most indicators, as the upper part of the scale in relation to the national average includes major developed regions, which number is substantially less than in the lower sub-range of the scale. We propose to approximate the nonlinearity of the scale by 2 linear sections below and above average values of the indicator. This improves the accuracy of the calculations both for individual indicators and when they are totaled to obtain a generalized assessment. According to the same formulas converted index estimates of the dynamics [6] improve the quality of life. Generalized measurement of quality of life we offer to carry out on the basis of aggregated point estimates of the dynamics of particular indices. This is due to the fact that the average percentage increase or decrease in private indicators is not entirely correct, as some indicators can vary by 5–10% or more per year, others –only by 1–2% or less. Hence, the average value of the life quality indicator shifts towards most dynamic indicators, artificially raising their importance. The use of scores helps avoid it.
To make the situation clear, let us consider the calculation results for 10 regions of the Northwestern Federal district (tab. 2). For each region of the district we present 2 summative assessments – by level and dynamics of life quality growth. As already noted, the average values of both estimates (level and dynamics) are equal to 50 points. Saint Petersburg and the Kaliningrad Oblast were characterized by a higher life quality in 2013, comparing with other regions. Eight regions of the NWFD have the level of life quality below 50 points, with the lowers values being observed in the Vologda Oblast (30.2 points) and the Arkhangelsk Oblast (31.3 points), the Komi Republic (33.1 points), the Republic of Karelia (34.5 points) and the Pskov Oblast (34.7 points). The generalized assessments can be compared with private indicators for each region. For example, in 2013 of 10 private indicators Saint Petersburg had only one indicator less than the Russian average – 32 points by wastewater discharge. By this indicator 3 regions of the Northwestern Federal district (the Republic of Karelia, the Arkhangelsk Oblast and the Murmansk Oblast) have the lowest scoring1. If, for example, we do not include an environmental indicator in the generalized assessment, these regions receive significantly higher scores. However, this factor is becoming more relevant every day, that is why it is taken into account along with other indicators of well-being of the population. The second row in Table 2 describes the adjustment of life quality in each region for three years – from 2011 to 2013. By this indicator only one region in the Northwestern Federal district (the Arkhangelsk Oblast) received a score above the national average (56.6 points). Other regions, including Saint Petersburg, were characterized by lower dynamics of improving the quality of life than in Russia on average. It is especially evident in the Pskov Oblast, where of 10 private indicators only by 2 – housing improvements and wastewater treatment – the situation was bettering faster than in other regions.
According to the method of conversion of natural values into points and calculation of generalized assessments, we perform calculations of the level and dynamics of life qualitys for all regions of Russia. For this work we use the statistical data for 80 Russian regions, did not separate Nenets, Khanty-Mansi and Yamal-Nenets
Table 2. Scoring of the level and growth dynamics of private and generalized assessments of life quality in the NWFD regions*
|
Region |
Generalized assessment |
I lqf1 |
I lqf2 |
I lqf3 |
lqf4 |
I lqf5 |
I lqf6 |
I lqf7 |
I lqf8 |
I lqf9 |
I lqf10 |
|
|
Saint Petersburg |
level |
81.9 |
81 |
100 |
94 |
100 |
53 |
100 |
100 |
32 |
98 |
62 |
|
dynamics |
47.4 |
28 |
62 |
44 |
43 |
25 |
63 |
59 |
52 |
45 |
53 |
|
|
Kaliningrad Oblast |
level |
54.2 |
33 |
35 |
45 |
83 |
75 |
40 |
33 |
52 |
94 |
52 |
|
dynamics |
41.7 |
38 |
53 |
26 |
46 |
51 |
1 |
36 |
37 |
80 |
48 |
|
|
Murmansk Oblast |
level |
46.1 |
71 |
46 |
50 |
100 |
1 |
72 |
21 |
1 |
36 |
62 |
|
dynamics |
47.6 |
24 |
75 |
63 |
54 |
47 |
39 |
12 |
43 |
41 |
79 |
|
|
Arkhangelsk Oblast |
level |
31.3 |
32 |
13 |
39 |
22 |
22 |
66 |
32 |
1 |
43 |
43 |
|
dynamics |
56.6 |
63 |
нд |
26 |
60 |
52 |
47 |
57 |
51 |
100 |
53 |
|
|
Leningrad Oblast |
level |
43.1 |
48 |
32 |
55 |
36 |
91 |
12 |
13 |
28 |
47 |
69 |
|
dynamics |
40.9 |
38 |
54 |
59 |
31 |
54 |
32 |
13 |
32 |
35 |
62 |
|
|
Novgorod Oblast |
level |
39.4 |
27 |
29 |
46 |
21 |
54 |
36 |
15 |
45 |
71 |
51 |
|
dynamics |
42.3 |
38 |
28 |
60 |
44 |
52 |
23 |
35 |
59 |
38 |
47 |
|
|
Komi Republic |
level |
33.1 |
47 |
30 |
40 |
39 |
8 |
50 |
30 |
47 |
1 |
39 |
|
dynamics |
44.6 |
59 |
53 |
53 |
41 |
55 |
27 |
50 |
57 |
36 |
15 |
|
|
Vologda Oblast |
level |
30.2 |
21 |
22 |
43 |
17 |
47 |
13 |
29 |
43 |
21 |
47 |
|
dynamics |
45.2 |
22 |
58 |
71 |
1 |
56 |
35 |
58 |
50 |
40 |
62 |
|
|
Republic of Karelia |
level |
34.5 |
24 |
15 |
39 |
37 |
31 |
59 |
42 |
1 |
46 |
50 |
|
dynamics |
38.8 |
21 |
39 |
40 |
53 |
54 |
24 |
41 |
28 |
27 |
60 |
|
|
Pskov Oblast |
level |
34.7 |
13 |
10 |
33 |
24 |
23 |
16 |
14 |
72 |
84 |
59 |
|
dynamics |
36.3 |
34 |
32 |
29 |
54 |
41 |
34 |
2 |
54 |
47 |
36 |
|
* The average value of each indicator is equal to 50 points. The life quality level is given for 2013. The growth dynamics is given for 2013 relative to 2011.
The regions are ranked by half-sum of generalized assessments of the level and growth dynamics of life quality.
Autonomous okrugs, as some statistical data were absent. The results are presented in Table 3, where the regions are simply ranked by the half-sum of assessments of these two indicators. According to the table, Saint Petersburg and Moscow are in the lead by life quality level. The gap between these regions and the Republic of Tatarstan, the Belgorod Oblast and the Moscow Oblast amounts to almost 20 points. Then we single out a group of regions (the Kursk Oblast, the Voronezh Oblast and the Nizhny Novgorod Oblast), characterized by the high life quality level and dynamics. This is followed by the regions, where either the level or dynamics of life quality is higher than 50 points. Exceptions occur in five areas – the Ryazan Oblast, the Astrakhan Oblast, the Penza Oblast, the Yaroslavl Oblast and the Samara Oblast.
It is necessary to find a tool that would allow us to build a typology of regions on the basis of a more interesting indicator than, for example, the sum of level and dynamics estimates. We suggest carrying out graphic construction of typologies, corresponding to the four squares in the coordinate system where the life quality dynamics is indicated by the abscissa axis and the life quality level – by the ordinate
Table 3. Scoring of generalized assessments of the life quality level and dynamics in Russian regions (the regions are ranked by half-sum of assessments)
|
Regions of Russia |
Scoring of life quality (2013.) |
Scoring of life quality dynamics (2013/2011) |
Half-sum of assessments |
|
Saint Petersburg |
81.9 |
47.4 |
64.6 |
|
Moscow |
81.4 |
46.3 |
63.9 |
|
Kursk Oblast |
57.9 |
62.8 |
60.3 |
|
Voronezh Oblast |
59.7 |
57.7 |
58.7 |
|
Nizhny Novgorod Oblast |
54.8 |
60.7 |
57.7 |
|
Republic of Tatarstan |
63.6 |
49.3 |
56.4 |
|
Chechen Republic |
41.9 |
70.6 |
56.3 |
|
Ryazan Oblast |
50.2 |
60.7 |
55.5 |
|
Belgorod Oblast |
63.0 |
47.6 |
55.3 |
|
Stavropol Krai |
49.4 |
59.7 |
54.6 |
|
Astrakhan Oblast |
54.2 |
54.9 |
54.6 |
|
Penza Oblast |
50.4 |
58.4 |
54.4 |
|
Ivanovo Oblast |
43.2 |
64.0 |
53.6 |
|
Tyumen Oblast |
57.4 |
48.6 |
53.0 |
|
Moscow Oblast |
62.4 |
43.2 |
52.8 |
|
Novosibirsk Oblast |
55.3 |
49.8 |
52.5 |
|
Tambov Oblast |
57.1 |
47.9 |
52.5 |
|
Tver Oblast |
46.2 |
58.7 |
52.4 |
|
Republic of North Ossetia–Alania |
58.9 |
45.4 |
52.2 |
|
Yaroslavl Oblast |
50.0 |
53.2 |
51.6 |
|
Lipetsk Oblast |
54.1 |
49.1 |
51.6 |
|
Krasnodar Oblast |
49.9 |
52.6 |
51.2 |
|
Samara Oblast |
51.1 |
50.7 |
50.9 |
|
Sakhalin Oblast |
53.5 |
47.9 |
50.7 |
|
Chuvash Republic |
54.1 |
46.6 |
50.4 |
|
Tomsk Oblast |
46.7 |
53.8 |
50.2 |
|
Kabardino-Balkar Republic |
47.5 |
51.6 |
49.5 |
|
Republic of Ingushetia |
51.0 |
47.8 |
49.4 |
|
Omsk Oblast |
51.0 |
47.5 |
49.3 |
|
Altai Krai |
39.6 |
58.2 |
48.9 |
|
Kaluga Oblast |
55.4 |
42.1 |
48.8 |
|
Perm |
43.5 |
54.0 |
48.8 |
|
Saratov Oblast |
53.8 |
42.9 |
48.3 |
|
Kostroma Oblast |
42.3 |
53.7 |
48.0 |
|
Kaliningrad Oblast |
54.2 |
41.7 |
47.9 |
|
Republic of Mordovia |
47.0 |
48.7 |
47.8 |
|
Sverdlovsk Oblast |
50.9 |
44.5 |
47.7 |
|
Ulyanovsk Oblast |
43.8 |
51.5 |
47.7 |
|
Udmurt Republic |
44.7 |
50.6 |
47.6 |
Continuation of the table 3
|
Sakha (Yakutia) Republic |
42.0 |
52.8 |
47.4 |
|
Orenburg Oblast |
42.2 |
52.3 |
47.3 |
|
Volgograd Oblast |
44.5 |
49.5 |
47.0 |
|
Tula Oblast |
45.4 |
48.4 |
46.9 |
|
Rostov Oblast |
45.6 |
48.1 |
46.9 |
|
Murmansk Oblast |
46.1 |
47.6 |
46.8 |
|
Bryansk Oblast |
45.0 |
48.5 |
46.8 |
|
Republic of Dagestan |
51.4 |
41.9 |
46.6 |
|
Republic of Bashkortostan |
50.6 |
42.6 |
46.6 |
|
Vladimir Oblast |
40.4 |
52.8 |
46.6 |
|
Republic of Adygea |
43.0 |
49.8 |
46.4 |
|
Smolensk Oblast |
43.7 |
49.1 |
46.4 |
|
Chukotka Autonomous Okrug |
54.9 |
37.6 |
46.2 |
|
Mari El Republic |
41.4 |
51.0 |
46.2 |
|
Orel Oblast |
49.0 |
42.4 |
45.7 |
|
Magadan Oblast |
51.0 |
39.7 |
45.3 |
|
Khabarovsk Krai |
44.3 |
45.8 |
45.0 |
|
Amur Oblast |
39.9 |
49.6 |
44.7 |
|
Arkhangelsk Oblast |
31.3 |
56.6 |
44.0 |
|
Zabaykalsky Krai |
34.4 |
52.4 |
43.4 |
|
Republic of Kalmykia |
34.8 |
50.5 |
42.6 |
|
Chelyabinsk Oblast |
39.7 |
45.5 |
42.6 |
|
Kamchatka Krai |
46.3 |
38.5 |
42.4 |
|
Leningrad Oblast |
43.1 |
40.9 |
42.0 |
|
Republic of Khakassia |
36.9 |
46.9 |
41.9 |
|
Novgorod Oblast |
39.4 |
42.3 |
40.8 |
|
Krasnoyarsk Krai |
36.9 |
43.8 |
40.3 |
|
Kirov Oblast |
37.5 |
41.7 |
39.6 |
|
Karachay-Cherkess Republic |
30.0 |
48.9 |
39.5 |
|
Primorsky Krai |
38.5 |
40.1 |
39.3 |
|
Komi Republic |
33.1 |
44.6 |
38.8 |
|
Kurgan Oblast |
31.8 |
45.0 |
38.4 |
|
Irkutsk Oblast |
29.8 |
46.6 |
38.2 |
|
Vologda Oblast |
30.2 |
45.2 |
37.7 |
|
Republic of Buryatia |
34.9 |
40.2 |
37.6 |
|
Republic of Karelia |
34.5 |
38.8 |
36.6 |
|
Pskov Oblast |
34.7 |
36.3 |
35.5 |
|
Altai Republic |
30.9 |
37.2 |
34.1 |
|
Kemerovo Oblast |
29.6 |
36.0 |
32.8 |
|
Jewish Autonomous Oblast |
27.9 |
31.5 |
29.7 |
|
Tyva Republic |
24.1 |
34.2 |
29.1 |
Figure 2. Typological division of Russian regions by the life quality factor by the coordinate system squares
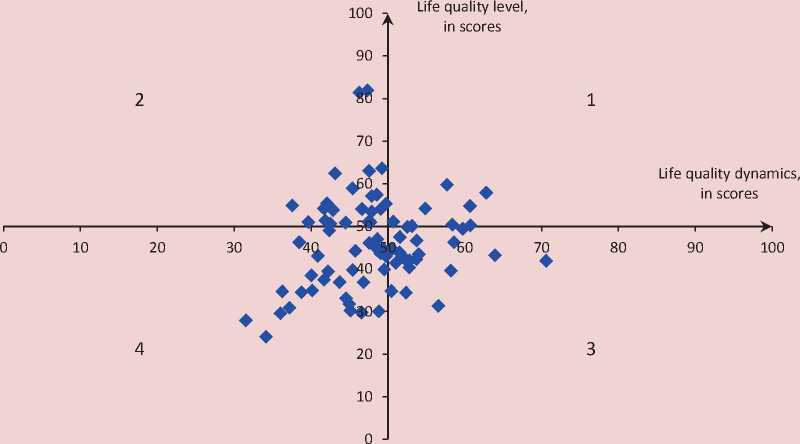
axis. The intersection of the coordinate axes corresponds to average values of these estimates for all Russian regions, i.e. 50 points ( fig. 2 ).
In the figure the Russian regions are shown by points in the coordinate system of the two-dimensional mathematical space. The typological group of regions based on graphical interpretation of the estimates of life quality level and dynamics:
-
• Group 1 – developed and developing regions;
-
• Group 2 – developed regions, but characterized by retarded development;
-
• Group 3 – regions with a lower level of life quality, but which are rapidly developing;
-
• Group 4 – regions with a lower level and dynamics of life quality.
The upper right square includes Group 1 regions, where the dynamics and the level of life quality are higher than the national average ( tab. 4 ). They are the Kursk Oblast, the Voronezh Oblast, the Nizhny Novgorod Oblast, the Ryazan Oblast, the Astrakhan Oblast, the Penza Oblast, the Yaroslavl Oblast and the Samara Oblast. This is a slightly different perspective for the assessment of the quality of social development of regions, as it estimates not only the success of the preceding period of development, but also the efficiency of current management. The more above and the more to the right in this square the
Table 4. Group 1 regions that have the higher level and dynamics of life quality compared to the national average
|
Region |
Life quality level |
Life quality growth dynamics |
Region |
Life quality level |
Life quality growth dynamics |
|
Kursk Oblast |
57.9 |
62.8 |
Astrakhan Oblast |
54.2 |
54.9 |
|
Voronezh Oblast |
59.7 |
57.7 |
Penza Oblast |
50.4 |
58.4 |
|
Nizhny Novgorod Oblast |
54.8 |
60.7 |
Yaroslavl Oblast |
50.0 |
53.2 |
|
Ryazan Oblast |
50.2 |
60.7 |
Samara Oblast |
51.1 |
50.7 |
Table 5. Group 2 regions that have a higher level and lower growth of life quality compared to the national average
|
Region |
Life quality level |
Life quality growth dynamics |
Region |
Life quality level |
Life quality growth dynamics |
|
Saint Petersburg |
81.9 |
47.4 |
Chuvash Republic |
54.1 |
46.6 |
|
Moscow |
81.4 |
46.3 |
Republic of Ingushetia |
51.0 |
47.8 |
|
Republic of Tatarstan |
63.6 |
49.3 |
Omsk Oblast |
51.0 |
47.5 |
|
Belgorod Oblast |
63.0 |
47.6 |
Kaluga Oblast |
55.4 |
42.1 |
|
Tyumen Oblast |
57.4 |
48.6 |
Saratov Oblast |
53.8 |
42.9 |
|
Moscow Oblast |
62.4 |
43.2 |
Kaliningrad Oblast |
54.2 |
41.7 |
|
Novosibirsk Oblast |
55.3 |
49.8 |
Sverdlovsk Oblast |
50.9 |
44.5 |
|
Tambov Oblast |
57.1 |
47.9 |
Republic of Dagestan |
51.4 |
41.9 |
|
Republic of North Ossetia– Alania |
58.9 |
45.4 |
Chukotka Autonomous Okrug |
54.9 |
37.6 |
|
Lipetsk Oblast |
54.1 |
49.1 |
Republic of Bashkortostan |
50.6 |
42.6 |
|
Sakhalin Oblast |
53.5 |
47.9 |
Magadan Oblast |
51.0 |
39.7 |
Table 6. Group 2 regions that have a lower level and higher dynamics of life quality compared to the national average
|
Region |
Life quality level |
Life quality growth dynamics |
Region |
Life quality level |
Life quality growth dynamics |
|
Chechen Republic |
41.9 |
70.6 |
Udmurt Republic |
44.7 |
50.6 |
|
Stavropol Krai |
49.4 |
59.7 |
Sakha (Yakutia) Republic |
42.0 |
52.8 |
|
Ivanovo Oblast |
43.2 |
64.0 |
Orenburg Oblast |
42.2 |
52.3 |
|
Tver Oblast |
46.2 |
58.7 |
Vladimir Oblast |
40.4 |
52.8 |
|
Krasnodar Oblast |
49.9 |
52.6 |
Mari El Republic |
41.4 |
51.0 |
|
Tomsk Oblast |
46.7 |
53.8 |
Arkhangelsk Oblast |
31.3 |
56.6 |
|
Altai Krai |
39.6 |
58.2 |
Zabaykalsky Krai |
34.4 |
52.4 |
|
Perm Krai |
43.5 |
54.0 |
Republic of Kalmykia |
34.8 |
50.5 |
|
Kostroma Oblast |
42.3 |
53.7 |
Kabardino-Balkar |
47.5 |
51.6 |
|
Ulyanovsk Oblast |
43.8 |
51.5 |
Republic |
Table 7. Group 2 regions that have a lower level and dynamics of life quality compared to the national average
|
Region |
Life quality level |
Life quality growth dynamics |
Region |
Life quality level |
Life quality growth dynamics |
|
Republic of Mordovia |
47.0 |
48.7 |
Krasnoyarsk Krai |
36.9 |
43.8 |
|
Volgograd Oblast |
44.5 |
49.5 |
Kirov Oblast |
37.5 |
41.7 |
|
Tula Oblast |
45.4 |
48.4 |
Karachay-Cherkess Republic |
30.0 |
48.9 |
|
Rostov Oblast |
45.6 |
48.1 |
Primorsky Krai |
38.5 |
40.1 |
|
Murmansk Oblast |
46.1 |
47.6 |
Komi Republic |
33.1 |
44.6 |
|
Bryansk Oblast |
45.0 |
48.5 |
Kurgan Oblast |
31.8 |
45.0 |
|
Republic of Adygea |
43.0 |
49.8 |
Irkutsk Oblast |
29.8 |
46.6 |
|
Smolensk Oblast |
43.7 |
49.1 |
Vologda Oblast |
30.2 |
45.2 |
|
Orel Oblast |
49.0 |
42.4 |
Republic of Buryatia |
34.9 |
40.2 |
|
Khabarovsk Krai |
44.3 |
45.8 |
Republic of Karelia |
34.5 |
38.8 |
|
Amur Oblast |
39.9 |
49.6 |
Pskov Oblast |
34.7 |
36.3 |
|
Chelyabinsk Oblast |
39.7 |
45.5 |
Altai Republic |
30.9 |
37.2 |
|
Kamchatka Krai |
46.3 |
38.5 |
Kemerovo Oblast |
29.6 |
36.0 |
|
Leningrad Oblast |
43.1 |
40.9 |
Tyva Republic |
24.1 |
34.2 |
|
Republic of Khakassia |
36.9 |
46.9 |
Jewish Autonomous Oblast |
27.9 |
31.5 |
|
Novgorod Oblast |
39.4 |
42.3 |
The fourth group of regions – with a lower level and dynamics of life quality – has 31 regions, with eight of them being located in the Northwestern Federal district ( tab. 7 ). This group includes 7 regions of the Siberian Federal district and 5 regions of the Far Eastern Federal district. The unfavorable situation there is confirmed by a systematic outflow of the resident population.
In general, the regional social policy to regulate and align the quality of life in Russia can be considered quite positive, as most regions are located in the square of the two-dimensional space with coordinates from 40 to 60 points. Of 80 it includes 44 regions and 8 regions, where the level or dynamics of life quality are higher than in the specified square. It seems to us that only 10 regions (the Tyva Republic, Jewish Autonomous Oblast, Altai Republic, the Irkutsk Oblast and several others) have very
a low level and growth dynamics. These regions require measures for accelerated social development.
The presented typology provides a better understanding of advantages and disadvantages of both federal and local social policies of regions’ strategic development and helps justify the need in programs and projects focused on territorial development, taking into account the need to ensure competitive attractiveness of regions.
The method and algorithm can be applied for the analysis of regional development and relevant factors of competitive attractiveness: economic, innovation and infrastructural development, human potential. The two-dimensional space of analysis allows us to identify regional development factors, such as economy and innovation, economy and life quality, education and innovation development.
References Typology of regions by level and dynamics of the quality of life
- Allen R. Ekonomicheskie indeksy . Translated from English by L.S. Kuchaev, foreword by V.V. Martynov. Moscow: Statistika, 1980. 256 p.
- Vishnev S.M. Ekonomicheskie parametry . Moscow: Nauka, 1968. 190 p.
- Grinchel' B.M., Nazarova E.A. Metody otsenki konkurentnoi privlekatel'nosti regionov: monografiya . Saint Petersburg: GUAP, 2014. P. 242.
- Marshalova A.S., Kovaleva G.D., Untura G.A. et al. Konkurentosposobnost' i strategicheskie napravleniya razvitiya regiona . Ed. by A.S. Novoselov. Novosibirsk: IEOPP SO RAN, 2008. 528 p.
- Kuznetsov S.V. Sotsial'nye prioritety regionov v kontekste strategii territorial'nogo razvitiya . Vybor strategicheskikh prioritetov regional'nogo razvitiya: novye teoretiko-metodologicheskie podkhody . Under general editorship of V.V. Okrepilov. Saint Petersburg: Nauka, 2008. 240 p.
- Opredelenie dinamiki . Available at: https://ru.wikipedia.org/wiki/Dinamika/(accessed April 30, 2014)
- Ofitsial'nyi sait Federal'noi sluzhby gosudarstvennoi statistiki . Available at: http://www.gks.ru/(accessed August 30, 2014)
- Razvitie rossiiskikh regionov: novye teoreticheskie i metodologicheskie podkhody . Executive editor E.B. Kostyanovskaya. Saint Petersburg: Nauka, 2006. 618 p.
- Porter M. Konkurentsiya . Translated from English. Moscow: Vil'yams, 2000. 495 p.
- Savel'ev Yu.V. Upravlenie konkurentosposobnost'yu regiona: ot teorii k praktike . Petrozavodsk: Karel'skii nauchnyi tsentr RAN, 2010. 516 p.
- Sigov I.I. Regional'naya ekonomika (ponyatiinyi apparat) . 2nd edition, revised and supplemented. Saint Petersburg, 2002. 200 p.
- Strategicheskii vybor goroda: nauchnoe obosnovanie i mekhanizm realizatsii (na primere g. Tol'yatti Samarskoi oblasti) . Ed. by V.E. Rokhchin, S.F. Zhilkin. Saint Petersburg: ISEP RAN, 1999. 183 p.
- Tatarkin A.I. Formirovanie konkurentnykh preimushchestv regionov Rossii . Region: ekonomika i sotsiologiya , 2006, no. 1, pp. 141-154.
- Entsiklopedicheskii sotsiologicheskii slovar' . Under general editorship of RAS Academician G.V. Osipov. Saint Petersburg: ISPI RAN, 1995. 939 p.
