Uncovering unstable plaques: deep learning segmentation in optical coherence tomography

Author: Laptev V.V., Danilov V.V., Ovcharenko E.A., Klyshnikov K.Y., Kolesnikov A.Y., Arnt A.A., Bessonov I.S., Litvinyuk N.V., Kochergin N.A.
Journal: Компьютерная оптика @computer-optics
Section: Обработка изображений, распознавание образов
Article in issue: 5 т.49, 2025.
Free access
One of the primary objectives in modern cardiology is to analyze the risk of acute coronary syndrome (ACS) in patients with ischemic heart disease to develop preventive measures and determine the optimal treatment strategy. This study aims to develop an automated approach for the timely detection of significant, rupture-prone coronary lesions (unstable plaques) to prevent ACS. We collected optical coherence tomography (OCT) volumes from 34 patients, with each OCT volume representing an RGB video of 704×704 pixels per frame, acquired over a certain depth. After filtering and manual annotation, 11,771 images were obtained to identify four types of objects: Lumen, Fibrous cap, Lipid core, and Vasa vasorum. To segment and quantitatively assess these features, we configured and evaluated the performance of nine deep learning models (U-Net, LinkNet, FPN, PSPNet, DeepLabV3, PAN, MA-Net, U-Net++, DeepLabV3++). The study presents two approaches for training the aforementioned models: 1) detecting all analyzed objects and 2) applying a cascade of neural network models to separately detect subsets of objects. The results demonstrate the superiority of the cascade approach for analyzing OCT images. The combined use of PAN and MA-Net models achieved the highest average Dice similarity coefficient (DSC) of 0.721.
Semantic segmentation, deep learning, vascular segmentation, unstable plaques, optical coherence tomography
Short address: https://sciup.org/140310598
IDR: 140310598 | DOI: 10.18287/2412-6179-CO-1571
Text of the scientific article Uncovering unstable plaques: deep learning segmentation in optical coherence tomography
One of the paramount objectives in contemporary cardiology is the identification of unstable plaques to develop preventive measures against adverse cardiovascular events. An unstable plaque is characterized as predisposed to rupture, potentially leading to coronary artery thrombosis. The term "unstable plaque" was first coined over two decades ago in the context of describing the triggers of acute coronary syndrome, representing a clinically insignificant but rupture-prone coronary lesion [1].
Several studies have demonstrated that approximately 70% of ACS patients exhibit borderline coronary lesions ranging from 50% to 70% stenosis, identified by coronary angiography prior to adverse events [2, 3]. Additionally, unstable, rupture-prone plaques often exhibit eccentric growth and do not result in significant luminal narrowing [4, 5]. Consequently, in most cases, such plaques remain clinically silent until the onset of acute events and are not amenable to revascularization according to current recommendations.
Standard coronary angiography only detects occlusive-stenotic lesions of the coronary vasculature, necessitating the search for alternative methods to identify unstable plaques. Over the past two decades, intravascular imaging modalities (intravascular ultrasound, optical coherence tomography) have seen significant development, enabling morphological analysis of atherosclerotic plaques (AP) that correlates with histological findings at autopsy [6]. Major histological criteria for plaque vulnerability include a large lipid core (more than 40% of total volume), thin fibrous cap (less than 65 ^m), and the presence of macrophage infiltration within the fibrous cap. Based on retrospective studies, several criteria for identifying unstable plaques with a high risk of causing acute coronary events have been proposed. However, the validity and prognostic significance of these criteria remain unproven.
Recognizing the pivotal role of machine learning in medical image analysis [7 – 10], we have endeavored to advance the field further in this study. By harnessing the power of machine learning, we aimed to develop a robust tool for the segmentation and quantitative assessment of coronary OCT-image objects. Our unique dataset, compiled from a cohort of 34 patients, has undergone meticulous annotation by experts and continues to expand, thereby facilitating further research into plaque vulnerability and cardiovascular risk assessment.
In our pursuit of innovation, we conducted extensive tuning and testing of various industry-standard neural networks. Through this iterative process, we devised an ensemble approach that not only enhances the accuracy and reliability of coronary OCT-image segmentation but also lays the groundwork for future advancements in this domain. By combining the strengths of multiple neural networks, our approach offers a comprehensive solution to the challenges posed by the intricate nature of coronary OCT-images.
Furthermore, our study underscores the importance of interdisciplinary collaboration between cardiology and artificial intelligence research. By leveraging insights from both fields, we have made significant strides towards bridging the gap between traditional diagnostic techniques and cutting-edge technological innovations. This synergy holds promise for revolutionizing the diagnosis and management of cardiovascular diseases, ultimately improving patient outcomes and quality of life.
Data
To address the given task, an in vivo detailed collection of optical coherence tomography data was conducted during percutaneous coronary interventions, including images of atherosclerotic plaques in blood vessels. This study is being conducted in accordance with national guidelines; therefore, separate voluntary consent and LEC approval are not required. To ensure the representativeness of the sample, OCT volumes were obtained from two devices, one from St. Jude Medical and the other from LightLab Imaging. The data were collected during diagnostic procedures at the Research Institute for Complex Issues of Cardiovascular Diseases (Kemerovo) and the Tyumen Cardiology Research Center (Tyumen). In total, 34 OCT volumes were collected and annotated, including 17 images from female patients and 17 from male patients. Each OCT volume is a video with a frame resolution of 704×704×3 pixels. The OCT volumes vary in length (depth of view) from 215 to 270 frames.
During data annotation, 11,771 images were reviewed, with relevant objects detected in 6,157 images. This annotated data set was divided into two parts: 4,842 images (80%) were used as the training set, and the remaining 1,315 images (20%) were used for testing. This division was done on a per-patient basis to provide a more accurate assessment of the proposed method. To enhance the detection model's efficiency, the original image underwent the following transformations:
-
- The area for analysis (region containing the annotated classes) was cropped.
-
- The cropped area was then resized to 1000×1000 pixels.
An example of this data processing is shown in Fig. 1, where all four analyzed objects are displayed. A brief description of each feature is provided below:
-
• Lumen (LM): This parameter of the vascular lumen is crucial for assessing the degree of stenosis and blood flow, which is vital for diagnosing the patient's condition.
-
• Fibrous cap (FC): This involves evaluating the presence and thickness of the fibrous cap, an area of the plaque with increased connective tissue density. The thickness of the fibrous cap is associated with plaque stability, making its analysis important for predicting the risk of rupture.
-
• Lipid core (LC): This involves identifying and characterizing the lipid core within the plaque, an area with a high content of fat deposits. The lipid core is a key indicator for assessing the degree of atherosclerotic activity and the risk of plaque rupture.
-
• Vasa vasorum (VV): This involves identifying the blood vessels penetrating the arterial wall and supplying it with nutrients. The presence and distribution of vasa vasorum are associated with inflammatory processes and can serve as indicators for assessing the degree of plaque inflammation.
It is also important to note that the number of objects in the images was imbalanced and varied from frame to frame. More detailed information on the distribution of objects in the dataset is presented in Table 1.
Tab. 1. Distribution of objects across dataset subsets
|
Class |
Train |
Test |
Total |
|
Lumen |
4886 |
1315 |
6201 |
|
Fibrous cap |
1199 |
282 |
1481 |
|
Lipid core |
1199 |
268 |
1467 |
|
Vasa vasorum |
156 |
38 |
194 |
Additionally, two more datasets were prepared to restore balance and develop a cascade of analysis models [11]. From the original dataset, all images with only the Lumen class present were excluded since its presence is consistent across all frames and its detection is not laborintensive. Data containing Vasa vasorum were formed into a separate subset due to their lower quantity and lack of correlation with the remaining classes. Further details regarding the characteristics of the obtained datasets can be found in Appendix A.
Methods
To segment the four classes in optical coherence tomography (OCT), we trained nine different neural network architectures: U-Net [12], LinkNet [13], FPN [14], PSPNet [15], DeepLabV3 [16], PAN [17], MA-Net [18], U-Net++ [19], and DeepLabV3+ [20]. Each neural network was trained for 175 epochs to ensure optimal convergence. To standardize training conditions, we used the ResNet-50 model as the encoder and a batch size of four images for all networks. Note that we utilized transfer learning to achieve early convergence [21]. The Adam optimizer with a learning rate of 0.00001 was used for optimization. The training process aimed to maximize segmentation accuracy, focusing on the Dice Similarity Coefficient. The DSC-based loss function is calculated as follows:
Loss = 1 -
2 S( Угие X ypred ) + £ S ytrue + S ypred + £
where ytrue and ypred are the ground truth and predicted values, respectively, and s is a constant (set to 10-7 in this study) to ensure numerical stability and prevent division by zero errors.
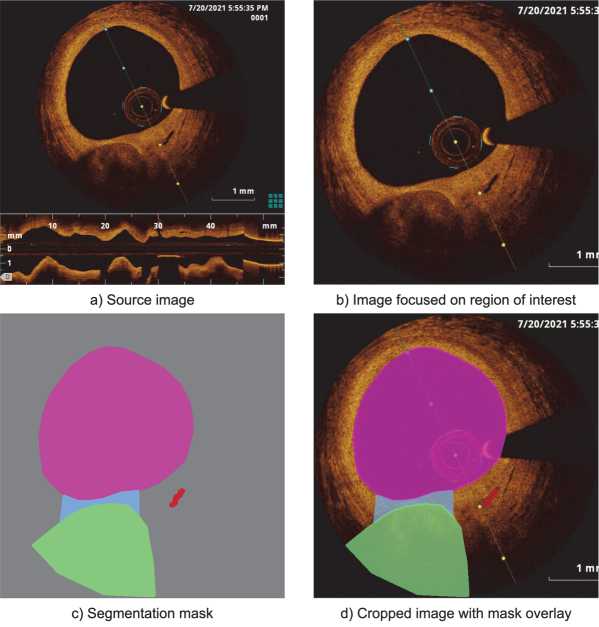
Fig. 1. Annotation of the source image showing the lumen (pink), fibrous cap (blue), lipid core (green), and vasa vasorum (red)
We conducted three series of model training:
-
1. Training on all classes using the entire annotated dataset.
-
2. Training on the Lumen, Fibrous cap, and Lipid core classes using only images where two or more classes are present.
-
3. Training for detecting the single class, Vasa vasorum.
During model training, we utilized a set of augmentation transformations from the “ Albumentations ” library [22]. These augmentations expanded the dataset and served as a regularization technique to reduce overfitting. The augmentation workflow included the following transformations:
-
- Horizontal flip with a probability of 50 %.
-
- Shift, scale, and rotate with a probability of 20%, allowing random shifts, scaling, and rotations within specified limits (shift limit=0.0625, scale limit=0.1, rotate limit = 15).
-
- Random crop with a probability of 20 %, applying a random-sized crop with dimensions ranging from 0.8 to 0.9 times the input size.
-
- Conditional padding to ensure a consistent image size for processing.
-
- Gaussian noise with a probability of 20 %, adding random noise with a variance range of 3 to 10.
-
- Perspective distortion with a probability of 20 %, applying random perspective transformations with a scale of 0.05 to 0.1.
-
- Random brightness and contrast adjustment with a probability of 20 %, within brightness and contrast limits of 0.2.
-
- Hue, saturation, and value adjustment with a probability of 20 %, shifting these values within limits of 20, 30, and 20, respectively.
The network training and testing were performed on a desktop computer featuring a 16-core Intel Xeon Gold 6326 CPU @ 2.90GHz, 128 GB of RAM, and an Nvidia A100 GPU with 40GB of video memory. PyTorch v2.1 and Python v3.11 were utilized as the primary machine learning framework and language for network development, respectively.
Results
We conducted an extensive evaluation of performance and convergence characteristics for nine deep learning models: U-Net, LinkNet, FPN, PSPNet, DeepLabV3,
PAN, MA-Net, U-Net++, and DeepLabV3+. This comprehensive analysis spanned 175 epochs, allowing us to track trends in loss and Dice similarity coefficient over time for each model. The number of iterations was determined empirically through pre-tuning and was considered sufficient for the convergence of the segmentation models in the analysis of each of the presented classes.
In the initial training phase, using a dataset annotated with all four classes (comprising 6,157 images), we achieved the highest DSC of 0.529 with the MA-Net model, which is relatively low. When analyzing the quality metrics for each class, which are presented in Table B1 in Appendix B, we found that the model accurately identified the Lumen class, but the Vasa vasorum class had a detection rate of less than 1 %. This experiment confirms our earlier hypothesis that the low result was due to the significant imbalance in the original dataset.
To address the imbalance issue, we conducted two additional series of model training on divided datasets, namely Dataset-2 and Dataset-3. The distribution of the number of objects and images in the datasets is reflected in Table A1 in Appendix A. As anticipated, this experiment yielded improved metrics for the Lumen, Fibrous cap, and Lipid core classes. The highest DSC on the test sample was 0.721, achieved by two architectures: DeepLabV3+ and PAN. On the training sample, the models’ performance achieved DSC values of 0.813 and 0.827, respectively. The best DSC for the Vasa vasorum class on the test sample was also 0.721, achieved by the MA-Net architecture. On the training sample, the DSC value reached 0.746. Detailed training results are available in Tables B2 and B3 in Appendix B.
Our study also highlights the similarities in model behavior during training. Fig. 2 shows the training dynamics of the models that achieved the best results on each dataset, illustrating convergence processes and changes in loss function and DSC over the testing iterations. Notably, the MA-Net architecture, when trained to segment the single Vasa vasorum class, as seen in Fig. 2 a , shows a longer convergence time compared to other solutions, but ultimately achieves the best result.
In addition to evaluating training dynamics, we assessed all models for qualitative metrics such as precision and recall, which guided the selection of the final architecture for the three-class cascade model. Both DeepLabV3+ and PAN achieved a DSC metric of 0.721. The PAN architecture showed a higher precision of 0.755 compared to 0.683 for DeepLabV3+, but it had a lower recall of 0.734 versus 0.849. Given the high precision and recall in these models, performance was the final deciding factor (see Table 2). The PAN model, with its superior precision and competitive recall, coupled with robust performance metrics, emerged as the optimal choice for our segmentation tasks.
Tab. 1. Model performance metrics on Dataset-2
|
Model |
DSC |
Precision |
Recall |
Parameters, M |
FLOPS, G |
|
DeepLabV3 |
0.699 |
0.665 |
0.813 |
39.6 |
164.1 |
|
DeepLabV3+ |
0.721 |
0.683 |
0.849 |
26.7 |
36.9 |
|
FPN |
0.652 |
0.754 |
0.635 |
26.1 |
31.4 |
|
LinkNet |
0.645 |
0.640 |
0.714 |
31.2 |
43.2 |
|
MA-Net |
0.676 |
0.656 |
0.792 |
147.4 |
74.8 |
|
PAN |
0.721 |
0.755 |
0.734 |
24.3 |
34.9 |
|
PSPNet |
0.664 |
0.776 |
0.634 |
24.3 |
11.8 |
|
U-Net |
0.701 |
0.701 |
0.811 |
32.5 |
42.8 |
|
U-Net++ |
0.714 |
0.731 |
0.772 |
49.0 |
230.3 |
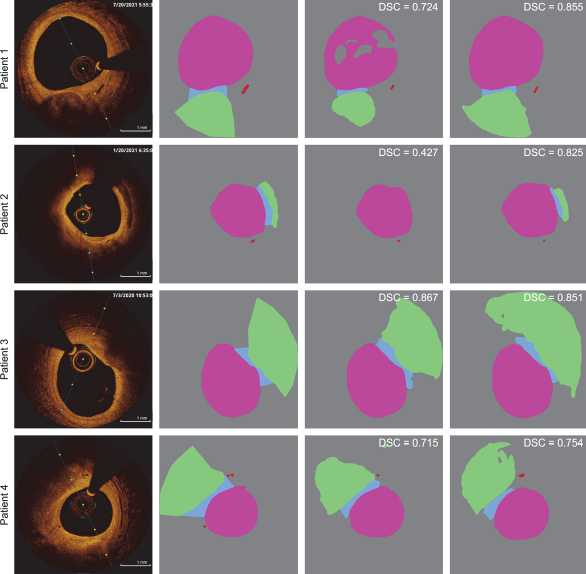
To visually evaluate the generalization ability of the semantic segmentation models, we compare their predictions in Fig. 3. The figure shows the results of two described approaches applied to the analysis of four patients from the test set. These images are considered standard references as they most accurately represent the analyzed objects. In three out of the four presented experiments, the superiority of using a cascade approach for analyzing coronary OCT images is demonstrated. Despite the lower metric obtained for the third patient, this approach shows a more positive trend in analysis. The resulting masks from this analysis are complete (without obvious gaps) and provide a more comprehensive representation of the analyzed objects. The reduction in quality metrics in this example is primarily due to the delineation of the lipid core boundaries. This class does not have a clear, well-defined contour and typically reflects only the adjacent boundary.
Discussion
Our approach to analyzing optical coherence tomography represents novel software that may improve clinical outcomes for patients undergoing coronary angiography procedures. To better evaluate the reliability of the results, we should distinguish two primary indicators: real-time operation of the algorithm and its high accuracy.
Theoretically, the performance of this software can be compared with the Intravascular Optical Coherence Tomography, Intravascular Ultrasound (IVUS), EROSION [23, 24]. However, this comparison cannot be made in a real clinical setting because these procedures are used for postoperative analysis rather than intraoperative imaging. Therefore, it is reasonable to discuss specific parameters that may prove its efficiency and safety. For instance, the frames-per-second indicator is critical for neural network software solutions but not for routine imaging modalities.
The main limitation of the methods mentioned above is the inability to accurately determine fibrous thicknesses less than 65 μm. Additionally, IVUS has limitations in visualizing thrombi, which can be recognized as fibrous caps. Visualization is also limited when the artery diameter is less than 1.5 mm or when pronounced calcinosis forms an acoustic shadow. Another important limitation is the difficulty of routine application in clinical practice [25]. Our imaging method does not have these disadvantages.
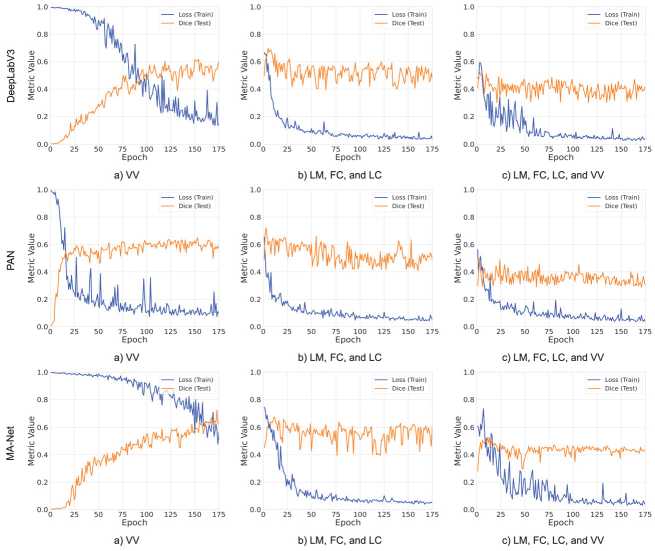
Fig. 2. Comparison of loss function and DSC dynamics of neural networks during training on different datasets
-
a) Source image b) Ground truth mask c) МА-Net mask d) PAN + МА-Net mask
Fig. 3. Comparison of two approaches in the analysis of OCT images from four patients. Column (a) contains the input images, while column (b) presents the expert annotations. Column (c) shows the results of semantic segmentation using the classical approach, which predicts all four analyzed classes with a single MA-Net model that achieved the highest score. Column (d) displays the results of the cascade approach, using PAN for the Lumen, Fibrous cap, and Lipid core classes, and MA-Net for the Vasa vasorum class
Conclusion
Our study demonstrated the feasibility of applying machine learning to the analysis of medical images, specifically coronary OCT images. The conducted analysis and training of neural network models for semantic segmentation confirmed the effectiveness of the chosen architectures in detecting significant, rupture-prone coronary lesions. An important outcome was the use of a cascade approach to data analysis due to the identified imbalance in class distribution.
Based on the conducted analysis, the combination of PAN and MA-Net models stands out as the most promising solution, achieving a final DSC score of 0.721, which is 0.192 higher than the score obtained using the standard multi-class semantic segmentation model.
The obtained data and developed analysis methodologies can be utilized to create more efficient diagnostic and monitoring systems for atherosclerosis, thereby improving the accuracy and reliability of medical research and practical applications in cardiology.
Acknowledgments
The study was supported by the Russian Science Foundation through grant № 23-75-10009, titled “Development of an automated system for detecting unstable plaques utilizing optical coherence tomography and deep learning methods”. Further details about the grant can be found at
