Unveiling the seasonal phytochemical richness and FT-IR profiling of Suaeda fruticosa and Suaeda nudiflora species from North Gujarat region

Author: Ankita Dharva, Bhoomi Joshi, Illa Patel
Journal: Журнал стресс-физиологии и биохимии @jspb
Article in issue: 1 т.22, 2026.
Free access
Halophytic plants serve as vital and essential sources of natural products for human health, possessing significant potential for the development of novel pharmaceuticals. Halophytes encounter severe heat and salinity stress, which stimulates the synthesis of secondary metabolites to mitigate the stress. Halophytes are distributed from coastal regions to desert regions throughout the world. This study commenced with the selection of two valuable edible halophytes: Suaeda fruticosa (Forssk. Ex. J. F. Gmel.) and Suaeda nudiflora (Willd.) Moq. belonging to the Amaranthaceae family and are extensively found in the North Gujarat regions, India. Phytochemical study of the stem and leaves components of both species during the summer and rainy seasons was conducted to analyse metabolites such as alkaloids, phenols, flavonoids, tannins, glycosides, saponins, steroids, coumarins, and terpenoids. Also investigate total phenolic, total flavonoid, total tannin, and total steroid contents along with spectrophotometric analysis. A comparative analysis of both species with seasonal change reveals differing quantities of phytochemical contents in their respective portions. During the summer season, both species exhibit a greater concentration of bioactive chemicals compared to the rainy season due to their ability to withstand elevated stress levels during this period. The primary phytochemical study indicates that nearly all groups are present in methanol, water, chloroform, and ethyl acetate in the leaves and stem sections of both species, with S. nudiflora exhibiting superior phytochemical content compared to S. fruticosa. The results based on FT-IR analysis revealed the presence of functional groups like alcohol, phenol, aliphatic, anhydrides, aromatics, amide, cyclic ether, saturated aliphatic lipids and aliphatic amines. Both Suaeda species are significant sources of many bioactive compounds, which can be utilised in the pharmaceutical sector and medication formulation.
Suaeda fruticosa, Suaeda nudiflora, Secondary metabolites, Phytochemical analysis, FT-IR
Short address: https://sciup.org/143185419
IDR: 143185419
Text of the scientific article Unveiling the seasonal phytochemical richness and FT-IR profiling of Suaeda fruticosa and Suaeda nudiflora species from North Gujarat region
Halophytes are crucial sources of natural products with significant potential for developing novel pharmaceuticals due to their ability to produce bioactive compounds under stress conditions (Mishra and Tanna, 2017). These unique plants thrive in saline environments and have evolved various mechanisms to cope with harsh conditions, making them a rich reservoir for discovering new therapeutic agents that could address unmet medical needs (Riadh et al., 2010). Research into halophytes has revealed a diverse array of secondary metabolites, including alkaloids, flavonoids, and terpenoids, which exhibit promising antimicrobial, antiinflammatory, and antioxidant properties (Ksouri et al., 2012). The exploration of these compounds not only enhances our understanding of plant resilience but also paves the way for innovative approaches in drug discovery and development, potentially leading to breakthrough treatments for various diseases. The potential applications of these bioactive compounds extend beyond medicine, as they may also play crucial roles in agriculture and environmental sustainability by promoting plant growth and improving soil health (Mohammed et al., 2023). Halophytic plants, such as Suaeda species, thrive in high-salinity environments by synthesizing stress-responsive metabolites, making them valuable for phytochemical and genetic studies. Suaeda fruticosa and Suaeda nudiflora , widely distributed in North Gujarat, India, produce bioactive compounds like alkaloids, phenols, flavonoids, and terpenoids under heat and salinity stress. Phytochemical analysis reveals seasonal variations, with higher metabolite concentrations during summer. Genetic studies on Suaeda highlight halophytic genes regulating stress tolerance and secondary metabolite production. These genes and phytochemicals hold promise for pharmaceutical applications, offering insights into stress adaptation and novel drug development. This study explores the interplay between halophytic genes and phytochemical profiles in Suaeda species.
Phytochemical Analysis
The study focuses on the phytochemical composition of stems and leaves of both species during summer and rainy seasons, analyzing metabolites such as alkaloids, phenols, flavonoids, tannins, glycosides, saponins, steroids, coumarins, and terpenoids (Grigore and Oprica, 2015) This comprehensive analysis aims to identify seasonal variations in the concentration of these metabolites, which can provide insights into their ecological significance and potential benefits for human health (Ksouri et al., 2012). Understanding these variations can lead to the discovery of optimal harvesting times and methods, ultimately enhancing the efficacy of these compounds in both therapeutic and agricultural applications (Ferreira et al., 2022). The findings of this research could also pave the way for further studies on the synergistic effects of these metabolites, potentially leading to innovative approaches in sustainable agriculture and natural medicine. Such insights may also contribute to the development of targeted strategies for conservation and cultivation, ensuring that these valuable resources are preserved while maximizing their beneficial properties. This holistic approach not only emphasizes the importance of biodiversity but also highlights the interconnectedness of ecosystems and human health, fostering a greater appreciation for the natural world (Custodio et al., 2022).
FT-IR is an extremely sensitive technique that has a number of benefits over other analytical techniques. This non-destructive method may identify functional groups, which gives information regarding chemical and structural changes in response to biotic or abiotic stress. The study of protein secondary structures in the 1800– 1500 cm1 spectrum range has made substantial use of this approach (Yang and Yen, 2002).
MATERIALS AND METHOD
Halophytic Suaeda species collection, authentication and drying of plant material
The proposed research work was carried out on the halophytic Suaeda species, collected from Koddha, Patan district and Nadabet, Banas kantha district, A little Rann of Kutch area of Gujarat state in India (Figure 1).
Suaeda species were collected in the months of March and April, 2023 summer season and September and October, 2023 rainy season. In summer season collected leaves and stem parts and in rainy season collected leaves, stem, flowers and root part. Plant authentication was done through Flora of Gujarat (Shah, 1978). Various parts were collected like stem, leaves, root and flowers. All the parts were washed thoroughly to clean the soil surround it with help of clean water and allow them to air dried. Dried parts grinder with mixer and make power and each sample was used for extract preparation.
Extract preparation
Solvent Water, Methanol, Chloroform and Ethyl acetate were used in proposition of 1:10 amount. Then these sets were kept on shaker for 24 hrs. After that all extracts were separately filtered with help of Whatman filter no.1 and used for further analysis.
Qualitative phytochemical analysis
The qualitative phytochemical analysis of various types of extracts was assessed using standard methodology (Sadasivam, 1996; Trease, 1989) and methods were presented in table.1.
FTIR analysis
The FTIR analysis was carried out to know the functional groups present in the methanolic extracts. The methanolic crude extracts of the selected brown algae were performed by Shimadzu 8400S FTIR spectrophotometer. The measurements were taken in an automatic recording FTIR spectrophotometer in the range of 4000 to 400cm-1. The FTIR signal area was recorded and compared with the standard peak value and interpreted the functional groups.
RESULTS AND DISCUSSION
Collection and identification of the sample
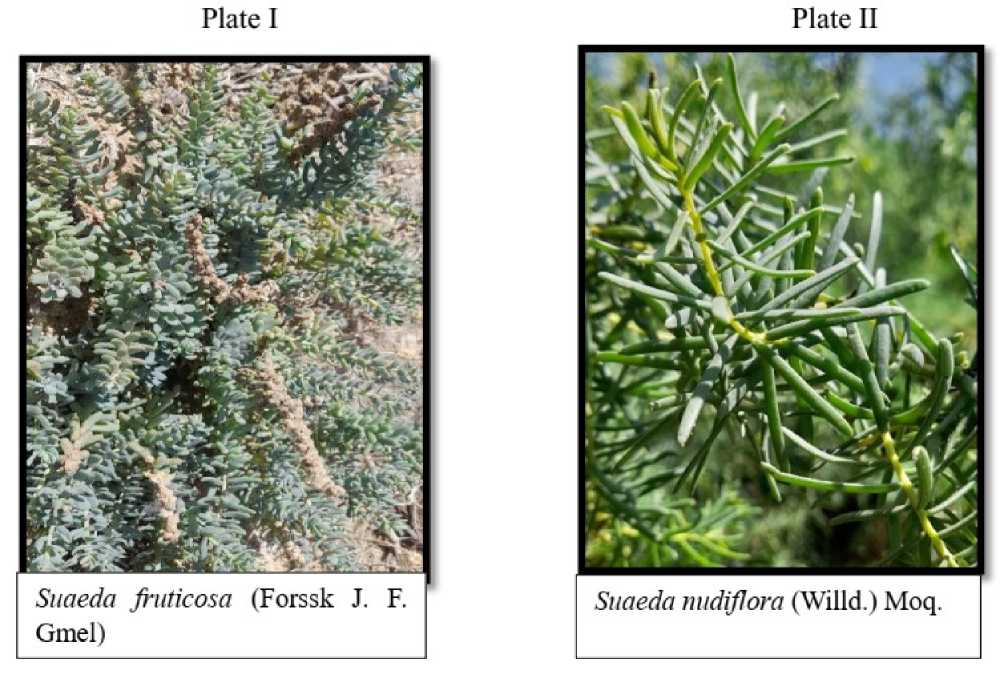
The survey reported two species of halophytic genus Suaeda : Suaeda fruticosa Forssk J. F. Gmel and Suaeda nudiflora (Willd.) Moq.
S. fruticosa Forssk J. F. Gmel
Erect or scattered, perennial herbs, extensively branched; branches 15-40 cm long, spreading. Stems somewhat woody at the base, herbaceous in upper parts, exhibiting a glabrous glaucous green coloration; younger sections are terete, pale, brown, leaves are sessile, about 0.6 to 1.5 cm in length. Linear oblong, obovate, base tapering, green to light green colour.
S. nudiflora (Willd.) Moq.
A woody, perennial herb about 25 to 30 cm in height; the stems are diffusely branched. Leaves measuring 0.6 to 1.8 cm; bracts are oblong, ellipsoid or linear obovate, obtuse at the apex, constricted at the base, rigid, subterete and glaucous green colouration.
Qualitative analysis
Qualitative analyses were performed through spot tests for confirmation of phytochemicals in different extracts of selected Suaeda species in methanol, water, chloroform and ethyl acetate extracts in leaves and stem parts of rainy season and summer seasons were used. The phytochemical analysis of various extracts of Suaeda species was demonstrated in Table no.3 Green color boxes indicated the existence of phytoconstituents in their respective parts whereas white boxes showed the absence of phytoconstituents in it. Species and parts wise results of qualitative phytochemicals were described below.
Suaeda fruticosa
As result, mentioned in table, presence of alkaloids in methanol and chloroform extracts of leaves and stem parts in summer and rainy seasons. The solvents such as methanol, water and chloroform extracts gave positive results for the flavonoid test in stem and leaves parts in both seasons. The steroid was presence in water and methanol extracts of all the parts in both seasons. Tannin showed its presence in summer and rainy seasons of leaves and stem parts in methanol, chloroform and water extracts. Coumarin was presence in methanol, water, chloroform and ethyl acetate extracts in all the parts of species. Saponin was presence in water, methanol and chloroform extracts of leaves and stem parts of rainy and summer seasons. Phenol showed their presence in methanol, water and ethyl acetate extracts of leaves and stem parts. Positive results were observed during terpenoid test in methanol, chloroform and water extracts of all the parts of species in both the seasons. Glycosides showed their presence in methanol and chloroform extracts of stem and leaves parts.
Suaeda nudiflora
As a result, alkaloid presence in methanol and chloroform extracts of stem and leave parts displayed a positive result in both seasons. The methanol, chloroform, and water extracts of all the parts gave positive results for the flavonoid test. The steroid was presence in methanol and water extracts of stem and leaves parts of both seasons. Tannin showed negative response in ethyl acetate extracts of leaves part. Coumarin was presence in all the extracts of all the parts. Saponin was presence in methanol, chloroform and water extracts of stem and leaves parts. Positive results were observed in methanol, chloroform and water extracts of leaves and stem. The methanol, water and chloroform extracts of stem and leaves parts showed the presence of terpenoid. Glycosides showed positive results in methanol and chloroform extracts of stem and leaves parts.
Quantitative analysis
The quantitative analysis of phytochemicals confirms the high source of phenol, flavonoid, tannin and sterol compounds. The quantitative phytochemical analysis of major bioactive compounds of selected Suaeda species in methanol, water, chloroform and ethyl acetate extracts in leaves and stem parts of rainy and summer seasons were used.
Standard curve of phenol using Gallic acid
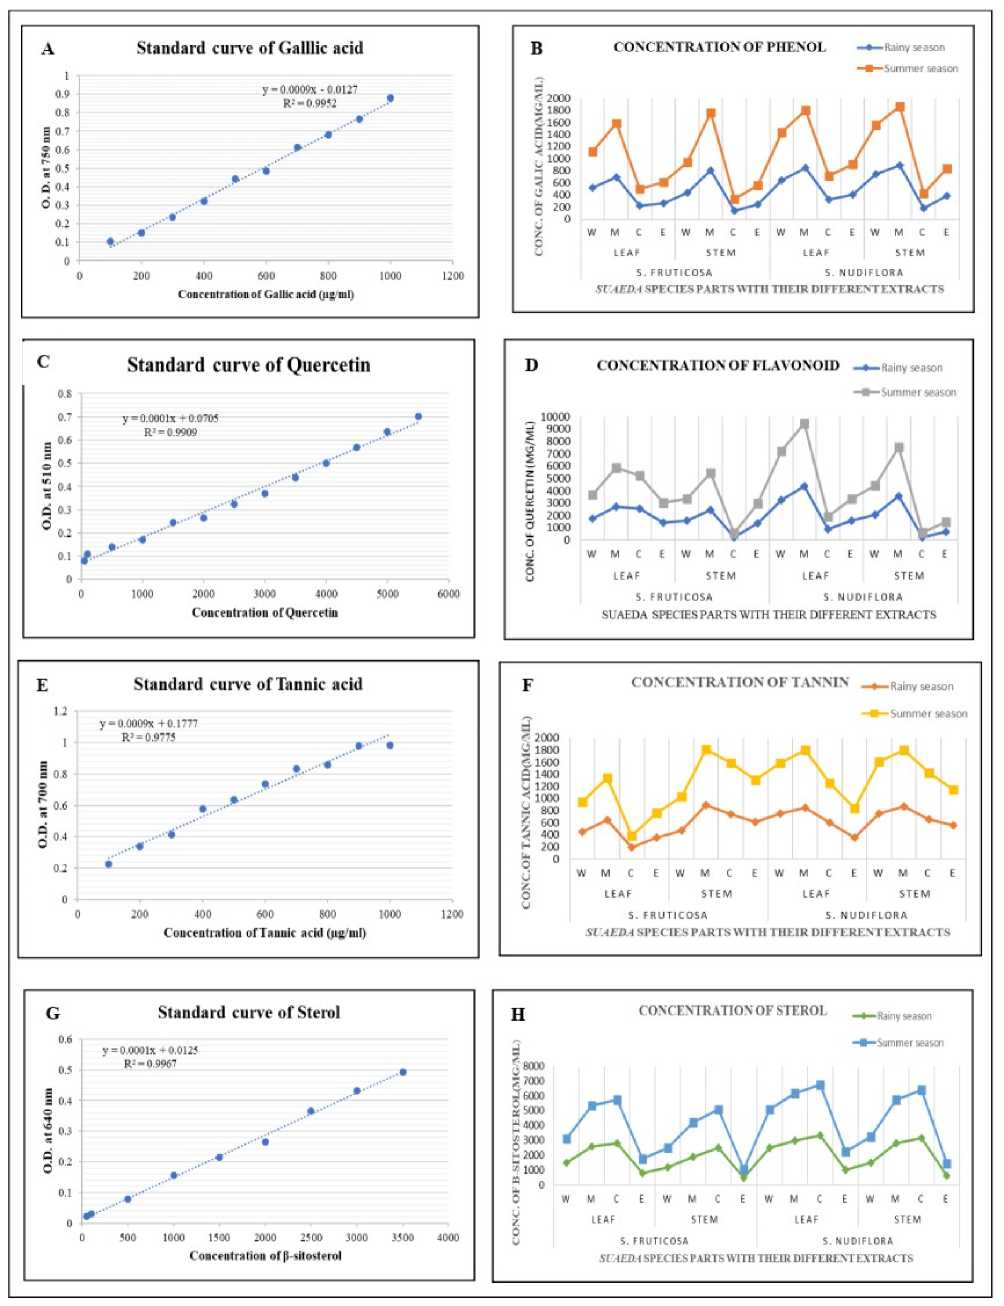
The calibration curve obtained by a series of different concentration of standard Gallic acid and standard curve equation was where y=0.0009x - 0.0127, R2 =0.9952 (Fig 3A) where y is absorbance at 750 nm and x is concentration of Gallic acid (µg/ml).
Total phenol content in different parts of Suaeda fruticosa and Suaeda nudiflora
Fig 3B showed an amount of phenolic content in different parts of S. fruticosa and S. nudiflora using different solvent. The result of phenolic content in different parts of S. fruticosa and S. nudiflora was as follow.
In leaf part of S. fruticosa the highest phenolic content was recorded in summer season methanolic extracts (925.22±1.14) followed by water (609.02±2.45),
Ethyl acetate (350.78±2.18) and chloroform (280.12±1.23) and in rainy season also highest in methanol (694.23±1.94), followed by water (560.22±2.54), ethyl acetate (262.74±3.14) and chloroform (224.62±1.28). In S. nudiflora leaf part the highest phenolic content was recorded in summer season methanolic extracts (960.2±1.08) followed by water (898.05±2.21), Ethyl acetate (501.36±1.45) and chloroform (415.26±3.12) and in rainy season also highest in methanol (947.09±1.02), followed by water (841.28±2.45), ethyl acetate (459.29±1.56) and chloroform (370.22±3.45).
In stem part of S. fruticosa the highest phenolic content was recorded in summer season methanolic extracts (960.31±3.42) followed by water (532.15±1.84), Ethyl acetate (321.05±2.01) and chloroform (205.45±2.65) and in rainy season also highest in methanol (907.64±1.14), followed by water (437.79±0.78), ethyl acetate (242.58±.94) and chloroform (135.54±1.25). In S. nudiflora stem part the highest phenolic content was recorded in summer season methanolic extracts (978.65±1.65) followed by water (915.12±1.75), Ethyl acetate (450.15±2.26) and chloroform (212.36±0.65) and in rainy season also highest in methanol (931.26±1.35), followed by water (847.17±2.42), ethyl acetate (390.77±0.45) and chloroform (180.59±1.56).
Total phenol content was recorded maximum in methanolic extract compared to other solvents. This data demonstrates that both two selected species were a valuable source of phenolic compounds and the maximum concentration recorded in S. nudiflora stem > S. nudiflora leaf > S. fruticosa stem > S. fruticosa leaf in summer season.
Standard curve of flavonoid using Quercetin
The calibration curve obtained by a series of different concentration of standard Quercetin and standard curve equation was where y=0.0001x + 0.0705, R2=0.9909 (Fig. 3C) where y is absorbance at 510 nm and x is concentration of Quercetin (µg/ml).
Total flavonoid content in different parts of Suaeda fruticosa and Suaeda nudiflora
Fig. 3D showed an amount of flavonoid content in different part of S. fruticosa and S. nudiflora using different solvent. The result of flavonoid content in different parts of S. fruticosa and S. nudiflora was as follow.
In leaf part of S. fruticosa the highest flavonoid content was recorded in summer season methanolic extracts (2902.36±1.26) followed by chloroform (2645.13±0.98), water (1845.65±1.45) and Ethyl acetate (1675.15±1.41) and in rainy season also highest in methanol (2703.29±0.75), followed by chloroform (2548.70±1.25), water (1765.12±0.87) and Ethyl acetate (1528.39±1.65). In S. nudiflora leaf part the highest flavonoid content was recorded in summer season methanolic extracts (5213.15±1.26) followed by water (4026.57±0.75), Ethyl acetate (1805.16±1.45) and chloroform (1065.47±2.15) and in rainy season also highest in methanol (4889.55±0.89), followed by water (3821.88±1.27), ethyl acetate (1672.69±0.90) and chloroform (885.97±0.81).
In stem part of S. fruticosa the highest flavonoid content was recorded in summer season methanolic extracts (3012.45±1.26) followed by, Ethyl acetate (1615.41±0.76), water (1560.36±1.75) and chloroform (350.79±1.56) and in rainy season also highest in methanol (2457.64±2.03), followed by ethyl acetate (1491.26±.96), water (1482.21±1.64) and chloroform (225.42±0.84). In S. nudiflora stem part the highest flavonoid content was recorded in summer season methanolic extracts (4031.45±0.87) followed by water (2250.65±1.95), Ethyl acetate (800.78±2.35) and chloroform (416.15±1.02) and in rainy season also highest in methanol (3558.18±0.67), followed by water (2159.34±1.78), ethyl acetate (678.48±2.18) and chloroform (239.47±1.84).
Total flavonoid content was recorded maximum in methanolic extract compared to other solvents. This data demonstrates that both two selected species were a valuable source of flavonoid compounds and the maximum concentration recorded in S. nudiflora leaf > S. nudiflora stem > S. fruticosa stem > S. fruticosa leaf in summer season.
Standard curve of tannin using Tannic acid
The calibration curve obtained by a series of different concentration of standard Tannic acid and standard curve equation was where y=0.0009x + 0.1777, R2= 0.9775 (Fig 3E) where y is absorbance at 510 nm and x is concentration of Tannic acid (µg/ml).
Total tannin content in different parts of Suaeda fruticosa and Suaeda nudiflora
Fig 3F showed an amount of tannin content in different part of S. fruticosa and S. nudiflora using different solvent. The result of tannin content in different parts of S. fruticosa and S. nudiflora was as follow.
In leaf part of S. fruticosa the highest tannin content was recorded in summer season methanolic extracts (708.47±2.03) followed by water (515.69±1.89), Ethyl acetate (400.08±1.41) and chloroform (214.15±0.80) in rainy season also highest in methanol (647.78±1.08), followed by water (450.48±1.05), Ethyl acetate (358.98±0.45) and chloroform (189.34±1.02), and. In S. nudiflora leaf part the highest tannin content was recorded in summer season methanolic extracts (958.02±0.45) followed by water (845.84±0.54), chloroform (657.75±1.05) and Ethyl acetate (487.11±.98) and in rainy season also highest in methanol (874.34±1.08), followed by water (748.71±2.05), chloroform (604.78±1.54) and ethyl acetate (350.19±2.26).
In stem part of S. fruticosa the highest tannin content was recorded in summer season methanolic extracts (925.45±1.26) followed by, chloroform (845.34±0.97), Ethyl acetate (706.48±1.06) and water (567.48±0.78) and in rainy season also highest in methanol (890.97±1.11), followed by chloroform (749.19±0.64), ethyl acetate (609.25±0.39), water (461.17±0.75). In S. nudiflora stem part the highest tannin content was recorded in summer season methanolic extracts (938.18±0.82) followed by water (859.15±2.11), chloroform (777.06±2.46) and Ethyl acetate (596.72±0.98) and in rainy season also highest in methanol (869.38±0.71), followed by water (754.09±1.15), chloroform (655.02±1.05) and ethyl acetate (548.17±0.79).
Total tannin content was recorded maximum in methanolic extract compared to other solvents. This data demonstrates that both two selected species were a valuable source of tannin compounds and the maximum concentration recorded in S. nudiflora leaf > S. nudiflora stem > S. fruticosa stem > S. fruticosa leaf in summer season.
Standard curve of sterol using β-sitosterol
The calibration curve obtained by a series of different concentration of standard β-sitosterol and standard curve equation was where y=0.0001x + 0.0125, R2= 0.9967 (Fig 3G) where y is absorbance at 510 nm and x is concentration of β-sitosterol (µg/ml).
Total sterol content in different parts of Suaeda fruticosa and Suaeda nudiflora
Fig 3H showed an amount of sterol content in different part of S. fruticosa and S. nudiflora using different solvent. The result of sterol content in different parts of S. fruticosa and S. nudiflora was as follow.
In leaf part of S. fruticosa the highest sterol content was recorded in summer season chloroform extracts (2932.59±1.38) followed by methanol (2750.26±1.19), water (1624.19±0.73) and Ethyl acetate (958.19±0.79) and in rainy season also highest in chloroform (2897.12±0.89), followed by methanol (2648.05±1.05), water (1548.87±0.24) and Ethyl acetate (906.26±1.27). In S. nudiflora leaf part the highest sterol content was recorded in summer season chloroform extracts (3402.09±0.38) followed by methanol (3215.61±0.79), water (2512.17±0.19), and Ethyl acetate (1165.36±1.95) and in rainy season also highest in chloroform (3348.11±0.68), followed by methanol (3164.65±0.20), water (2741.75±1.47), ethyl acetate (1034.16±1.65).
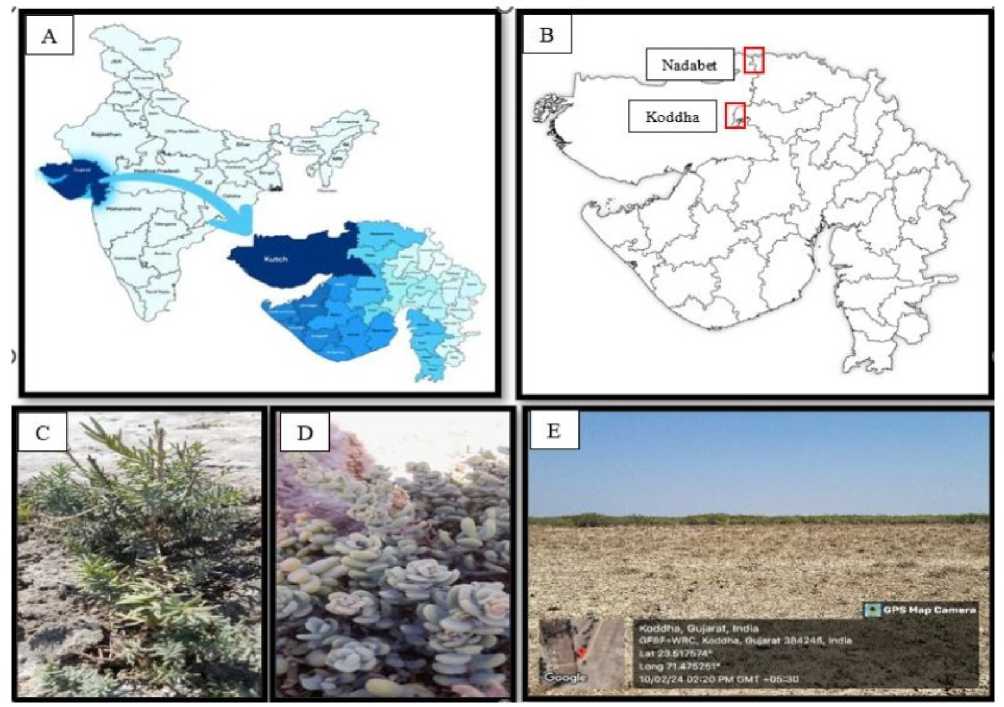
Figure 1. A. A map of India B . Study area Koddha and Nadabet in Gujarat state C . Suaeda nudiflora D . Suaeda fruticosa
E . Koddha area of North Gujarat
Suaeda midiflora (Willd.) Moq.
Plate II
Plate I
Suaeda fruticosa (Forssk J. F. Gmel)
Figure 2. Plate I. Suaeda fruticosa ; Plate II Suaeda nudiflora
Table 1: Various qualitative phytochemical analysis for the presence of phytochemicals
|
Phytoconstituents |
Test |
Observation |
|
Alkaloids |
Mayer’s Test (1ml extract + 2ml Mayer’s reagent) |
Dull white precipitate Orange-red precipitate |
|
Flavonoid |
Alkaline Reagent Test (few ml extract + few drops of NaOH + dil. HCL |
Yellow color formation |
|
Phenol |
Ferric chloride Test (few ml of extract + 5ml distilled water + few drops of 5% ferric chloride solution) |
Blue-green coloration |
|
Tannin |
Lead acetate Test (few ml extract + 3ml 10% Lead acetate soln.) |
Bulky white precipitate |
|
Saponin |
Frothing Test (few ml extract + 5ml distilled water + shake for 5 min. |
Formation of foam |
|
Steroid |
Liebermann Buchard Test (few ml extract + few drops of acetic anhydride. Boil + cool + add conc. Sulphuric acid. |
Brown-ring formed |
|
Glycosides |
Keller-Kiliani Test (few ml extract + 5 ml water + glacial acetic acid + 1 drop of 5% ferric chloride soln. + conc. sulphuric acid) |
Reddish brown ring, violet ring below brown ring or green ring below red ring. |
|
Coumarin |
1 ml extract + 1 ml 10% Sodium hydroxide |
Yellow colour formation |
|
Terpenoid |
1 ml extract+ 4 ml chloroform+ 0.5 ml sulphuric acid |
Reddish brown colour formation |
Table 2: Standard method for quantitative analysis of secondary metabolites
|
Quantitative analysis |
Standard |
Procedure |
References |
|
Total phenol |
Gallic acid (100-1200 μg/ml) |
Different conc. of standard and 1 ml of sample, making up a total volume of 5 ml, 0.5 ml Folin and 0.5 ml sodium bicarbonate (10%), after development of blue colour measuring optical density at 765 nm |
(Singleton and Rossi, 1965) |
|
Total flavonoid |
Quercetin (100-6000 μg/ml) |
Different conc. of standard and 1 ml of sample, 0.3 ml aluminium chloride (5%), 0.3 ml sodium nitrate (10%), 2 ml sodium hydroxide after development of blue colour measuring optical density at 510 nm |
(Chang et al., 2002) |
|
Total tannin |
Tannic acid (100- 1200 μg/ml) |
Different conc. of standard and 1 ml of sample, making up total volume 7 ml, 0.5 ml Folin and 1 ml sodium bicarbonate (20%) after development of blue colour measuring optical density at 700 nm |
(Polshettiwar et al., 2007) |
|
Total sterol |
β-sitosterol (100- 4000 μg/ml) |
Different conc. of standard and 1 ml of sample, 4 ml chloroform, 2 ml Liebermann Burchard reagent, incubate for 15 in dark, after development of green colour measuring optical density at 640 nm |
(Sabir et al., 2013) |
Table 3: Qualitative phytochemical analysis of two species of Suaeda
|
Name of plants |
Seasons |
Plant parts |
Extracts types |
Name of secondar |
metabolites |
|||||||
|
2 'о ns < |
2 о LL |
2 'о Ф 35 |
с н |
с о О |
с о о. nS ел |
о с ф 0- |
2 о с ф о. н |
ф ■О '(Л о о о |
||||
|
ns о и ■§ ф ns сл |
Rainy |
Leaves |
Water |
|||||||||
|
Methanol |
||||||||||||
|
Chloroform |
||||||||||||
|
Ethyl acetate |
||||||||||||
|
Stem |
Water |
|||||||||||
|
Methanol |
||||||||||||
|
Chloroform |
||||||||||||
|
Ethyl acetate |
||||||||||||
|
Summer |
Leaves |
Water |
||||||||||
|
Methanol |
||||||||||||
|
Chloroform |
||||||||||||
|
Ethyl acetate |
||||||||||||
|
Stem |
Water |
|||||||||||
|
Methanol |
||||||||||||
|
Chloroform |
||||||||||||
|
Ethyl acetate |
||||||||||||
|
£ о с ■8 ф ns С/} |
Rainy |
Leaves |
Water |
|||||||||
|
Methanol |
||||||||||||
|
Chloroform |
||||||||||||
|
Ethyl acetate |
||||||||||||
|
Stem |
Water |
|||||||||||
|
Methanol |
||||||||||||
|
Chloroform |
||||||||||||
|
Ethyl acetate |
||||||||||||
|
Summer |
Leaves |
Water |
||||||||||
|
Methanol |
||||||||||||
|
Chloroform |
||||||||||||
|
Ethyl acetate |
||||||||||||
|
Stem |
Water |
|||||||||||
|
Methanol |
||||||||||||
|
Chloroform |
||||||||||||
|
Ethyl acetate |
||||||||||||
Note: colour Present, White colour Absent
Standard curve of Galllic acid
CONCENTRATION OF PHENOL
Rainy season
E
0.7
( oacrntrition of GaINf acid (pg ml)
Standard curve of Quercetin
CONCENTRATION OE FLAVONOID
Rainy season
—•— Summer season
GJ
LEAF
STEM
LEAF
STEM
S. F RUT I COSA
S. NUDIFLORA
Concentration of Quercetin
SUAEDA SPECIES PARTS WITH THEIR DIFFERENT EXTRACTS
Standard curve of Tannic acid
CONCENTRATION OF TANNIN
Rainy season
- Summer season
О
LEAF
STEM
LEAF
STEM
Concentration of Tannic ackKyg'ml)
SI AEDA SPECIES PARTS WITH THEIR DIFFERENT EXTRACTS
Standard curve of Sterol
CONCENTRATION OF STEROL
■Rainy season
-^—Summer season
0J
Й
LEAF
STEM
LEAF
STEM
ST JED 4 SPECIES PARTS WITH THEIR DIFFERENT EXTRACTS
Й
1400 1200 1000
800 600
400 200
200 0
C c
9000 8000
7000 6000 5000 4000
3000 2000 1000
* 2000 2 1800 C1600
3 < 2000 x 1800 01600
9 a у = O.OOOlx + 0.0125 R--0 9967
W M
W M y-0.0009x +0.17 77 ' R’ = 0.9775
W M
W M
W M
S. FRUTICOSA S. NUDIFLORA
П 4KD4 SPECIES PARTS WITH THEIR DIFFERENT EXTRACTS
W M у = 0.000 lx -0.0’05 RJ = 0.9909
W M
W M
05 0.4
500 1000 1500 2000 2500 3000 3500 4000
Concentration of |L sitosterol
JZ8O0O 57000
J 6000 «5000 «4000
£ 3000 §2000 " 1000
у - 0.O0O9X - 0 012’ R--0 9952
Figure 3. Quantitative analysis data
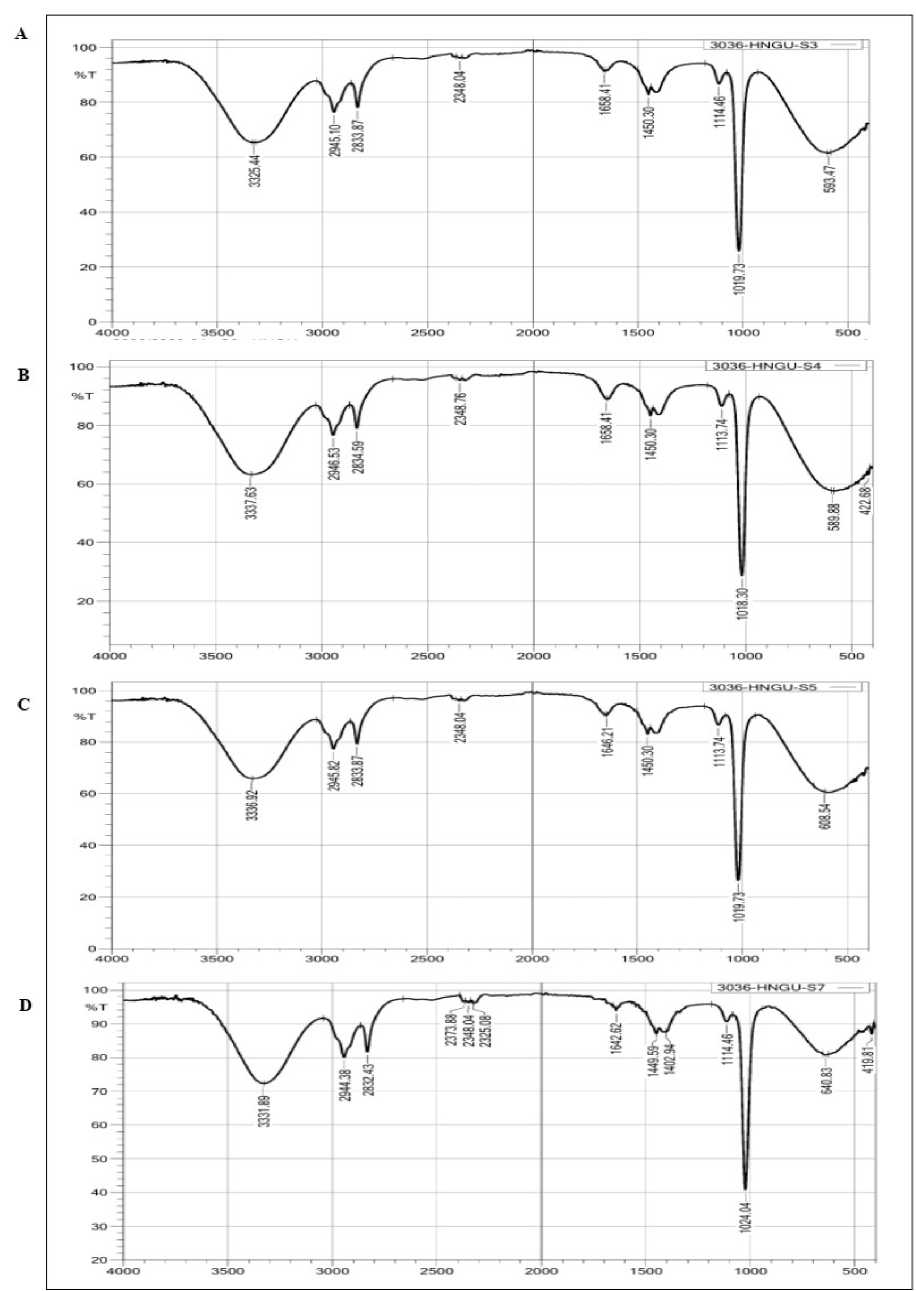
Figure 4. FTIR analysis of both Suaeda species leaves and stem parts. A- S. fruticosa leaf, B- S. fruticosa stem, C- S.
nudiflora leaf, D- S. nudiflora stem
Table 4: FTIR wavelengths and peaks of IR spectrum
|
A. |
B |
C |
D |
||||||||
|
Peak value (cm-1) |
Functional compound class |
Functional group |
Peak value (cm-1) |
Functional compound class |
Functional group |
Peak value (cm-1) |
Functional compound class |
Functional group |
Peak value (cm-1) |
Functional compound class |
Functional group |
|
593.47 |
Phthalimide |
MgO/Mg OH octahedral layer |
422.68 |
Phthalimide |
MgO/Mg OH octahedral layer |
608.54 |
Phthalimide |
MgO/Mg OH octahedral layer |
419.81 |
Phthalimide |
MgO/Mg OH octahedral layer |
|
1019.73 |
Si-O tetrahedral layer |
589.88 |
Phthalimide |
MgO/Mg OH octahedral layer |
1019.73 |
Si-O tetrahedral layer |
640.83 |
Phthalimide |
MgO/Mg OH octahedral layer |
||
|
1114.46 |
Cycli ether |
C-H stretching, polymeric OH |
1018.30 |
Si-O tetrahedral layer |
1113.74 |
Cycli ether |
C-H stretching, polymeric OH |
1024.04 |
Si-O tetrahedral layer |
||
|
1450.30 |
Aromatic ring |
C=C-C aromatic ring stretching O-H |
1113.74 |
Cycli ether |
C-H stretching, polymeric OH |
1450.30 |
Aromatic ring |
C=C-C aromatic ring stretching O-H |
1114.46 |
Cycli ether |
C-H stretching, polymeric OH |
|
1658.41 |
Amide |
C=O Stretch |
1450.30 |
Aromatic ring |
C=C-C aromatic ring stretching O-H |
1646.21 |
Amide |
C=O Stretch |
1402.94 |
Phenol or tertiary alcohol |
O-H band alcoholic |
|
2348.04 |
Cycli ether |
C-H stretching |
1658.41 |
Amide |
C=O Stretch |
2348.04 |
Cycli ether |
C-H stretching |
1449.59 |
Aromatic ring |
C=C-C aromatic ring stretching O-H |
|
2833.87 |
Cycli ether |
C-H stretching |
2348.76 |
Cycli ether |
C-H stretching |
2833.87 |
Terpenes |
C=O, C-H, C=C |
1642.62 |
Amide |
C=O Stretch |
|
2945.10 |
Saturated aliphatic compound Lipids |
Asymmetric stretching of -CH(CH 2 ) vibration |
2834.59 |
Terpenes |
C=O, C-H, C=C |
2945.82 |
Saturated aliphatic compound Lipids |
Asymmetric stretching of -CH(CH 2 ) vibration |
2325.08 |
Carboxylic acid |
O-H stretching, acidic |
|
3325.44 |
Amide |
N-H band |
2946.53 |
Saturated aliphatic compound Lipids |
Asymmetric stretching of -CH(CH 2 ) vibration |
3336.92 |
Amide |
N-H band |
2348.04 |
Cycli ether |
C-H stretching |
|
3337.63 |
Amide |
N-H band |
2373.88 |
Carboxylic acid |
O-H stretching, acidic |
||||||
|
2832.43 |
Terpenes |
C=O, C-H, C=C |
|||||||||
|
2944.38 |
Saturated aliphatic compound Lipids |
Asymmetric stretching of -CH(CH 2 ) vibration |
|||||||||
|
3331.89 |
Amide |
N-H band |
In stem part of S. fruticosa the highest sterol content was recorded in summer season chloroform extracts (2631.35±1.15) followed by methanol (2043.19±0.58), water (1325.18±1.08) and Ethyl acetate (556.05±0.48) and in rainy season also highest in chloroform extracts (2501.84±0.97) followed by methanol (2140.14±0.64), water (1206.18±0.84) and Ethyl acetate (502.34±1.28). In S. nudiflora stem part the highest sterol content was recorded in summer season chloroform extracts (3251.81±0.86) followed by methanol (2857.07±0.6), water (1604.45±0.67), and Ethyl acetate (852.34±2.26) and in rainy season also highest in chloroform extracts
(3164.38±1.14) followed by methanol (2798.84±0.90), water (1548.05±1.24), and Ethyl acetate (803.36±1.09).
Total sterol content was recorded maximum in methanolic extract compared to other solvents. This data demonstrates that both two selected species were a valuable source of sterol compounds and the maximum concentration recorded in S. nudiflora leaf > S. nudiflora stem > S. fruticosa leaf > S. fruticosa stem in summer season.
FTIR analysis
The FTIR spectrum of methanolic extract of S. fruticosa and S. nudiflora leaf and stem parts showed different peaks at different wavelengths, it was confirmed the presence of functional groups such as alcohol and phenol (O-H stretching for H-bonded), C-H stretching for aliphatic, anhydrides (C=O stretching), Aromatics (C-C stretching), Aliphatic amines (C-N stretching), Aliphatic amines (C-N stretching for), Alkyne (C-H stretching), carboxylic acid (O-H stretching), saturated aliphatic compound lipids (asymmetric stretching of CH(CH 2 ) vibration (Fig 4 and Table 4). By applying the FT-IR spectrum, work fortified the functional components present in the Suaeda species extracts.
DISCUSSION
Significant changes in biochemical characteristics among the Suaeda species were evident; however, there was no notable variation in the biochemical parameters among different species. Qualitative phytochemical research revealed that two Suaeda species are rich in almost all the bioactive compounds, like phenol, flavonoid, saponin, tannin, terpenoid, steroid, alkaloid, glycoside, and coumarin. The leaves and stems of S. fruticosa and S. nudiflora species exhibited bioactive compounds in the majority of methanol and chloroform extracts. The qualitative phytochemical study indicates that the maximum phytoconstituents was present in methanol, followed by chloroform, water, and ethyl acetate extracts. The present analysis confirmed prior research (Suthar and Solanki, 2022; Vanga and Peddinti, 2014), which demonstrated the presence of phytoconstituents.
The spectrophotometric quantitative analysis of both Suaeda species was conducted by measuring total phenolic content, total flavonoid content, total tannin content, and total sterol content over both seasons. The values of phenolic, flavonoid, and tannin content were highest in the methanolic extract compared to other solvents. The results indicates that both selected species were valuable source of all bioactive compounds, with the greatest concentrations. During summer season, S. fruticosa exhibit a greater concentration of phenol in the leaves at 925.22±1.14 μg/ml and in the stem at 958.31±3.42 μg/ml compared to the rainy season, where the leaves concentration is 694.23±1.94 μg/ml and stem concentration is 907.64±1.14 μg/ml. The total phenolic content was elevated in comparison to previous work on the S. fruticosa leaves from the coastal region of Pakistan (Qasim et al., 2017). In the summer season, S. nudiflora has a highest concentration of 960.2±1.08 μg/ml in leaves and 978.65±1.65 μg/ml in stem compared to the rainy season, where leaves measure 947.09±1.02 μg/ml and stem 931.26±1.35 μg/ml.
The flavonoid concentration in S. fruticosa is greater in the leaves 2902.36±1.26 μg/ml and stems 3012.45±1.26 μg/ml during the summer season compared to those in leaves 2703.29±0.75 μg/ml and stem 2457.64±2.03 μg/ml of rainy season. S. nudiflora also exhibit higher concentration in the leaves 5213.15±1.26 μg/ml and stem 4031.45±0.87 μg/ml during the summer season compared to those in wet season, where the concentrations are lower in the leaves 4889.55±0.89 μg/ml and stem 3558.18±0.67 μg/ml. Current research work and prior studies indicate variability in total phenolic and flavonoid content within the S. nudiflora species from Andhra Pradesh, India (Vanga and Peddinti, 2014).
The tannin concentration data demonstrates higher levels in summer for S. fruticosa, with leaves at 708.47±2.03 μg/ml and stem 925.45±1.26 μg/ml, compared to lower concentrations during the rainy seasons, with leaves at 647.78±1.08 μg/ml and stem at 890.97±1.11 μg/ml. S. nudiflora reveals the maximum concentrations in the leaves at 958.02±0.45 μg/ml and stem at 938.18±0.82 μg/ml during the summer seasons, while the lowest concentrations observed during the rainy seasons, with leaves at 874.34±1.08 μg/ml and stem at 869.38±0.71 μg/ml.
The values of sterol content were highest in the chloroform extract followed by methanolic extract compared to other solvents. The data on sterol quantities are elevated in the leaves at 2932.59±1.38 μg/ml and the stem at 2631.35±1.15 μg/ml of S. fruticosa throughout summer, whereas diminished levels are observed in the leaves at 2897.12±0.89 μg/ml and in the stem at 2501.84±0.97 μg/ml during the rainy seasons. S. nudiflora shows greater concentration in the leaves at 3402.09±0.38 μg/ml and in the stem at 3251.81±0.86 μg/ml during the summer season, in contrast to the leaves at 3348.11±0.68 μg/ml and stem at 3348.11±0.68 μg/ml during the rainy seasons. The molecular structure of the various functional groups contained in the methanolic extract of S. fruticosa and S. nudiflora were determined by FT-IR. The spectrum of FTIR analysis showed characteristic absorbance bands and confirmed the presence of alcohol and phenol, carboxylic acid, aliphatic amines (C-N stretching) and amide groups. In stress biology, FT-IR is becoming a more rapid and sensitive technique for assessing stress reactions.
CONCLUSION
The present investigation has demonstrated the seasonal variation in the qualitative and quantitative phytochemical analysis of the species S. fruticosa and S. nudiflora. All extracts from both Suaeda species exhibited the presence of various phytoconstituents, including phenols, flavonoids, tannins, sterols, saponins, coumarins, terpenoids, alkaloids, and glycosides. Methanolic and chloroform extracts shown majority of bioactive compounds in both species. The quantification of total phenol, total flavonoid, total tannin, and total sterol content indicates highest concentration in the leaves and stems of both Suaeda species. During seasonal variations, plants develop increased phytoconstituents as a defense mechanism to resist high-stress condition in summer. The plant parts during summer season revealed a greater concentration compared to those in the rainy season. According to this study, S. nudiflora possesses greater bioactive compounds relative to S. fruticosa. FTIR analysis is an effective approach for investigating functional groups, since it facilitates the identification of the chemical makeup of groups present in plant samples. The extensive array of potential bioactivities of plant-derived bioactive chemicals presents several business prospects across diverse sectors and therapeutic domains. Both Suaeda species are valuable sources of several bioactive phytoconstituents, applicable in the pharmaceutical sector and drug formulation.
ACKNOWLEDGMENTS
We are extremely thankful of the fellowship provided by the CSIR Research Council. Additionally, we are grateful to my research guide, Dr. I.C. Patel, for his informative feedback on the article.
CONFLICTS OF INTEREST
The authors declares that they have no potential conflicts of interest.
