Use of the cluster analysis and artificial neural network technology for log data interpretation

Author: Chashkov Anatoly V., Kiselev Valery M.
Journal: Журнал Сибирского федерального университета. Серия: Техника и технологии @technologies-sfu
Article in issue: 4 т.4, 2011.
Free access
Methods of the cluster analysis and artificial neural networks implemented in Schlumberger Techlog software modules were used for processing and interpretation of data on wells from the Verkhnechonskoe Oil and Gas Condensate Field. It was demonstrated that clusterization of data allows for significant improvement in reliability and accuracy of lithotype determinations as well as porosity and permeability of rocks.
Cluster analysis, artificial neural networks, well logging, lithotypes, porosity, permeability
Short address: https://sciup.org/146114600
IDR: 146114600 | UDC: 550.832
Использование кластерного анализа и аппарата искусственных нейронных сетей при интерпретации данных геофизических исследований скважин
Методы кластерного анализа и искусственных нейронных сетей, реализованные в модулях программного комплекса Techlog компании Schlumberger, использованы для обработки и интерпретации данных по скважинам одного из объектов Верхнечонского нефтегазового месторождения. Показано, что кластеризация данных позволяет заметно повысить надежность и достоверность определения литотипов, а также пористости и проницаемости пород.
Text of the scientific article Use of the cluster analysis and artificial neural network technology for log data interpretation
The following assumptions shall be taken into account for justification and development of a technique for well logging interpretation for reservoir delineation, assessment of saturation mode, and determination of reservoir properties. Firstly, the developed technique shall allow for the completeness, self-descriptiveness, and quality of a standard logging suite conducted in the present field. Secondly, it is essential to know the reservoir model, i.e. the type of the reservoir, its pore geometry, material composition, the structure of skeletal and cementing parts, variation range of the main reservoir properties, etc. (Dobrynin et al., 2004; Latysheva et al., 1986). Such data are obtained as a result of the lab core analysis. On the basis of these data main petrophysical relations and boundary values of the reservoir properties are established (Vendelshtein et al., 1978; Dobrynin et al., 2004).
Permeability index K perm is one of the most important reservoir properties in productive formations. It can be determined either based on a core analysis made in laboratory conditions, or as a result of well tests. If such techniques fail to cover the depth of the productive stratum (or horizon), then log data are used to determine the porosity index K por . Functional relation Kperm = f(Kpor) is revealed based on the available lab core analysis data.
When a productive horizon has complex and inhomogeneous geology, it is reasonable to start from splitting log and core data into main typical classes and establish petrophysical relations for each individual class (Itenberg et al., 1984; Lider et al., 1986). This task can only be solved using the cluster analysis methods (Pospelov, 1988).
One of productive terrigenous horizons of the Verkhnechonskoe Field in East Siberia was reviewed as a target of research. This geological object has a complex structure due to severe salinization and anhydritization of productive strata and presence of tectonic dislocations which split the geological structure in a large number of blocks. Moreover, there is a high degree of variability in the thickness of productive strata and presence of extensive areas of reservoir substitution with impermeable rocks. All this lead to a number of problems related to determination of the in-place permeability by using traditional methods of log and core data interpretation. Such problems can be basically solved by using cluster analysis technique.
Preparation and preliminary processing of log data were carried out in Schlumberger Techlog software for core and log data processing. Log data from one of the productive horizons of the Verkhnechonskoe Field were processed pointwise. Processing included the following stages:
– uploading of log data;
– correlation of curves and 'joining' them in isolation intervals when necessary;
– entering the data stratigraphic arrangements, directional survey data, core analysis data, and well test results in the Techlog data base;
– setting up the processing flow for the parameters of the estimated target (entering of interpretation algorithms, petrophysical relations, criteria, etc.);
– lithological heterogeneity of the cross-section;
– removal of reference values for normalization of acoustic logging (AL), gamma-ray logging (GR), neutron gamma-ray logging (NGL), bulk density logging (DL) and potassium concentration (P);
– identification of thickness value based on logging data (general, effective, and effective and oil and gas saturated);
– determination of porosity and permeability based on logging data;
– comparison of acquired results with coring data.
2. Classification of Rocks through Cluster Analysis
The data on more than 100 wells that penetrated one of the productive horizons of the Verkhnechonskoe Field were used in our investigation.
Cluster analysis is the process of splitting certain sample objects into subsets called clusters in such a way that each cluster would consist of similar objects, whereas objects from different clusters would be considerably different. The task of making clusters pertains to statistic data processing (Pospelov, 1988; Jain Anil et al., 1996). Regardless of the object under study, application of cluster analysis implies the stages as follow (Kohonen, 1982):
-
– selection of samples for clusterization;
-
– determination of range of variables that will be used for evaluation of sample objects;
-
– calculation of values of certain similarity between the objects;
-
– splitting of the sample to a certain number of clusters;
-
– verification of clusterization results.
A sample set of around 104 points in 5D space with coordinates associated with AL, GR, NGL, DL, and P was selected for study.
Requirements to input data for cluster analysis were consolidated in (Pospelov, 1988; Parsaye, 1998). First, input data must be non-dimensional and have no runouts. It can be easily achieved through preliminary simple processing of input data. Second, sets of input data must be uncorrelated and their distribution must comply with normal distribution law at least approximately. Checking if the data meet these requirements has to be done in practice.
Cluster analysis method is effective enough, since being an analytical method it has no subjective judgement associated with visual analysis of graphic objects (Pospelov, 1988; Parsaye, 1998; Jain Anil et al., 1996; Kohonen, 1982). Dozens of various clusterization algorithms have been proposed lately, but all of them produce almost identical results. Hence, there is no basis for favouring certain method (Herrick et al., 1998; Naeeni et al., 2010; Nashawi et al., 2010; Rezazadeh et al., 2010).
In the present study, classes of rocks were identified using the so-called «method of K-average» (Pospelov, 1988) which was implemented in Ipsom module of Techlog software for core and log data processing. Algorithm of this method implies splitting of a set of elements in vector space into a predetermined number K of clusters so that variability inside clusters can be minimized and distance between clusters can be maximized.
At the first stage of algorithm, each element x i of a set is assigned random probability P ij , which shows that this element belongs to j cluster (j = 1,2, …K). At the second stage, centres of mass for each cluster are calculated, x
^i = Z P'^ ‘X|" i where Q - factor that enhances scores of points found near the centres of mass. For our calculations we accepted Q = 1,2. Then, re-calculation of probability was conducted from equation
V /rim\Q-1
r nm
=Hd i where Pnm probability of the fact that element Xn belongs to cluster number m, и и rim = llxi M-mIL rnm = llxn Mm II.
If calculated probabilities do not coincide with the previous ones, they are used for identification of new centres of mass until this iterative process provides convergence.
This algorithm uses the number of clusters as an input parameter. In order to determine the optimum number of clusters, it is required to use the information which is prior to the input data. In our case input data were represented by vectors with coordinates that correspond to adjusted results of AL, GR, NGL, DL and P. Prior information was represented by seven lithotypes identified upon core tests for 4 wells of the Verkhnechonskoe Field with 100 % core recovery in the interval of horizon under study. In 2009-2010, Specialists of Department for Core and Formation Fluid Storage and Study of Tyumen Oil Research Institute conducted detailed sedimentological cores studies with identification of rocks that have similar petrophysical parameters.
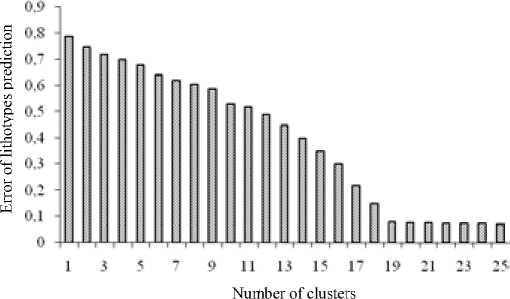
Fig. 1 Error of lithotypes prediction depending on the number of clusters
There were determined normalized errors of lithotype forecast b ed on log data for various numbers of clusters. The result is shown in Figure 1 that makes it obviou hat when number of clusters exceeds 19, forecast error does not decrease significantly. Using less t n 19 clusters may result in insufficient compartmentalization of a section for log data versus core ata, cases when the number of clusters exceeds 19 are likely to account technical logging feature rather than geological and geophysical properties of formation.
3. Result of Cluster Analysis and Application of Neu l Network
In other wells of the Verkhnechonskoe Field that were drilled wit core extraction but without sedimentological analysis, splitting rocks into clusters based on log data s conducted using Artificial Neural Network Unit. During the study neural network can identify complex relationships between input data and output data as well as can make synthesis. It means that in case of successful training, network can generate correct result on the basis of the data that were missing in the training sample as well as incomplete and/or noisy, partially corrupted data (Herrick et al., 1998; Naeeni et al., 2010; Nashawi et al., 2010; Rezazadeh et al., 2010).
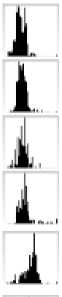
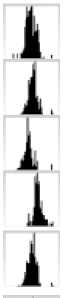
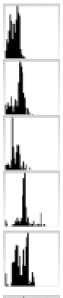
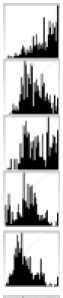
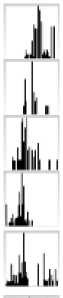
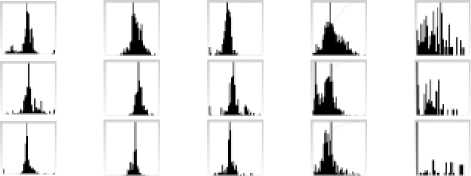
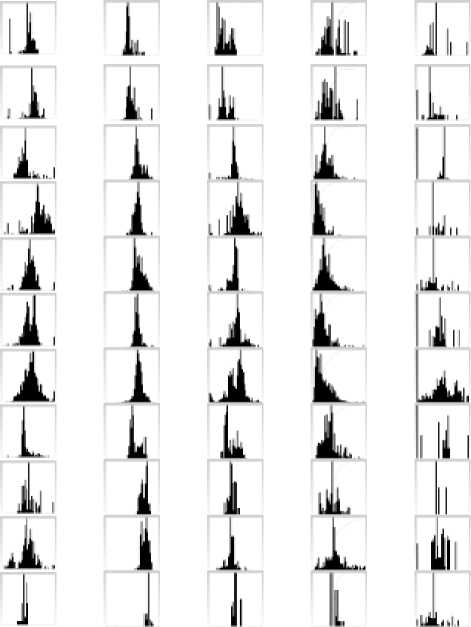
For training and using Artificial Neural Network Unit for clusterization on the basis of logging data, there was used module «K.mod» of Techlog software. Core and log data from four wells that were studied in detail were taken as a training sample. Results of clusterization and core lithology are provided in Fig. 1.
After splitting the wells’ sections into clusters based on log data, the data were aligned with available lab test core data, well sampling data, and with log data. All of that allowed assigning certain clusters to reservoir or non-reservoir and describing clusters in terms of argillite, salt, and gravelite content. Finally, 19 clusters formed seven groups associated with seven lithotypes (Table 2). Groups 1-5 fall into the category of reservoir, while Groups 6-7 are non-reservoir category.
4. Determination of a Porosity Index
The main logging method for determination of the terrigenous deposits porosity is the acoustic logging that was carried out almost in all drilled wells in the field. By the AL results the interval time is determined Δt, the function of which is the porosity index K por . Following the results of the AL data – 456 –
Table 1. Description of lithological types of rock and corresponding to them geophysical characteristics by the result of the cluster analysis. ∆J AL , ∆J GRL , ∆J P , ∆J NGL , ∆J DL – normalized readings of acoustic log, gamma-ray log, potassium concentration, neutron gamma-ray log and bulk density log respectively.
Cluster number
ΔJ AL
ΔJ GRL
ΔJ P
ΔJ NGL
ΔJ DL


Lithology based on core
Completely saline coarsegrained sandstone
Sa l ine coarse-grained sandstone
Moderately saline coarsegrained sandstone
Poorly saline coarse-grained sandstone
Mostly coarse-grained sandstone with g ood porosity & permeability properties Coarse-grained sandstone with good porosity & permeability prop e rties
Silty argillite
Medium-graine d sandstone with average porosity & permeability properties
Medium-graine d sandstone with good porosity & permeability properties
Medium-graine d sandstone with good porosity & permeability properties
Siltstone
Siltstone to argillite, very fine
Fine-graine d sandstone
Silty argillite, sandy in places
Argillite
Ar g illite with rare inclusions of gravel grains
Muddy gravelite
Gravelite reservoir
Saline g r avelite
Table 2. Cluster groups
|
Cluster # Group name Core photo number |
Mineral composition, % |
|
I Sandstones with good porosity & 5, 6, 9, 10 permeability properties г— |
quartz: 84; feldspar: 5; halite: 3; anhydrite: 2; calcite: 4; dolomite: 2; siderite: 0; clay: 0. |
|
II Gravelites (reservoir) 18 |
quartz: 71; feldspar: 14; halite: 5; anhydrite: 3; calcite: 2; dolomite: 5; siderite: 0; clay: 0. |
|
Sandstones with average III porosity & permeability 8 properties |
quartz: 92; feldspar: 5; halite: 0; anhydrite: 0; calcite: 2; dolomite: 1; siderite: 0; clay: 0. |
It is known that the open porosity values determined using the core samples, as well as the total porosity estimated by geophysical methods shall practically coincide for intergranular reservoirs (Vendelshtein et al., 1978; Latysheva et al., 1986). Fig. 2 gives the results of a comparison of porosity indexes determined by the acoustic logging data (K pro AL ) with the use of equations of Table 3, and by the results of measurements using the core (K pro core ) for wells of the Verkhnechonskoe field with more than 70 percent of core recovery. Correlation factor between the data of K pro AL and K pro core equals to 0.92.
Table 3. Determination of porosity index Kpro by the AL data for different reservoir groups
|
Group name |
Clusters number |
Dependence Kpro = f(At) |
|
I. Sandstones with good porosity & permeability properties |
5, 6, 9, 10 |
_ 1320948 - 32264 • At + 311 • At2 - 1,3 • At3 + 0,002 • At4 por = 1 + 1261 • At - 9,8 • At2 + 0,02 • At3 |
|
II. Gravelites (reservoir) |
18 |
|
|
III. Sandstones with average porosity & permeability properties |
8 |
|
|
IV. Sandstones with poor porosity & permeability properties |
13 |
|
|
V. Saline sandstones (reservoir) |
3, 4 |
_ 55927 - 4341 • At + 101 • At2 - 0,7 • At3 + 0,001 • At4 por = 1 + 1124 • At - 9,5- At2 + 0,02 • At3 |
s
0 5 10 15 20 25
K p or AL , %
Fig. 2 Comparison of the porosity index measured using the core (K pro core ) with the porosity index determined by the AL (K pro al )
5. Determination of a Permeability Index
The forecast of permeability as a function of porosity leads to considerable errors in its evaluation. This is explained by the fact that one value of porosity corresponds to the wide range of permeability change (up to 2 orders of magnitude) as the latter is controlled not only by the porosity, but above all by the perfection of the pore space structure (coarsening of grains of the skeleton, improvement of sorting and packing, increase of filtration channels radii, reduction of their tortuosity, etc.)
It is known that the splitting of relation Kperm = (Kpro) into individual lithological regressions leads to the considerable improvement of the permeability forecast K perm . Therefore in our case for each of 5 selected lithotypes the individual regressions were established Kperm = (Kpro) that were used in future for forecasting the permeability as functions of porosity and reservoirs lithology (drawing – 459 –
Table 4. Dependence of permeability index Kperm on porosity Kpro for different reservoir groups
|
Group name |
Clusters number |
Dependence Kperm = f(K pro ) |
|
I. Sandstones with good porosity & permeability properties |
5, 6, 9, 10 |
Kperm = 1,1 • K ppr |
|
II. Gravelites (reservoir) |
18 |
K perm = 0, 25 • Kpor |
|
III. Sandstones with average porosity & permeability properties |
8 |
K perm = 0,16 • K p 0 3 r |
|
IV. Sandstones with poor porosity & permeability properties |
13 |
:. |
|
V. Saline sandstones (reservoir) |
3, 4 |
К —012- К1,13 1X perm u,±^ ixpor |
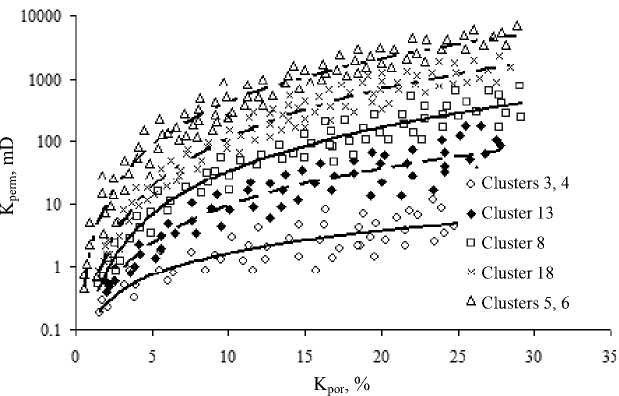
Fig. 3 Comparison of porosity index and permeability index with splitting rocks into classes
-
3) . Table 4 gives the obtained relations for various groups of reservoirs rocks. Fig. 3 demonstrates that permeabilities differing by 3 orders of magnitude correspond to the various lithotypes of the same porosity.
Conclusion
As a result of the conducted studies the following results were obtained:
-
– by means of the cluster analysis of materials of special core studies, five lithological classes of reservoirs were determined as well as the average values of petrophysical features corresponding to them;
-
– an algorithm of neural networks for identification of lithotypes on the basis of logging suite was adjusted; the expert evaluation and correction of adjustment results were conducted; the analysis of a reliability of lithological classes of rock prediction was done;
-
– the improved methodology for evaluation of the reservoir rock permeability as a function of their porosity and lithology was developed.
By virtue of the conducted target-oriented core analysis, we achieved a possibility to detect distinctive lithofacies categories visible not only in the space of porosity and permeability but as well characterized by the high degree of homogeneity in terms of their petrophysical features. The acquired lithological information may be successfully applied for populating geological models with data on porosity and permeability properties of the reservoir.
