User story based information visualization type recommendation system

Author: Liu Xu
Journal: International Journal of Information Engineering and Electronic Business @ijieeb
Article in issue: 3 vol.11, 2019.
Free access
To help users to determine the most appropriate visualization type is a useful feature of business visualization tools. Existing systems often give preliminary suggestions based on data sources but usually cannot make practical final decision. User stories are generalizations of user requirements. To recommend visualization type based on user stories can make better use of human experience to achieve automated decision making. One approach discussed in the paper is using machine learning techniques to model existing visualization types with corresponding user stories, and then use this model to predict recommended visualization type for new user story. This paper designs and implements a recommendation system prototype ReViz to verify the feasibility of this approach. As a typical web application, Modeling, Input Processing and Predicting components of ReViz are programmed using Python with Flask framework and Anaconda package set, and user interface is implemented using HTML, JavaScript and CSS with Bootstrap front-end library. The evaluation results show that ReViz can give recommended visualization type based on user story keywords. As a data-based intelligent software development technology achievement, visualization type recommendation system can also be integrated into larger business information management systems.
User story, information visualization, visualization type recommendation, natural language processing, machine learning
Short address: https://sciup.org/15016171
IDR: 15016171 | DOI: 10.5815/ijieeb.2019.03.01
Text of the scientific article User story based information visualization type recommendation system
Published Online May 2019 in MECS
Information visualization is widely used in business area, and the number of visualization types is increased quickly. For instance, D3.js web site lists more than 300 different visualization types [1]. In the field of business software, Business intelligence (BI) tools integrate dozens of different visualizations and allow users to add customized visualization types. For example, SAP Lumira is such a BI tool that allows users to visualize data graphically and to definite new visualization charts as so-called chart extensions [2]. In the face of so many types of visualization, business users are difficult to decide which visualization types are the most appropriate for their tasks [3]. Though current visualization tools such as SAP Lumira and Tableau provide a powerful set of mechanisms to manually specify visualization types [4], these tools still lack recommendation functions for customer solution developers. Visualization types usually need to be selected in advance in a specific solution [5].
Many existing approaches to choose the best visualization type are rule-based [6]. For example, according to visualization purpose, if it is required to display compositions of the entirety, Pie should be used, and if relationships should be highlighted, Scatter or Bubble may be a better choice. Few approaches attempt to automatically generate visual representations. To building effective visualization recommendation (VISREC) systems, both data source knowledge and human expertise about visualization design should be considered [7]. In Agile software development, user stories are widely used as a format to describe requirements of customers, especially in business software development. A new approach which uses user story as a basis for visualization type recommendation is proposed in this paper. Since user stories are described by natural language, we can use machine learning technology for natural language processing and forecasting [8]. From a program perspective, it is training one data model and use the model to decide which visualization type is the best. This paper introduces some work related to recommendation systems and some features of user stories firstly, and then design and implement ReViz as a prototype. ReViz builds a multiple linear regression model based on saved user data, and then uses this model to give new suggestions based on new user stories and data sources metadata.
-
II. Related Work
Visualization recommendation system is helpful because domain experts are required to choose a visualization type in various formats based on human experiences [9]. Existing recommendation systems generally consider factors such as data characteristics, intended task, semantics, visual ease of understanding, user behavior [10] and user preferences. Data characteristics-oriented approaches focus on data dimensions or attributes, proposes some rules for determining which type of visualization is appropriate for certain data attributes. Intended task and semantics consider more aspects such as style and goal of analysis, and professional background of users. Visual ease of understanding attempts to find the most intuitive way for easy understanding and considers that different users may prefer different visualization types.
In terms of visualization recommendation system implementation, some existing systems have been developed according to user preferences and knowledges. Knowledge-based filtering basically is an interactive process. Users are required to answer some questions or choose some items to make the recommendation system return better results. Knowledge-based filtering is a rule-based way, which makes recommendations based on explicit knowledge models. In other commonly used recommendation system implementation techniques, content-based recommendation systems [11] give suggestions based on user preferences by rating items. Collaborative filtering [12] is also based on historical rating data. These approaches are data-based, and lots of user data should be accumulated for a practical system. Generating visualizations recommendation system based on user story is also a data-based. It is primarily an implementation of a model-based collaborative filtering approach. The recommendation data model is trained mainly based on historical user stories and visualization types relationship data.
-
III. User Story
User Story is an effective approach which describes the requirement of a software feature. It is a concept introduced by agile development, and widely used in modern business software development [13]. In theory, one user story development workload should be as small as possible. One working day is an idealized workload, because scrum meeting is held once a day. However, very few well-tested product features can be implemented in one day. A feature usually contains a set of user stories and generally known as an epic. One epic is too large to be completed one day, so development team will need to split one epic to many user stories. A well-defined user story can accelerate software development significantly. It is because user stories can be defined in a very detailed level, and they are usually short and simple which follow a special template like “As a
Business Intelligence solution is usually developed based on existing visualization libraries and data processing platforms. Choosing the most appropriate visualization types is an important step of building a successful visualization solution. In regular business visualization solution development process, visualization types are usually defined by product owner (PO) and written into product design document. Sometimes business solution software developers must read user stories and pick appropriate visualization type by themselves according to the textual description. These choices are based primarily on the accidental decision of one specific PO or software developer, so the quality of visualization type choosing is highly dependent on human experience of product owners and software developers. If many past high-quality decisions can be saved and be used to train a model, visualization type choosing based on the model can be automatically and verifiable. The quality of automated decision making should be better than the decisions made by inexperienced product owners and software developers.
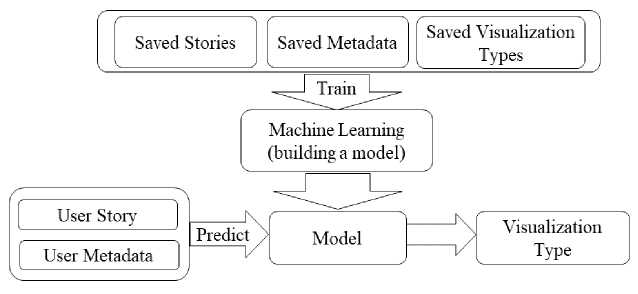
Fig.1. Visualization Type Generation Process Based on User Story
The visualization type generation process is described in Fig.1. In addition to user stories, data source metadata is also required to build the model and predict visualization type. Data source metadata usually contains chart measure and dimension field names. The number of data source fields can also affect visualization type selection. For example, if there are only two measure fields in current usage scenario, Bubble should not be recommended. Since data source metadata is easy to acquire and process and has been widely used in existing visualization type recommendation systems, the focus of this paper is mainly on the handling of user stories.
Since user stories are short text and have specific structure, it is possible to use natural language processing technology to parse the text [15] and build a model based on user stories to output recommend visualization types [16]. One possible simple approach is extracting some notional words as keywords of one user story, and build a model based on these keywords and user selected visualization types. If user stories can be analyzed automatically, business solution developers can choose the most suitable visualization type according to automatically generated recommendations based on existing models and build more flexible solutions dynamically [17]. The light-weight visualization recommendation system implementation can be easily integrated into the whole business Intelligence solution to improve the development efficiency.
-
IV. Reviz: A Prototype
To verify the feasibility of recommendation system based on user story, ReViz is built as a prototype. In a full-featured information system, collecting and preprocessing data should have been finished by data handling subsystems. The usage scenario of ReViz is existing business data has been collected into a two-dimensional table which is saved as a database table or an Excel file, and an array of automatic visualization type recommended values based on the table should be calculated. To train a model, data values are supposed to be normalized, and illegal values and outliers in the data have been cleaned up.
Table 1 displays a part of the sample data. In Table 1, the first 4 columns “bar”, “line”, “pie” and “treemap” are 4 different kinds of visualization types, and “country”, “different”, “population” are keywords extracted from user stories and metadata of data sources. Each line of Table 1 records one known decision. For example, the first line means if user story and metadata keywords contain “population”, and do not contain “country” or “different”, ReViz should recommend Pie as the selected visualization type. The fifth line means if user story and metadata keywords contain both “country” and “population”, and do not contain “different”, ReViz should recommend Treemap as the selected visualization type. The number of rows and columns in real data table is much higher than Table 1, but the real data table has data structure that is highly like Table 1.
Table 1. A Part of Sample Data of Known Factors Affecting Visualization Types
|
bar |
line |
pie |
treemap |
country |
different |
population |
|
0 |
0 |
1 |
0 |
0 |
0 |
1 |
|
1 |
0 |
0 |
0 |
1 |
0 |
0 |
|
0 |
1 |
0 |
0 |
0 |
1 |
1 |
|
0 |
1 |
0 |
0 |
0 |
1 |
0 |
|
0 |
0 |
0 |
1 |
1 |
0 |
1 |
The design propose of ReViz is providing an easy to use web-based interface to allow users to input and edit one user story and corresponding keywords, and then get the recommended values for each provided visualization type. Before outputting recommended level values, ReViz should already build one data model which can be used to predict which visualization type is the most recommended one. Training one model is usually a time-consuming process, but models can be reused. Once we get the available model, we can just use it to predict the most suitable visualization type multiple times, and the predict process should be much faster than building model. In an actual business visualization system, ReViz can be integrated as a component in control panel.
-
A. System Design
Like most modern information management systems, ReViz can be divided into server-side and client-side. Client-side components are basically user interface components, and core functions are mainly implemented in server-side. Server-side has three main components: Modeling, Input Processing, and Predicting. The three components correspond to three main use cases: building data model, processing user story, and getting prediction results.
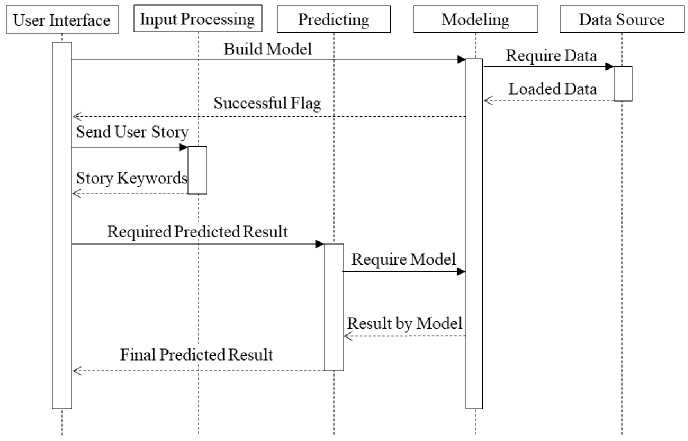
Fig.2. Sequence Diagram of ReViz
Fig.2 is Sequence Diagram of ReViz. Error handling is ignored since ReViz is designed as a prototype. The entire system is event driven, and user interface is the program entry. Data source will be loaded to build data model at system startup. Once data model is trained, the life cycle of the data model runs through the system. Input Processing is designed to extract and normalize keywords from user stories, and users can add or delete these keywords according to data source metadata. Predicting component reads these keywords, and requests data model to predict recommendation values for each visualization types. Recommended values will be received and displayed into user interface.
-
B. Server-side Implementation
Python is the main development language of ReViz in server-side. As a popular language, there is a whole set of development libraries and frameworks for modeling and predicting using Python in the field of machine learning. Many commonly used python packages like Pandas [18] or scikit-learn can be found in package set Anaconda. Flask is a lightweight Web framework, which can be used to porting regular python programs to server-side web applications.
Two-dimensional table data is stored in a CSV file. To implementation modeling component of ReViz, read_csv function of Pandas package is called to load saved CSV data file, and LinearRegression model of scikit-learn package is selected to build the visualization types recommendation model since discrete keywords are stored into data source files. In practical applications, we can also choose TensorFlow to build a more powerful artificial neural network model for prediction.
To extract keywords from current user story, Input Processing component should use lexical analyzer to parse the whole sentence to a word array, lemmatize these words, and choose all nouns, verbs and adjectives as keywords. Lexical analysis in English is relatively simple because words are separated by spaces.
Lemmatization is far more complicated. It normally means to remove inflectional endings and to return the base or dictionary form of a word. For example, “populations” will be changed to “population”, and “countries” will be changed to “country” after lemmatization. WordNet is a lexical database for the English language, which is part of the NLTK corpus. WordNet alongside the NLTK module can be called to lemmatize words and determine if a word is a noun, verb or adjective.
In LinearRegression model of scikit-learn, Predicting component can be implemented by using DataFrame function of Pandas package to build the input argument, and calling predict function of LinearRegression. The prediction result will be an array which records recommended values for each visualization type. It is the responsibility of client-side component to display these values in an easy to understand mode for customers.
-
C. Client-side Implementation
Input Processing and Predicting components need to have client-side functions to allow user interactions. In a web application, client-side components can be implemented using HTML, JavaScript and CSS [19]. To make development more efficient, Bootstrap can be used to build responsive UI controls for the web application, and many utility functions can be found in jQuery library.
Fig.3 is the client-side GUI of Input Processing component. In the interface implementation of the user story input, a textarea element can be used a as the input box and a dropdown box can be put as the selection control for sample user stories. The selected user story will be displayed into the textarea to allow users to make further edits. Edited user story text will be sent to server-side when the submit button is clicked, and users can add/delete returned keywords according to data source metadata or other information. Then users may send all selected keywords to server-side to get recommendation result.
As a report user, I can compare populations of different countries.
As a report user, I can compare populations of different countries Submit country О population О different О compare о
Go!
Fig.3. Client-side GUI of Input Processing Component
To receive keywords and recommended values for visualization types from server-side, getJSON function of jQuery should be called to get JSON-encoded data. JSON.parse function will be called to get returned JavaScript objects from strings. The final recommendation result will be scored for each type of visualization, and these values will be displayed as a bar chart for better visual effects.
-
D. Results and Evaluations
To use ReViz, users need to start Flask server-side components firstly, and then open client-side web page to enter or select one user stories. Since the data source file is small in ReViz, model training process in server-side startup is quite fast. If users select sample user story 1 “as a report user, I can compare populations of different countries”, the returned keywords will be “country”, “population”, “can”, “user”, “report”, “a”, “different” and “compare”. All keywords are nouns, verbs and adjectives. However, some words like “user” and “can” are not related to the data source metadata, or do not reflect the degree of differentiation of the user story, so users may remove them. If the final selected keywords are “country”, “population”, “different” and “compare”, the recommended results will be displayed in client-side page as Result 1 in Fig.4.
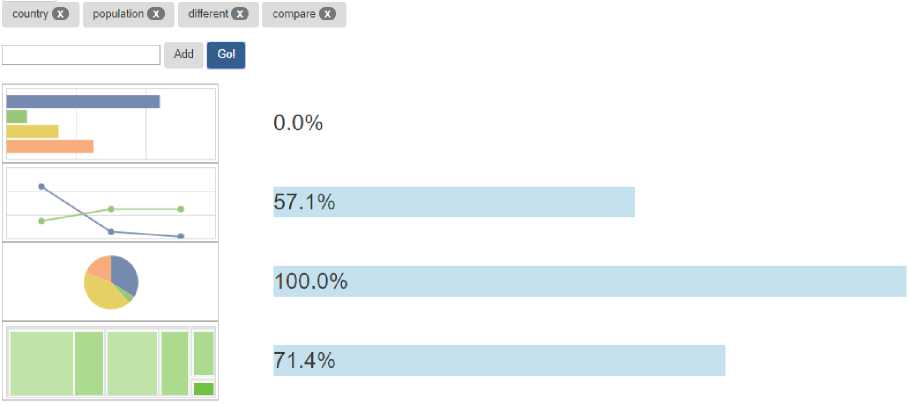
Fig.4. Visualization Types Recommendations Result 1
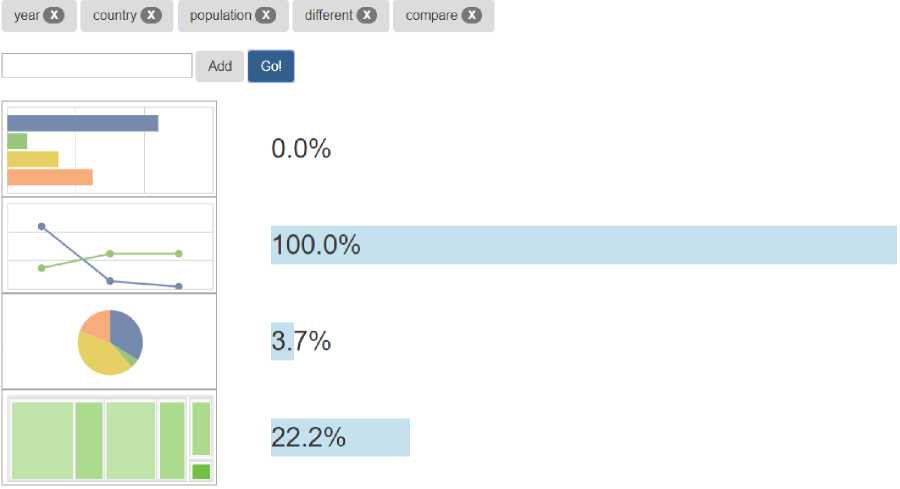
Fig.5. Visualization Types Recommendations Result 2
It is not difficult to see that Pie has received recommended value 100% in Result 1. Treemap gets 71.4%, Line gets 57.1%, and Bar gets 0.0%. It is easy to understand this result in combination with human experience. Pie is often used to show the proportion of a single value in the total value, so Pie is the most recommended visualization type. Treemap is also often used for numerical comparisons.
If users select sample user story 2 “as a report user, I can compare populations of different countries” and select “year”, “country”, “population”, “different” and “compare” as final selected keywords, Fig.5 displays the recommendation result. Although there is only one more “year” keyword compared to the last time, recommended results are completely different. Currently Line gets 100% recommended value, Treemap gets 22.2%, Pie gets 3.7%, and Bar gets 0.0%, so Line is the most recommended visualization type. Line is usually used for time series numerical comparison. The keyword “year” makes the recommendation more inclined to Line.
In terms of time performance of ReViz, although it may take several minutes to load Python packages and modeling at startup, the model fits quickly and can achieve delay-free responses on the client-side user interface. The practical value of such performance is obvious. Please note that ReViz is a prototype system with limited sample data for modeling. The visualization type recommendation values in the paper do not fully represent real use cases.
-
V. Conclusions
The implementation of ReViz verifies the feasibility of visualization type recommendation systems based on user stories. The models and data source structure used by ReViz are relatively simple but can easily be generalized to more complex situations. To build a practical system based on ReViz, researchers and developers can try more natural language modeling methods and improve data preprocessing module to accept more data sources [20]. As can be seen from the running process of ReViz, the essence of this visualization type recommendation system is to simulate the process of users reading user stories and selecting visualization types based on experience [21]. The recommendation system can make full use of past decision-making processes to automate the new decision process [22].
The choice of visualization type is a complex decision process. To improve the quality of type selection, in addition to user stories and data source metadata, other usage scene data can also be explored to participate in modeling. From the perspective of the end user, visualization type’s recommendation system is a tool to assist in decision making, but from a software development perspective, visualization types recommendation system based on user story is an attempt at data-driven software development model. To improve traditional experience-based software development process to data-based software development process is a trend toward intelligent software development.
Acknowledgment
The author wishes to thank Machine Learning Community of SAP Labs China for supporting this work.
References User story based information visualization type recommendation system
- Owonibi, P. K. M. (2017). A Review on Visualization Recommendation Strategies. In Proceedings of the 12th International Joint Conference on Computer Vision, Imaging and Computer Graphics Theory and Applications (VISIGRAPP 2017).
- Suarez, G. N. (2014). Custom Visualization Charts for Cancer Research in SAP Lumira.
- Voigt, M., Pietschmann, S., Grammel, L., & Meißner, K. (2012, February). Context-aware recommendation of visualization components. In The Fourth International Conference on Information, Process, and Knowledge Management (eKNOW) (pp. 101-109).
- Vartak, M., Huang, S., Siddiqui, T., Madden, S., & Parameswaran, A. (2017). Towards visualization recommendation systems. ACM SIGMOD Record, 45(4), 34-39.
- LIU, X. (2017). Code Duplication Detection Results Visualization Design and Implementation. Journal of Xihua University (Natural Science Edition), (06):13-22. (in Chinese)
- Abela, A. (2006). Chart suggestions-a thought starter. Revisado el, 20.
- Mutlu, B., Veas, E., & Trattner, C. (2016). Vizrec: Recommending personalized visualizations. ACM Transactions on Interactive Intelligent Systems (TiiS), 6(4), 31.
- Amatriain, X., Jaimes, A., Oliver, N., & Pujol, J. M. (2011). Data mining methods for recommender systems. In Recommender systems handbook (pp. 39-71). Springer, Boston, MA.
- Ananthanarayanan, R., Lohia, P. K., & Bedathur, S. (2018, June). Datavizard: Recommending visual presentations for structured data. In Proceedings of the 21st International Workshop on the Web and Databases (p. 3). ACM.
- Gotz, D., & Wen, Z. (2009, February). Behavior-driven visualization recommendation. In Proceedings of the 14th international conference on Intelligent user interfaces (pp. 315-324). ACM.
- Pazzani, M. J., & Billsus, D. (2007). Content-based recommendation systems. In The adaptive web (pp. 325-341). Springer, Berlin, Heidelberg.
- Wei, J., He, J., Chen, K., Zhou, Y., & Tang, Z. (2017). Collaborative filtering and deep learning based recommendation system for cold start items. Expert Systems with Applications, 69, 29-39.
- Lucassen, G., Dalpiaz, F., van der Werf, J. M. E., & Brinkkemper, S. (2017, February). Improving user story practice with the Grimm Method: A multiple case study in the software industry. In International Working Conference on Requirements Engineering: Foundation for Software Quality (pp. 235-252). Springer, Cham.
- Patton, J., & Economy, P. (2014). User Story mapping: Discover the whole story. Build the right product.
- Fleischman, M., & Hovy, E. (2003, January). Recommendations without user preferences: a natural language processing approach. In IUI (Vol. 3, pp. 242-244).
- Ali, S. H., El Desouky, A. I., & Saleh, A. I. (2016). A New Profile Learning Model for Recommendation System based on Machine Learning Technique. Indonesian Journal of Electrical Engineering and Informatics, 4(1), 81-92.
- Debnath, S. (2008). Machine Learning Based Recommendation System. Master's thesis, Department of Computer Science and Engineering, Indian Institute of Technology.
- McKinney, W. (2011). pandas: a foundational Python library for data analysis and statistics. Python for High Performance and Scientific Computing, 14.
- LIU, X. (2014). Implementation Analysis and Performance Optimization for JavaScript Array in Chrome V8. Computer and Modernization, (10):66-70. (in Chinese)
- Zhang, S., Yao, L., Sun, A., & Tay, Y. (2019). Deep learning based recommender system: A survey and new perspectives. ACM Computing Surveys (CSUR), 52(1), 5.
- Davidson, J., Liebald, B., Liu, J., Nandy, P., Van Vleet, T., Gargi, U., ... & Sampath, D. (2010, September). The YouTube video recommendation system. In Proceedings of the fourth ACM conference on Recommender systems (pp. 293-296). ACM.
- Wang, Z., Liao, J., Cao, Q., Qi, H., & Wang, Z. (2015). Friendbook: a semantic-based friend recommendation system for social networks. IEEE transactions on mobile computing, 14(3), 538-551.
