Using MODIS satellite data to analyze correlation between phenology of forest vegetation and climate in Siberia

Author: Pisman T.I., Botvich I.Yu., Emelyanov D.V., Shevyrnogov A.P.
Journal: Журнал Сибирского федерального университета. Серия: Техника и технологии @technologies-sfu
Section: Исследования. Проектирование. Опыт эксплуатации
Article in issue: 2 т.18, 2025.
Free access
The study reports results of analyzing the dynamics of forest vegetation phenology associated with climate change in Siberia (the Stolby National Park, Krasnoyarsk Krai). Correlations between the start of growing season (SOS) and land surface temperature (LST) in March, April, May, and June and between the end of growing season (EOS) and LST in August and September have been analyzed. Regions where the growing season of forest vegetation tends to increase have been revealed. The study shows that the longer growing season of forest vegetation is associated with the earlier start of the season, which is correlated with the rise in April air temperature. The later end of growing season of forest vegetation is determined by higher temperatures in both August and September
Remote sensing data, modis, siberia, forest, climate, phenology, correlation
Short address: https://sciup.org/146283093
IDR: 146283093 | UDC: 528.8.04
Использование спутниковой информации MODIS для анализа корреляции фенологии лесной растительности и климата на территории Сибири
Представлены результаты анализа динамики фенологии лесной растительности в связи с изменением климата на территории Сибири (Красноярский край, Заповедник «Столбы»). Проведен анализ корреляций между началом вегетационного сезона SOS (Start Of Season) и радиационной температурой поверхности Земли LST (Land Surface Temperature) в марте, апреле, мае, июне и анализ корреляций между концом вегетационного сезона EOS (End Of Season) и LST в августе и сентябре. Установлены территории, на которых период вегетации лесной растительности имеет тенденцию к росту. Показано, что удлинение периода вегетации лесной растительности обусловлено более ранним началом вегетации, которое коррелирует с ростом апрельских температур воздуха. Установлено, что более позднее окончание вегетации лесной растительности обусловлено высокими температурами как в августе, так и в сентябре
Text of the scientific article Using MODIS satellite data to analyze correlation between phenology of forest vegetation and climate in Siberia
Цитирование: Письман Т. И. Использование спутниковой информации MODIS для анализа корреляции фенологии лесной растительности и климата на территории Сибири / Т. И. Письман, И. Ю. Ботвич, Д. В. Емельянов, А. П. Шевырногов // Журн. Сиб. федер. ун‑та. Техника и технологии, 2025, 18(2). С. 241–248. EDN: HZGQZB are obtained by studying a limited number of plants on a small plot of land while remote sensing provides information about a great number of plants on a vast area.
The most practically relevant information is the data on the start of season date [5]. The current shifts in spring phenological dates are primarily associated with the temperature of the previous months.
Some researchers consider fall phenology (identifying the end of season date) to be more difficult to monitor than spring phenology [6]. Hence, contradictory data are obtained. To estimate fall phenology of vegetation, some authors used leaf color differences. The correlation between remote sensing data and ground data was rather strong in most areas.
Recent years have seen a dramatic increase in the interest in time series data of long-term phenological observations [7]. They provide information on year to year variations in the state of populations and are necessary for determining the effect of climate factors on phenological characteristics. In studies using time series data of continuous remote sensing with sufficiently high temporal resolution, the first day of the year corresponding to the start of the upward trend in the time series of vegetation indices is taken as the date of the start of growing season [8].
Because of the necessity to conduct forest monitoring on vast areas and the specific natural and geographic conditions, remote sensing, particularly satellite monitoring, is regarded as the major source of data on forest phenology. The use of remote sensing increases reliability, efficiency, and regularity of measuring the main parameters of forest dynamics to levels unattainable by other existing methods [9].
Monitoring of phenology of forest ecosystems in conservation areas is limited by strict nature protection norms. Therefore, remote sensing methods are particularly useful for studying phenology of forest vegetation in such areas.
The purpose of the present research was to study dynamics of phenology of forest vegetation in Siberia (the Stolby National Park, Krasnoyarsk Krai) as responding to climate change, based on MODIS Terra/Aqua satellite data for 2000–2018. The study included a) analysis of correlations between the start of growing season (SOS) and the land surface temperature (LST) in March, April, May, and June and b) analysis of correlations between the end of growing season (EOS) and LST in August and September.
Materials and Methods
The study was performed on forests located in the Stolby National Park (Krasnoyarsk Krai, Siberia, Russia, 55°38 ′ – 55°58 ′ N, 92°38 ′ – 93°05 ′ E).
The Stolby National Park, with an area of 472 km2, is situated 40 km away from a large industrial city, Krasnoyarsk. The Eastern Sayan, where the Stolby National Park is situated, has two altitudinal zones: the low-mountain zone (between 200 and 500 m a.s.l.) and the high-mountain zone (between 500 and 800 m a.s.l.). The higher zone is the zone of dark coniferous taiga (fir, spruce, and Siberian pine), and the lower zone is the zone of broadleaved–light coniferous forests (Scotch pine, larch, birch, and aspen) (Fig. 1).
The Stolby National Park is located in both Eastern and Western Siberia, and, thus, it has a moderate climate, which is wetter, colder, and less continental in the dark coniferous taiga zone. The amount of precipitation in the mountain-taiga region of the Stolby National Park is about 686 mm, 32 % of which falls in winter, 22 % in spring, 27 % in summer, and 19 % in fall.
In this region, winter lasts about 150 days; the winter temperature ranges between –10 °C and –30 °C with an average of –19 °C; the snow cover reaches 30–50 cm, depending on the surface topography and amount of precipitation.
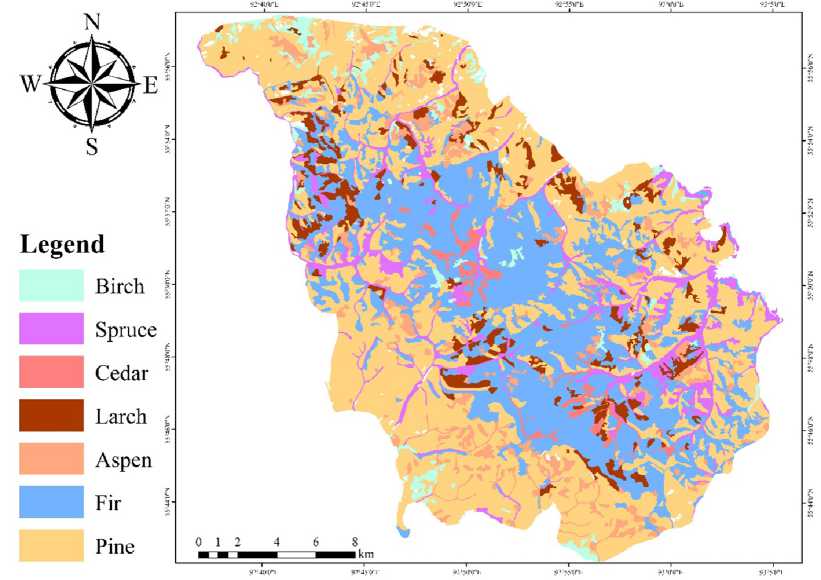
Fig. 1. A map of forest vegetation in the Stolby National Park
The summer is short, about 60 days; the hottest month is July, with an average daytime temperature of +22 °C and the largest amount of precipitation.
Determining the start of growing season (SOS) and the end of growing season (EOS).
The data for 2000–2018 provided by the spectroradiometer MODIS Terra/Aqua, product MCD 12Q2 v006, were used in the present study. The QGIS software was used to perform preliminary and thematic processing of satellite data.
MCD 12Q2v006 contains 13 layers. In the current study, we used layers that allowed us to determine the start of growing season (SOS) and the end of growing season (EOS). SOS can be determined using layers MidGreenup or Greenup and EOS – layers MidGreendown or Dormancy.
Determining Land Surface Temperature (LST)
The relationship between phenological events and climate change was studied using the following data. To determine the effect of land surface temperature (LST) on SOS, average monthly temperatures for March, April, May, and June were used. To determine the effect of LST on EOS, average monthly temperatures for August and September were used.
Average monthly values of LST were determined using the data of products MOD 11A2v006 and MYD 11A2v006 (Equation 1). Total values of daytime and nighttime LST were averaged taking into account the data of the Daytime and Nighttime layers for eight days:
T _ LSTAday + LSTAnight + LSTTday + LSTTnight
where LST Aday is LST (°C) obtained from the Modis/Aqua daytime data (day), LST Anight is LST (°C) obtained from the Modis/Aqua nighttime data (night), LSTTday is LST (°C) obtained from the Modis/ Terra daytime data (day), and LSTTnight is LST (°C) obtained from the Modis/Terra nighttime data (night).
Mapping the spatial distribution of correlation coefficients between the start of growing season (SOS) and the end of growing season (EOS)
and land surface temperature (LST)
For each pixel with coordinates (x, y) of the satellite image, a time series Y= {y 1 , y 2 , …, y n } of the SOS or EOS values was formed. The time series was formed from yi measurements, including noisy ones, obtained at corresponding time points ti.
Erroneous values in the time series were flagged and were not used. These values were replaced by the average of the preceding and succeeding values of the vegetation index (calculating the average with a sliding window size of 3). If two consecutive values were missing, the value of that pixel was assigned the average value over a sliding window of width 5, and erroneous values were not used.
The significance level was determined; the trend with a 95 % level (p <0.05) was considered significant.
Results
Correlation between the start of growing season (SOS)
and land surface temperature (LST) in the Stolby National Park in March, April, May, and June based on remote sensing data
The maps of the spatial distribution of correlation coefficients between the start of growing season (SOS) and land surface temperature (LST) in March, April, May, and June are presented in Figure 2. The strongest (negative) correlation between the average monthly values of LST and SOS was found for April (red color). Analysis of the relationship between the start of the growing season (SOS) and the April LST values showed that 37 % of the pixels fell within the range of values between –1 and –0.5 versus 0.2 %, 4.4 %, and 1.6 % for March, May, and June, respectively.
The greatest negative values of correlation coefficients between LST and SOS indicate that the temperature of the given month makes the greatest contribution to the earlier start of the growing season. The higher the LST, the lower the SOS value is, i.e., the earlier the growing season starts.
Analysis of the correlation between SOS and LST showed that the earlier start of the growing season of forest vegetation in the Stolby National Park is caused by an increase in the April temperature.
Correlation between the end of growing season (EOS)
and land surface temperature (LST) in the Stolby National Park in August and September based on remote sensing data
The map of the spatial distribution of correlation coefficients between EOS and LST in August and September is shown in Figure 3. Analysis of the relationship between EOS and the August LST values showed that 6.41 % of the pixels fell within the range of values between –1 and –0.5 versus – 245 –
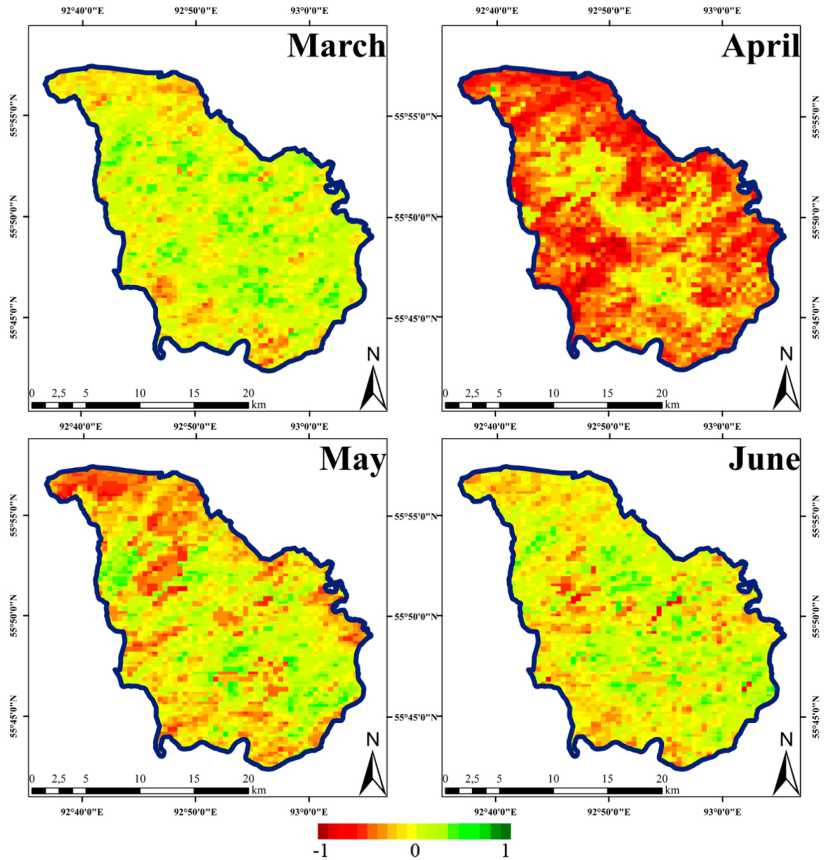
Fig. 2. Spatial distribution of correlation coefficients between the start of growing season (SOS) and the average monthly land surface temperature (LST) in March, April, May, and June
0.03 % for September. Analysis of the relationship between EOS and the August LST values showed that 4.91 % of the pixels fell within the range of values between 0.5 and 1 versus 6.41 % for September. The significant majority of pixels – 88.67 % (for August values) and 93.55 % (for September values) – had correlation coefficients below ±0.5.
Thus, in some parts of the Stolby National Park, August values of the average monthly LST make the greater contribution to the earlier end of growing season than the September values of LST. The later end of growing season is caused by higher temperatures in both August and September.
The start and end of the growing season in the Stolby National Park, which is situated at the Eastern Sayan, in two altitudinal zones (the low-mountain and high-mountain ones), do not occur simultaneously in different parts of the study area. The present study showed that August and September make different contributions to the date of the end of growing season in different parts of the study area. Analysis of correlation between EOS and LST in August revealed that in some plots (6.41 % pixels), August contributes to the earlier EOS while on other plots (4.91 % pixels) – to the later – 246 –
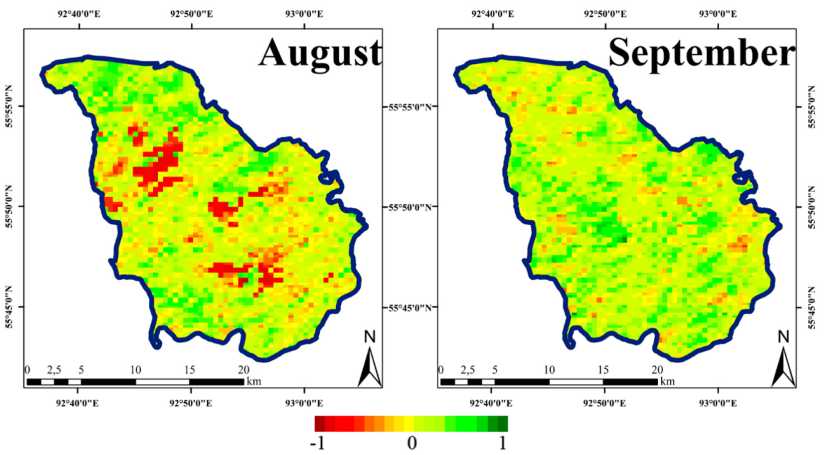
Fig. 3. Spatial distribution of correlation coefficients between the end of growing season (EOS) and the land surface temperature (LST) in August and September
EOS. There are plots (6.41 % pixels) in which September contributes to the later EOS, and in these plots, the growing season lasts longer. Thus, because of differences in the topographic conditions and, hence, regional climate variations, the start and the end of growing season differ across the parts of the Stolby National Park.
Conclusion
The present study analyzed the dynamics of forest vegetation phenology associated with climate change in Siberia (the Stolby National Park, Krasnoyarsk Krai) based on MODIS Terra/Aqua satellite data for 2000–2018.
The following main conclusions were derived:
-
– Correlation between the start of growing season of forest vegetation (SOS) and land surface temperature (LST) in March, April, May, and June was studied using remote sensing data. The rise in April air temperature was found to determine the earlier start of growing season in the study area.
-
– Analysis of the correlation between the end of growing season (EOS) and land surface temperature (LST) showed that the later end of growing season in the Stolby National Park is caused by the warm weather in August and September.
-
– MODIS data were used to delineate the growing season and determine its duration over the entire area of the Stolby National Park for the period between 2000 and 2018. Regions in which the growing season tends to grow longer were revealed. The area of such regions was 63.3 % of the total study area. The growing season starts earlier in 77.3 % of that area and ends later in 43 % of the area. Earlier dates of the start of growing season are the main reason for the longer growing season.
References Using MODIS satellite data to analyze correlation between phenology of forest vegetation and climate in Siberia
- Yang W., Zhao Y., Wang Q., Guan B. Climate, CO2, and Anthropogenic Drivers of Accelerated Vegetation Greening in the Haihe River Basin. Remote Sens., 2022, 14, 268. DOI: 10.3390/rs14020268 EDN: JUAVEG
- Kou W., Liang C., Wei L., Hernandez A. J., Yang X. Phenology-Based Method for Mapping Tropical Evergreen Forests by Integrating of MODIS and Landsat Imagery. Forests, 2017, 8(34),. DOI: 10.3390/f8010034
- Seddon A. W.R., Macias-Fauria M., Long P. R., Benz D., Willis K. J. Sensitivity of global terrestrial ecosystems to climate variability. Nature, 2016, 531, 229-232,. DOI: 10.1038/nature16986
- Zhao J., Zhang H., Zhang Z., Guo X., Li X., Chen C. Spatial and Temporal Changes in Vegetation Phenology at Middle and High Latitudes of the Northern Hemisphere over the Past Three Decades. Remote Sensing, 2015, 7(8), 10973-10995,. DOI: 10.3390/rs70810973
- Ivanova Y., Kovalev K., Yakubailik O., Soukhovolsky V. The Use of Satellite Information (MODIS/Aqua) for Phenological and Classification Analysis of Plant Communities. Forests, 2019, 10, 561,. DOI: 10.3390/f10070561 EDN: TTANDE
- Gill A. L., Gallinat A. S., Sanders-DeMott R., Rigden A. J., Gianotti D. J., Mantooth J. A., Templer P. H. Changes in autumn senescence in northern hemisphere deciduous trees: a meta-analysis of autumn phenology studies. Ann. Bot., 2015, 116(6), 875-88,. DOI: 10.1093/aob/mcv055 EDN: VEWTAN
- Yan E., Wang G., Lin H., Xia C., Hua Sun H. Phenology-based classification of vegetation cover types in Northeast China using MODIS NDVI and EVI time series.International Journal of Remote Sensing, 2015, 36, 489-512,. DOI: 10.1080/01431161.2014.999167
- Ge Q., Dai J., Cui H., Wang H. Spatiotemporal Variability in Start and End of Growing Season in China Related to Climate Variability. Remote Sens., 2016, 8, 433,. DOI: 10.3390/rs8050433 EDN: WQRHYN
- Helman D., Lensky I. M., Tessler N., Osem Y. A. Phenology-Based Method for Monitoring Woody and Herbaceous Vegetation in Mediterranean Forests from NDVI Time Series. Remote Sensing, 2015, 7(9), 12314-12335,. DOI: 10.3390/rs70912314 EDN: XYRQUT
