Using Shape Information and Dark Paths for Automatic Recognition of Touching and Overlapping Chromosomes in G-Band Images

Author: Payman Moallem, Arezoo Karimizadeh, Mohammadreza Yazdchi
Journal: International Journal of Image, Graphics and Signal Processing(IJIGSP) @ijigsp
Article in issue: 5 vol.5, 2013.
Free access
Nowadays, Karyotype analysis is frequently used in cytogenetics. It is a time-consuming and repetitive work therefore an automatic analysis can greatly be valued. In this research, an automatic method is presented. Firstly, a proposed locally adaptive thresholding method is used to segment chromosome clusters. Then, the clusters is divided into two main categories including, single chromosomes and multi-chromosome clusters based on geometric shape of clusters. In the next step, each extracted cluster is investigated to find the dark paths in order to detect touching chromosomes. Then, overlapping chromosomes are separated in clusters based on their geometric shapes. Finally, a criterion function is used to measure the similarity between the outputs of the proposed algorithm and the single chromosomes in order to recognize separated parts. The proposed algorithm is applied on 47 G-band images. The results shows that single chromosomes and clusters are recognized by the precision of 98.5% and 86.4%, respectively and separation of touching and overlapping clusters are done by precision of 70% and 67%, respectively.
G-Band Image, Touching chromosomes, Overlapping chromosomes, Dark path
Short address: https://sciup.org/15012705
IDR: 15012705
Text of the scientific article Using Shape Information and Dark Paths for Automatic Recognition of Touching and Overlapping Chromosomes in G-Band Images
Many Genetic diseases and inherited disorders in human are results of changes in number and structure of chromosomes, so the study of chromosomes in karyotype images is valuable in diagnosis of diseases. Karyotype analysis is frequently used in cytogenetics and it is time-consuming and repetitive, so an automatic analysis could greatly be valued.
Some steps mentioned below, have to be done in processing the chromosome images in karyotyping:
-
1. Separation of chromosomes from the image background
-
2. Dividing clusters into single chromosomes and clusters with more than one chromosome
-
3. Separation of touching and overlapping chromosomes
-
4. Finding centromere position and chromosome lengths and then arranging pair chromosomes
In this research, the three first steps are done. For separating the chromosomes from the image background, different methods such as Global thresholding with Otsu method [1], Local adaptive thresholding [2], k-means clustering [3] and combination of edge detection and k-means clustering and some thresholding methods used [4]. Chromosome images have high variability in intensity, so global thresholding is not a suitable thresholding method because it can break a single chromosome into two parts. Boundaries of chromosome clusters are not very smooth and using edge detection methods may cause some problems in separation of chromosome clusters from background, so Local adaptive thresholding method is used in this research because of its effectiveness [4].
Some important methods used to do the second step are feature extraction of chromosome clusters, including single chromosomes and clusters with more than one chromosome, using artificial neural networks to decide which one is single [3,5], using geometric shape of clusters [4] and some functions which are evaluated single chromosome likelihood of clusters [2]. In this research geometric shape of clusters is used to recognize single chromosomes from clusters with more than one chromosome, because it is simple and it doesn't need training.
For the third step, some researches concentrate only on disentangling of touching clusters using dark paths [6] or using geometric shape [4] and some researches concentrate only on separation of overlapping chromosomes by using different methods, such as Watershed segmentation method [7, 8] or using shape of clusters [9], curvature of the cluster boundaries [10], chromosome skeleton [11] and banding pattern in.
banded images [12,13]. In this research, the dark paths and geometric shape of clusters are used to separate touching and overlapping clusters
There are also some researches including all these three steps which applied to M-Fish [4] and Q-Band [2] images. These researches used the combination of methods which are mentioned.
The remainder of the paper is organized as follows. In Section II, characteristics of the dataset used in this article are described. Section III describes the method of this research that includes three steps. the first step is preprocessing that is mentioned in part A and is for removing small noisy blobs and separation of chromosomes and chromosome clusters from image background, the second step is recognition of multichromosome clusters from single chromosomes in part B which is done using geometric shape of clusters and in the third step which is mentioned in part C, separation of chromosomes in multi-chromosome clusters include touching and overlapping ones is described. In Section IV results of applying the method of this research are mentioned and the last section concludes the paper.
-
II. Dataset
47 chromosome images, prepared at Medical Genetic Center of University of Isfahan, provide the necessary data for this research. The dataset was prepared by imaging from Giemsa staining slides. As one sample is shown in Fig. 1, this staining method causes nonuniformity in images and the resulted images include some small blobs, so they need some preprocessing. This dataset contains a total of 1930 chromosome clusters and includes 60 touching clusters and 26 overlapping ones and the images are with 720×576 pixels resolution.
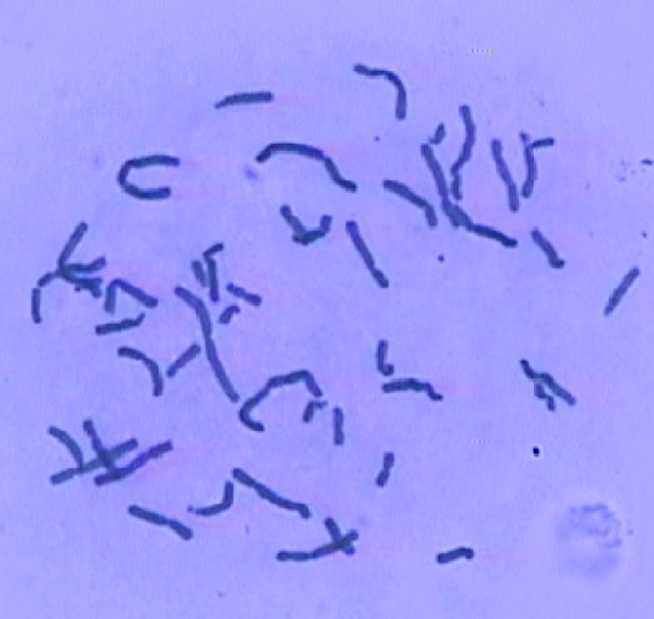
Fig. 1 One of the sample in dataset
-
III. Proposed Method
The method includes a preprocessing step which makes the images ready for the next steps. Afterwards, multi-chromosome clusters are recognized from single chromosomes and at the final step separation of chromosomes is done.
-
A. Preprocessing step
To make the images ready for next steps, some preprocessing should be done. First, the colored images are converted into grayscale ones. Then, very small noisy blobs, which area less than 44 pixels, are removed and afterwards, local adaptive thresholding is done.
For local adaptive thresholding, the images are divided into small squares with similar dimensions (100 pixels×100 pixels) and a global threshold is found based on Otsu method in each square. After computing a matrix of these thresholds, the dimensions of this matrix are converted to original image dimensions with interpolation. Using this matrix, the original image is converted into binary ones. One of the advantages of this method compared to global thresholding is that it reduces the possibility of breaking one chromosome into two parts.
Possible nuclei are then removed by a comparison between the whole surface of the image foreground and its division by the approximated number of chromosomes. In this research the approximated number of chromosomes is considered to be about 49 ones. A cluster with a surface more than approximated one is considered as a nucleus and is removed using morphological opening. Output of this stage is a binary image with clusters separated from the background.
-
B. Separation of single chromosomes and clusters of chromosomes
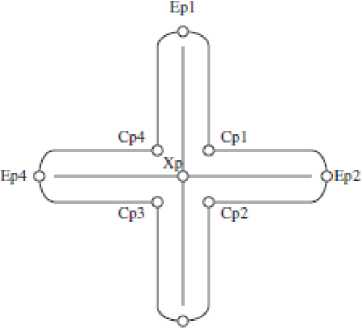
In this stage, a geometric method is used to separate single chromosome and multi-chromosome as shown in Fig. 2. The Cross points (Xp), End points (Ep) and Cut points (Cp) are detected from boundary segment. In order to find single chromosomes, End points are specified. If there are two End points in a cluster, that cluster is considered as a single chromosome cluster, otherwise it is considered as a multi-chromosome one [4].
ЕрЗ
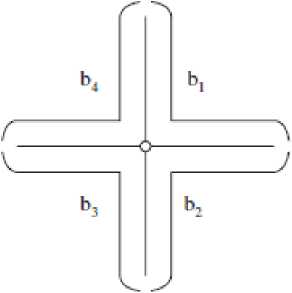
Fig. 2 Cluster landmarks (left) and boundary segments (right) [4]
In order to recognize the End points, first the skeleton of each cluster specified and then points on the boundary which had the most curvature and are the nearest points to the End points of skeleton are considered as End points of that clusters. In Fig. 3 the recognized End points in two clusters are shown.
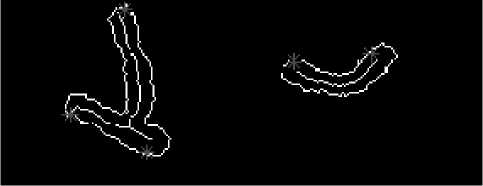
Fig. 3 Endpoints of a single chromosome cluster (right) and a two chromosome cluster (left)
Result of applying this part of algorithm to the image of Fig. 1 is shown in Figs. 4 and 5. In Fig. 4, the result of automatic recognition of single chromosomes, and in Fig. 5 the result of automatic recognition of multichromosome clusters is shown.
The method of this research for recognition of single chromosomes from clusters with more than one chromosome is so simple, but it has some drawbacks. Fig. 6 shows some mistakes which are happened in this part of algorithm.
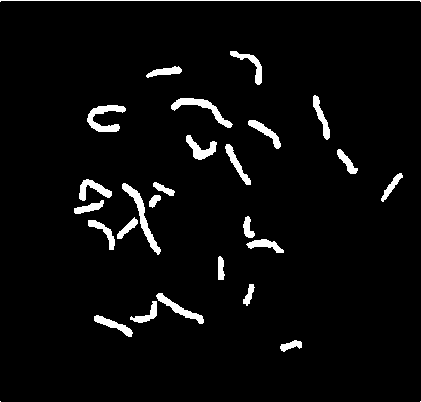
Fig. 4 Result of automatic recognition of single chromosomes
As it's shown in Fig. 6, the method could make two main mistakes: one of them happens when two chromosomes are lined after each other (right) that in this situation, the algorithm finds only two End points and the cluster is considered as a single chromosome. The other one is when a single chromosome is turned badly and produced End points (left) and the algorithm finds more than two End points and the single chromosome wrongly is considered as a cluster of more than one chromosome.
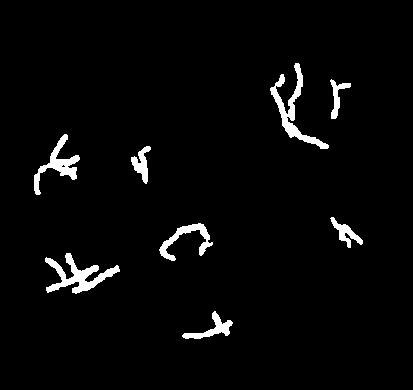
Fig. 5 Result of automatic recognition of multi-chromosome clusters
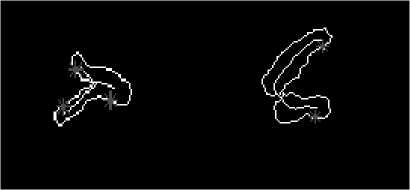
Fig. 6 Two mistakes in recognition of single chromosomes
-
C. Separation of touching and overlapping chromosomes
In the previous step, single chromosomes are successfully recognized from clusters of touching and overlapping ones. Overlapping and touching chromosomes are considered as single connected parts. To analyze chromosomes and prepare karyotype image, these connected parts should be changed into single chromosome images. So the automatic separation of single chromosomes in multi-chromosome clusters is one of the processing steps.
In this research, the following methods are used. In the first method, each cluster investigated to find a path darker than the other parts of that cluster. Using the geometric shape of each cluster, the second method investigated all possible cuts and after all a decision function applied to the results of these two methods which chose the best output. Our proposed algorithm for separation of chromosomes in multi-chromosome clusters is shown in Fig. 7.
As our algorithm shows, first of all each cluster is investigated to find dark paths and after that it is investigated to find one of the specific geometric shapes and then the decision based on the results of these two sections is done.
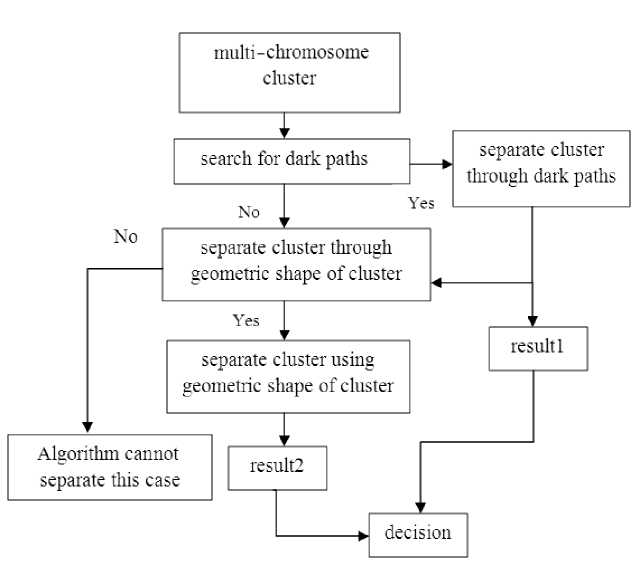
Fig. 7 Algorithm of this research for separation of multi-chromosome clusters
To find the dark paths, a curve is fitted to the boundary of the cluster and the curvature of the boundary is computed using (1) [2].
k ( l ) =
*( l ) y( l ) - X( l ) y ( l ) ( X ( l )2 + y ( l )2) 3/ 2
Which [ x ( l ) , y ( l )] is coordinate of a curve fitted to the chromosome boundary by using cubic smoothing spline, x ( l ) and x(l ) are the first and second derivative of x ( l ), respectively.
Afterwards, points with curvature less than a particular value are considered as the candidate points for beginning the separation through the dark path. Choosing the first point is very important and it affected the rest of the algorithm, so for choosing the first point of the dark path, beginning points with curvature less than -0.3 should be used. If such points do not exist, the reduction of threshold continues until a dark path is found. Reduction of threshold could be continued until lower band of -0.15.
By using the first points of dark path, the first direction is considered the bisector of boundary near the first point and by searching that direction, the pixel with the lowest grey matter is considered as the next point. The next direction of the path is defined by connecting the latter two points and searching the pixel with the lowest grey matter. Until finding a point with specific distance from boundary of cluster with a low curvature amount, this task is continued [1]. Fig. 8 shows the result of separating touching chromosomes through the dark path for some samples.
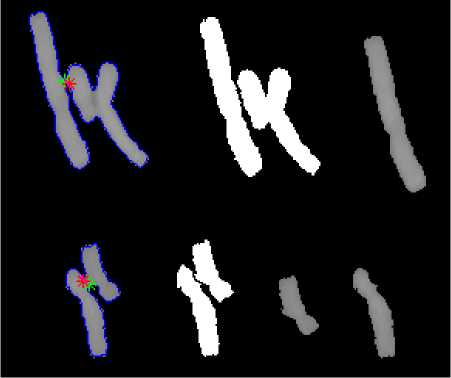
Fig. 8 Separation of touching chromosomes through dark path
Fig. 9 shows two geometric shapes used in this research to separate overlapping chromosomes.
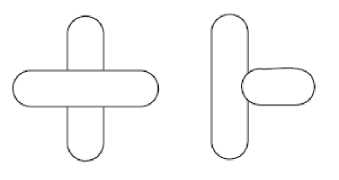
Fig. 9 Geometric shapes considered to separate overlapping clusters [4]
If three End points are found in the cluster, the right shape and if four the left one could be used. To separate single chromosomes by this method, other landmarks including cross points and cut points must be specified. Cross points are determined by finding branch points in the skeleton of each cluster. By knowing End points, the boundary of clusters is separated and in each part a Cut point related to Cross points is specified. Maximum number of Cut points related to each Xp, is set to 4 [4]. In Fig. 10, a cluster with 3 End points, the determined landmarks on it and also the result of separation are shown.
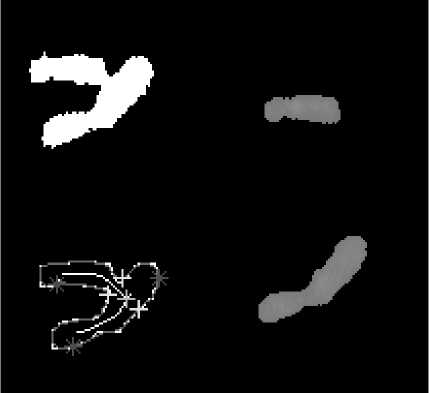
Fig. 10 A cluster with 3 end points and separation result
Each cluster with 3 End points has three possible ways for separation. These three possible ways for the cluster in Fig. 10 are shown in Fig. 11. The second way of separation which is shown in Fig. 11 is the best one and is chosen.
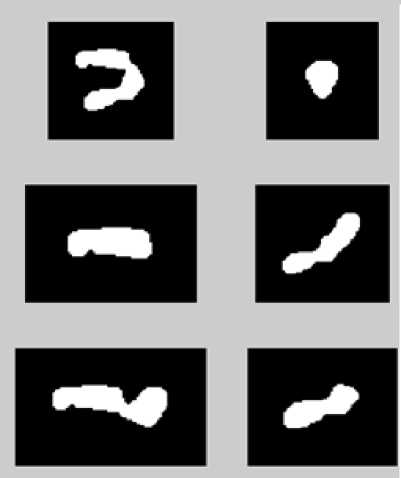
Fig. 11 Three possible ways for separation a cluster with 3 End points
Fig. 12 shows a cluster of two overlapping chromosomes by the landmarks determined on it and two single chromosomeswhich are separated by this method. Each cluster with four End points has two possible ways for separation and one of them that had the higher amount of criterion function is chosen.
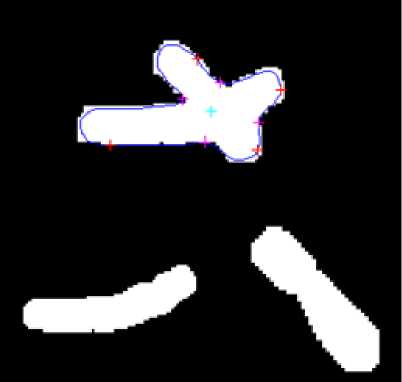
Fig. 12 A cluster by landmarks and two chromosomes separated
After this step if a cluster is separated in one or two different ways, the best separation is chosen by using a criterion function which investigates the similarity of separated chromosomes to single one.
In this research the criterion which is mentioned in (3) is used [2]. For using this criterion, first a single chromosome likelihood function, which is shown in (2), is used to evaluate the similarity of separated parts to single chromosomes.
0 not a single chromosome scl(c) =
< 9 - J k ( l )d l
10 - J k ( l )d l
Ac < ThrA cA otherwise
In (2), k ( l ) is the curvature of main axes of the cluster (as computed by (1)), A c is the area of the cluster, and Thr A is a threshold for the area that is considered 150 pixels which is selected by trial and error for our dataset.
The criterion function is shown in (3):
1 N
A ( cm ) = ® ilog(— Z scl ( ci )) + ® 2 M (3)
N i = 1
Where ω 1 = 0.2, ω 2 = 0.8, M are the split numbers and N is the number of chromosomes. At the end, the separation with the highest amount of A ( cm ) is chosen as the best one [2].
-
IV. Results
The proposed algorithm used geometric shape of clusters to separate single chromosomes from multichromosome clusters, dark paths to separate touching chromosomes and geometric shapes of clusters to separate overlapping ones.
Results of applying the proposed algorithm to 47 chromosome image dataset which was prepared at Medical Genetic Center of University of Isfahan contains a total of 1930 chromosome clusters and includes 60 touching clusters and 26 overlapping ones are shown in Table 1.
T able .1 T he R esults of the P roposed A lgorithm
|
Type |
Number |
Correct |
|
Single chromosome recognition |
1695 |
98.50% |
|
Overlap recognition |
235 |
86.40% |
|
Overlap separation |
26 |
67.0% |
|
Touching separation |
60 |
70.0% |
Using the proposed algorithm, clusters with more than one chromosome are recognized with the precision of 86.4% and separation of touching and overlapping chromosomes are done by the precision of 70% and 67% respectively. By using neural networks on the same dataset of Giemsa images, the result of 73% in recognition of clusters with more than one chromosome is obtained [5]. It shows that our proposed algorithm is more robust.
-
V. Conclusion
The advantage of using geometric shape is in its simplicity, but the proposed algorithm separates clusters only in one step and it could be developed to continue separation until it cannot separate clusters any more.
Acknowledgment
We would like to express our appreciation to Dr. Valian Borujeni, professor of genetic group in University of Isfahan for preparing the dataset and we would also like to thank the Medical Genetic Center of the University of Isfahan references.
References Using Shape Information and Dark Paths for Automatic Recognition of Touching and Overlapping Chromosomes in G-Band Images
- L. Ji, "Intelligent splitting in the chromosome domain", Pattern Recognition, Vol. 22, pp. 519-532, 1989.
- E. Grisan, E. Poletti, and A. Ruggeri, "Automatic Segmentation and Disentangling of Chromosomes in Q-Band Prometaphase Images", IEEE Transactions on Information Technology in Biomedicine, Vol. 13, pp. 575-581, 2009.
- B. Lerner, "Toward a completely automatic neural-network-based human chromosome analysis", IEEE Transactions on Systems, Man, and Cybernetics, Part B: Cybernetics, Vol. 28, pp. 544-552, 1998.
- H. Choi, A.C. Bovik, K.R. Castleman, "Maximum-Likelihood Decomposition of Overlapping and Touching M-Fish Chromosomes Using Geometry, Size and Color Information", IEEE 28th Annual International Conference of Engineering in Medicine and Biology Society (EMBS06), pp. 3130-3133, 2006.
- Y. Rahimi, R. Amirfattahi, and R. Ghaderi, "Design of a Neural Network Classifier for Separation of Images with One Chromosome from Images with Several Chromosomes", 3rd International Conference on Broadband Communications, Information Technology and Biomedical Applications, pp. 186-190, 2008.
- L. Ji, "Fully automatic chromosome segmentation", Cytometry, Vol. 17, pp. 196-208, 1994.
- W. Yan and X. Feng, "A Watershed Based Segmentation Method for Overlapping Chromosome Images", 2nd International Conferecne on Education Technology and Computer Science (ETCS), 2010.
- P.S. Karvelis, D.I. Fotiadis, I. Georgiou and M. Syrrou, "A watershed based segmentation method for multispectral chromosome images classification", IEEE 28th Annual International Conference of Engineering in Medicine and Biology Society (EMBS06), pp. 3009-3012, 2006.
- J. Liang, "Decomposition of overlapping chromosomes", In: C Lundsteen and J Piper (ed). Automation of Cytogenetics, Springer, Berlin. pp. 177-90, 1989b.
- G. Agam and I. Dinstein, "Geometric separation of partially overlapping nonrigid objects applied to automatic chromosome classification", IEEE Transaction on Pattern Analysis and Machine Inteeligence, Vol. 19, pp. 1212-22, 1997.
- M. Popescu, P. Gader, J. Keller, C. Klein, J. Stanley, C. Caldwell, "Automatic karyotyping of metaphase cells with overlapping chromosomes", Computers in Biology and Medicine, Vol. 29, pp. 61-82, 1999.
- G.C. Charters and J. Graham, "Trainable grey level models for disentangling overlapping chromosomes", Pattern Recognition, Vol. 32, pp.1335- 49, 1999.
- G.C. Charters and J. Graham, "Disentangling chromosome overlaps by combining trainable shape models with classification evidence", IEEE Transaction on Signal Processing, Vol. 50, pp. 2080-85, 2002.
