Utilization of Data Mining Techniques for Prediction and Diagnosis of Tuberculosis Disease Survivability

Author: K.R.Lakshmi, M.Veera Krishna, S.Prem Kumar
Journal: International Journal of Modern Education and Computer Science (IJMECS) @ijmecs
Article in issue: 8 vol.5, 2013.
Free access
The prediction and diagnosis of Tuberculosis survivability has been a challenging research problem for many researchers. Since the early dates of the related research, much advancement has been recorded in several related fields. For instance, thanks to innovative biomedical technologies, better explanatory prognostic factors are being measured and recorded; thanks to low cost computer hardware and software technologies, high volume better quality data is being collected and stored automatically; and finally thanks to better analytical methods, those voluminous data is being processed effectively and efficiently. Tuberculosis is one of the leading diseases for all people in developed countries including India. It is the most common cause of death in human being. The high incidence of Tuberculosis in all people has increased significantly in the last years. In this paper we have discussed various data mining approaches that have been utilized for Tuberculosis diagnosis and prognosis. This study paper summarizes various review and technical articles on Tuberculosis diagnosis and prognosis also we focus on current research being carried out using the data mining techniques to enhance the Tuberculosis diagnosis and prognosis. Here, we took advantage of those available technological advancements to develop the best prediction model for Tuberculosis survivability.
SVM, C4.5, k-NN, PLS-DA, Data mining techniques, Tuberculosis and Specificity
Short address: https://sciup.org/15014572
IDR: 15014572
Text of the scientific article Utilization of Data Mining Techniques for Prediction and Diagnosis of Tuberculosis Disease Survivability
Published Online October 2013 in MECS DOI: 10.5815/ijmecs.2013.08.02
D ata mining is a broad area that integrates techniques from several fields including machine learning, statistics, pattern recognition, artificial intelligence, and database systems, for the analysis of large volumes of data. There have been a large number of data mining algorithms rooted in these fields to perform different data analysis tasks. Data mining is the knowledge discovery process which helps in extracting interesting patterns from large amount of data. With the amount of data doubling every three years, data mining is becoming an increasingly important tool to transform these data into information. It is commonly used in a wide range of profiling practices, such as marketing, surveillance, and fraud detection, medical and scientific discovery. Humans have been manually extracting patterns from data for centuries, but the increasing volume of data in modern times has called for more automated approaches. As data sets have grown in size and complexity, direct hands-on data analysis has increasingly been augmented with indirect, automatic data processing. This has been aided by other discoveries in computer science, such as neural networks, clustering, genetic algorithms, decision trees and support vector machines. Data mining is the process of applying these methods to data with the intention of uncovering hidden patterns.
Many hospital information systems are designed to support patient billing, inventory management and generation of simple statistics. Some hospitals use decision support systems, but they are largely limited. They can answer simple queries like “What is the average age of patients who have heart disease?”, “How many surgeries had resulted in hospital stays longer than 10 days?”, “Identify the female patients who are single, above 30 years old, and who have been treated for cancer.” However, they cannot answer complex queries like “Identify the important Preoperative predictors that increase the length of hospital stay”, “Given patient records on cancer, should treatment include chemotherapy alone, radiation alone, or both chemotherapy and radiation?”, and “Given patient records, predict the probability of patients getting a heart disease”. Medical decisions are often made based on doctors‟ intuition and experience rather than on the knowledge- rich data hidden in the database. This practice leads to unwanted biases, errors and excessive medical costs which affects the quality of service provided to patients. Wu, et al proposed that integration of medical decision support with computer-based patient records could reduce medical errors, enhance patient safety, decrease unwanted practice variation, and improve patient outcome. This suggestion is promising as data modeling and analysis tools, e.g., data mining, have the potential to generate a knowledge-rich environment which can help to significantly improve the quality of medical decisions. A major challenge facing healthcare organizations (hospitals, medical centers) is the provision of quality services at affordable costs. Quality service implies diagnosing patients correctly and administering treatments that are effective. Poor clinical decisions can lead to disastrous consequences which are therefore unacceptable. Hospitals must also minimize the cost of clinical tests. They can achieve these results by employing appropriate computer-based information and/or decision support systems. Most hospitals today employ some sort of hospital information systems to manage their healthcare or patient data. These systems typically generate huge amounts of data which take the form of numbers, text, charts and images. Unfortunately, these data are rarely used to support clinical decision making. There is a wealth of hidden information in these data that is largely untapped. This raises an important question: “How can we turn data into useful information that can enable healthcare practitioners to make intelligent clinical decisions?” This is the main motivation for this preparation of the paper.
The advancement in computing technology, the reliability of computers, coupled with the development of easy-to-use but nevertheless sophisticated software has led to significant changes in the way that data are collected and analyzed. Computations has shifted from off-site main frames, dependent on highly trained operators and located in special rooms accessible only to certain authorized staff, to the more accessible desktop and laptop computers. This accessibility has resulted in an increasing number of researches in data mining in which hidden predictive information are extracted from large databases, using techniques from database research, artificial intelligence and statistics, to a wide variety of domains such as finance, manufacturing and medicine. Predictive and Diagnosis data mining in Medicine is a relatively new research area, which combines sophisticated representational and computing techniques with the insights of expert physicians to produce tools for improving health care. In future this work is extended by collecting real dataset in the clinical laboratory.
The effectiveness of models was tested using different data mining methods. The purpose is to determine which model gave the highest percentage of correct predictions for diagnosing patients with a major life threatening diseases. The purpose of this study is to investigate the use of different classifiers as tools for data mining, predictive modeling and data processing in the prognosis of diseases. The goal of any modeling exercise or the best technique is to extract as much information as possible from available data and provide an accurate representation of both the knowledge and uncertainty about the epidemic.
The prediction of life threatening diseases survivability has been a challenging research problem for many researchers. Since the early dates of the related research, much advancement has been recorded in several related fields. For instance, thanks to innovative biomedical technologies, better explanatory prognostic factors are being measured and recorded; thanks to low cost computer hardware and software technologies, high volume better quality data is being collected and stored automatically; and finally thanks to better analytical methods, those voluminous data is being processed effectively and efficiently. Therefore, the main objective of this thesis is to report on a research where we took advantage of those available technological advancements to develop prediction models for breast cancer survivability.
Tuberculosis (TB) is a common and often deadly infectious disease caused by mycobacterium; in humans it is mainly Mycobacterium tuberculosis. It usually spreads through the air and attacks low immune bodies such as patients with Human Immunodeficiency Virus (HIV). It is a disease which can affect virtually all organs, not sparing even the relatively inaccessible sites. The microorganisms usually enter the body by inhalation through the lungs. They spread from the initial location in the lungs to other parts of the body via the blood stream. They present a diagnostic dilemma even for physicians with a great deal of experience in this disease. Hence Tuberculosis (TB) is a contagious bacterial disease caused by mycobacterium which affects usually lungs and is often co-infected with HIV/AIDS. It is a great problem for most developing countries because of the low diagnosis and treatment opportunities. Tuberculosis has the highest mortality level among the diseases caused by a single type of microorganism. Thus, tuberculosis is a great health concern all over the world, and in India as well (wikipedia.org). Symptoms of TB depend on where in the body the TB bacteria are growing. TB bacteria usually grow in the lungs. TB in the lungs may cause symptoms such as a bad cough that lasts 3 weeks or longer pain in the chest coughing up blood or sputum. Other symptoms of active TB disease are: weakness or fatigue, weight loss, no appetite, chills, fever and sweating at night. Although common and deadly in the third world, Tuberculosis was almost nonexistent in the developed world, but has been making a recent resurgence. Certain drug-resistant strains are emerging and people with immune suppression such as AIDS or poor health are becoming carriers. In this paper, we studied various review and technical articles on Tuberculosis diagnosis and prognosis also we focus on current research being carried out using the data mining techniques to enhance the Tuberculosis diagnosis and prognosis. We took advantage of those available technological advancements to develop the best prediction model for Tuberculosis survivability.
-
II. Review of the related literature
Tuberculosis is serious worldwide problem caused by bacterium who suffer from this disease may die unless they given right treatment[1].Tuberculosis (TB) is the most common cause of infectious disease and caused by various strains of mycobacterium. It mostly affects the lungs and other parts of the body. The World Health Organization (WHO) reports that 2 billion people are suffering from TB, in 2009, and kills 1.7 million people. Data classification process using knowledge obtained from known historical data has been one of the most intensively studied subjects in statistics, decision science and computer science. Data mining techniques have been applied to medical services in several areas, including prediction of effectiveness of surgical procedures, medical tests, medication, and the discovery of relationships among clinical and diagnosis data. In order to help the clinicians in diagnosing the type of disease computerized data mining and decision support tools are used which are able to help clinicians to process a huge amount of data available from solving previous cases and suggest the probable diagnosis based on the values of several important attributes Ensemble of classifiers has been proved to be very effective way to improve classification accuracy because uncorrelated errors made by a single classifier can be removed by voting. A classifier which utilizes a single minimal set of classification rules to classify future examples may lead to mistakes. An ensemble of classifiers is a set of classifiers whose individual decisions are combined in some way to classify new example. Many research results illustrated that such multiple classifiers, if appropriately combined during classification, can improve the classification accuracy. India has the world’s highest burden of tuberculosis (TB) with million estimated incident cases per year. It also ranks among the world’s highest HIV burden with an estimated 2.3 million persons living with HIV/AIDS. Tuberculosis is much more likely to be a fatal disease among HIV-infected persons than persons without HIV infection . It is a disease caused by mycobacterium which can affect virtually all organs, not sparing even the relatively inaccessible sites. The microorganisms usually enter the body by inhalation through the lungs. They spread from the initial location in the lungs to other parts of the body via the blood stream. They present a diagnostic dilemma even for physicians with a great deal of experience in this disease.
Minou Rabiei et.al.[3] use tree based ensemble classifiers for the diagnosis of excess water production. Their results demonstrate the applicability of this technique in successful diagnosis of water production problems. Hongqi Li, Haifeng Guo and team present[4] a comprehensive comparative study on petroleum exploration and production using five feature selection methods including expert judgment, CFS, LVF, Relief-F, and SVMRFE, and fourteen algorithms from five distinct kinds of classification methods including decision tree, artificial neural network, support vector machines(SVM), Bayesian network and ensemble learning. Zhenzheng Ouyang, Min Zhou, Tao Wang, Quanyuan Wu[5] propose a method, called WEAP-I, which trains a weighted ensemble classifier on the most n data chunks and trains an averaging ensemble classifier on the most recent data chunk. All the base classifiers are combined to form the WEAP-I ensemble classifier. Orhan Er. And temuritus[6] present a study on tuberculosis diagnosis, carried out with the help of multilayer neural networks (MLNNs). For this purpose, an MLNN with two hidden layers and a genetic algorithm for training algorithm has been used. Data mining approach was adopted to classify genotype of mycobacterium tuberculosis using c4.5 algorithm [7]. Evaluation of the performance of two decision tree procedures and four Bayesian network classifiers as potential decision support systems in the cytodiagnosis of breast cancer was carried out [8]. Paper on “Mining Several Data Bases with an Ensemble of Classifiers” [9] analyze the two types of conflicts, one created by data inconsistency within the area of the intersection of the data bases and the second is created when the meta method selects different data mining methods with inconsistent competence maps for the objects of the intersected part and their combinations and suggest ways to handle them. Referenced paper [10] studies medical data classification methods, comparing decision tree and system reconstruction analysis as applied to heart disease medical data mining. Under most circumstances, single classifiers, such as neural networks, support vector machines and decision trees, exhibit worst performance. In order to further enhance performance combination of these methods in a multi-level combination scheme was proposed that improves efficiency [11]. Paper [12] demonstrates the use of adductive network classifier committees trained on different features for improving classification accuracy in medical diagnosis. Paper on “MReC4.5: C4.5 ensemble classification with Map Reduce” [13] takes the advantages of C4.5, ensemble learning and the Map Reduce computing model, and proposes a new method MReC4.5 for parallel and distributed ensemble classification. Seppo Puuronen and team [14] propose a similarity evaluation technique that uses a training set consisting predicates that define relationships within the three sets: the set of instances, the set of classes, and the set of classifiers. Lei Chen and Mohamed S. Kamel [15] propose the scheme of Multiple Input Representation-Adaptive Ensemble Generation and Aggregation (MIR-AEGA) for the classification of time series data. Kai Jiang et.al.[16] propose a neural network ensemble model for classification of incomplete data. In the method, the incomplete dataset is divided into a group of complete sub datasets, which is then used as the training sets for the neural networks. Recently Asha et.al [2] discussed the comparison of classification techniques for TB based on two categories namely pulmonary tuberculosis (PTB) and retroviral PTB using ensemble classifiers such as Bagging, AdaBoost and Random forest trees.
-
III. Methodology
-
3.1 LDA
-
3.2 SVM
-
3.3 C4.5
We describe some Classification techniques. Classification is a data mining (machine learning) technique used to predict group membership for data instances. Classification analysis is the organization of data in given class. These approaches normally use a training set where all objects are already associated with known class labels. The classification algorithm learns from the training set and builds a model. Many classification models are used to classify new objects.
Discriminant Analysis (LDA) is a supervised learning algorithm. LDA methods are used in statistics, pattern recognition and machine learning to find a linear combination of features. The idea behind LDA is simple, for each class to be identified, calculate linear function of the attributes. The class function having highest score is treated as the predicted class. It is a statistical classification algorithm which is used to classify the values based on the linear combination among values. Linear Discriminate Analysis perfectly handles the data within class frequencies are unequal. LDA also evaluates the performances for randomly generated test data. The LDA Algorithm maximizes the ratio of between-class variance to the within-class variance in any particular data set thereby guaranteeing maximal reparability. The use of Linear Discriminate Analysis for data classification is widely used to classify many biological data sets such cancer, colon cancer, HIV analysis etc. In LDA based classification the data sets can be transformed and test vectors can be classified in two different approaches.
Transformation with class dependency: This type of approach involves maximizing the ratio of between class variance to within class variance. The main objective is to maximize this ratio so that adequate class reparability is obtained. The class-specific type approach involves using two optimizing criteria for transforming the data sets independently.
Transformation with class independency: This approach involves maximizing the ratio of overall variance to within class variance. This approach uses only one optimizing criterion to transform the data sets and hence all data points irrespective of their class identity are transformed using this transform. In this type of LDA, each class is considered as a separate class against all other classes.
Support Vector Machine is a type of classification method, which estimates the classification function. SVM is a set of related supervised learning methods that analyze data and recognize patterns, used for classification. Support Vector Machine ( SVM ) is a nonlinear classifier method which is often reported as producing better classification results compared to other methods. The main idea of SVM is to construct a hyper plane as a decision surface in such a way that the margin of separation between positive and negative examples is maximized. This process non-linearly map the input sample data to some high dimensional space, where the data can be linearly separated, thus providing higher classification (or regression) accuracy. SVMs are rather interesting in that they enjoy both a sound theoretical basis as well as state-of-the-art success in real-world applications, especially in Bioinformatics.
C4.5 algorithm is a greedy algorithm developed by Ross Quinlan, used for the induction of decision trees. C4.5 is a successor of ID3 algorithm. The decision trees generated by C4.5 adopt greedy approach in which decision trees are constructed in top-down recursive divide-and-conquer manner. C4.5 is often referred to as a statistical classifier. Like ID3, C4.5 builds decision trees from training data set, using the concept of information entropy. The decision tree algorithm C4.5 is developed from ID3 in the following ways: Handling missing data, handling continuous data, and pruning, generating rules, and splitting. For splitting purpose, C4.5 uses the Gain Ratio instead of Information Gain. C4.5 algorithm uses an attribute selection measure to select the attribute tested for each non leaf node in the tree. The highest normalized information gain attribute is chosen to make the decision.
Gain Ratio (D, S) = Gain (D, S)/ Split INFO (1)
Where, Split INFO = - 1 ]T Dj log2 D 1 (2)
-
3.4 k -NN
-
3.5 BLR
-
3.6 Multinomial Logistic Regression (MLR)
-
3.7 PLS-DA
It is the nearest neighbor algorithm. The k-nearest neighbor’s algorithm is a technique for classifying objects based on the next training data in the feature space. It is among simplest of all mechanism learning algorithms [30]. The algorithm operates on a set of d-dimensional vectors, D = {xi | i = 1. . . N}, where xi ∈ kd denotes the i th data point. The algorithm is initialized by selection k points in kd as the initial k cluster representatives or “Centroids”. Techniques for select these primary seeds include sampling at random from the dataset, setting them as the solution of clustering a small subset of the data or perturbing the global mean of the data k times. Then the algorithm iterates between two steps till junction:
Step 1: Data Assignment each data point is assign to its adjoining centroid, with ties broken arbitrarily. This results in a partitioning of the data.
Step 2: Relocation of “means”. Each group represent- tative is relocating to the center (mean) of all data points assign to it. If the data points come with a possibility measure (Weights), then the relocation is to the expectations (weighted mean) of the data partitions.
Predictive analysis in health care primarily to determine which patients are at risk of developing certain conditions, like diabetes, asthma, heart disease and other lifetime illnesses. Additionally, sophisticated clinical decision support systems incorporate predictive analytics to support medical decision making at the point of care. Logistic regression is a generalization of linear regression. It is used primarily for predicting binary or multi-class dependent variables.
A multinomial logit (MNL) model, also known as multinomial logistic regression, is a regression model which generalizes logistic regression by allowing more than two discrete outcomes. That is, it is a model that is used to predict the probabilities of the different possible outcomes of a categorically distributed dependent variable given a set of independent variables (which may be real-valued, binary-valued, categorical-valued, etc.). An extension of the binary logistic model cases where the dependent variable has more than two categories is the multinomial logistic Regression. In such cases collapsing the data into two categories not make good sense or lead to loss in the richness of the data. The multinomial legit model is the appropriate technique in these cases, especially when the dependent variable categories are not ordered.
PLS Regression for Classification Task PLS (Partial Least Squares Regression) Regression can be viewed as a multivariate regression framework where to predict the values of several PLS-LDA (Partial Least squares-Linear Discriminant Analysis target variables (Y 1 , Y 2 …) from the values of several input variables (X 1 , X 2 ,…). The algorithm use three axis for the diabetes disease is the following: The components of X are used to predict the scores on the Y components, and the predicted Y component scores are used to predict the actual values of the Y variables. In constructing the principal components of X, the PLS algorithm iteratively maximizes the strength of the relation of successive pairs of X and Y component scores by maximizing the covariance of each X-score with the Y variables. The PLS Regression is initially defined for the prediction of continuous target variable. But it seems it can be useful in the supervised learning problem where we want to predict the values of discrete attributes. We propose a few variants of PLS Regression adapted to the prediction of discrete variable. The generic name "PLS-DA" (Partial Least Square Discriminant Analysis) is often used in the Methodology.
-
3.8 The k -means algorithm
-
3.9 Entropy based Mean Clustering (EMC) algorithm:
-
3.10 The Apriori algorithm
The k-means algorithm is a simple iterative method to partition a given dataset into a specified number of clusters, k . This algorithm has been discovered by several researchers across different disciplines. A detailed history of k -means along with descriptions of several variations is given in [40]. Gray and Neuhoff [39] provide a nice historical background for k -means placed in the larger context of hill-climbing algorithms. The algorithm operates on a set of d -dimensional vectors, D = { xi | i = 1 , . . . , N }, where xi ∈ R d denotes the i th data point. The algorithm is initialized by picking k points in R d as the initial k cluster representatives or “centroids”. Techniques for selecting these initial seeds include sampling at random from the dataset, setting them as the solution of clustering a small subset of the data or perturbing the global mean of the data k times. Then the algorithm iterates between two steps till convergence:
Step 1): Data Assignment. Each data point is assigned to its closest centroid, with ties broken arbitrarily. This results in a partitioning of the data.
Step 2): Relocation of “means”. Each cluster represent- tative is relocated to the center (mean) of all data points assigned to it. If the data points come with a probability measure (weights), then the relocation is to the expectations (weighted mean) of the data partitions.
The Entropy based Mean Clustering algorithm (EMC) is extension to the K mean algorithm, reduces the number of iterations during the clustering process. It works on three phases. In the first phase it computes the main points of the each seed (element or item) in the data set and then arranges the seed elements in the order of their seed entropy (For example 1-10,2-5,3-9,4-6,5-1, then it arranges the data as 1,3,4,2,5 .i.e. data arranged ascending order of the entropy). In the second phase, it makes the candidate set, this candidate set is unique in nature, It does not consisting of duplicated elements. In the third phase the clustering was applied on the Euclidian distances, and remaining elements, which were not in candidate sets were placed in according to the native elements, were resided.
One of the most popular data mining approaches is to find frequent item sets from a transaction dataset and derive association rules. A finding frequent item set (item sets with frequency larger than or equal to a user specified minimum support) is not trivial because of its combinatorial explosion. Once frequent item sets are obtained, it is straightforward to generate association rules with confidence larger than or equal to a user specified minimum confidence. Apriori is a seminal algorithm for finding frequent item sets using candidate generation. It is characterized as a level-wise complete search algorithm using anti-monotonicity of item sets, “if an item set is not frequent, any of its superset is never frequent”. By convention, Apriori assumes that items within a transaction or item set are sorted in lexicographic order. Let the set of frequent item sets of size k be F k and their candidates be C k . Apriori first scans the database and searches for frequent item sets of size 1 by accumulating the count for each item and collecting those that satisfy the minimum support requirement. It then iterates on the following three steps and extracts all the frequent item sets.
-
1) . Generate Ck+1, candidates of frequent item sets of size k +1, from the frequent item sets of size k.
-
2) . Scan the database and calculate the support of each candidate of frequent item sets.
-
3) . Add that items set that satisfies the minimum support requirement to Fk+1.
Function Apriori generates C k+1 from F k in the following two step process:
-
1) . Join step: Generate RK+1, the initial candidates of frequent item sets of size k + 1 by taking the union of the two frequent item sets of size k, P k and Q k that have the first k-1 elements in common.
RK+1 = Pk ∪ Qk ={item1 , item2, . . . , itemk-1, itemk, itemk’ }(3)
Pk = {item1, item2, . . . , itemk-1, itemk }(4)
Qk = {item1, item2, . . . , itemk-1, itemk’ }(5)
where, item1 < item2 < · · · < itemk < itemk’_ .
-
2) . Prune step: Check if all the item sets of size k in Rk+1 are frequent and generate Ck+1 by removing those
that do not pass this requirement from R k+1 . This is because any subset of size k of C k+1 that is not frequent cannot be a subset of a frequent item set of size k + 1. Function subset finds all the candidates of the frequent item sets included in transaction t. Apriori, then, calculates frequency only for those candidates generated this way by scanning the database. It is evident that Apriori scans the database at most k max +1 times when the maximum size of frequent item sets is set at k max .
-
IV. Data Analysis
The medical dataset we are using includes 700 real records of patients suffering from TB obtained from a Osmania hospital Hyderabad, Andhra Pradesh, India. The entire dataset is put in one file having many records. Each record corresponds to most relevant information of one patient. Initial queries by doctor as symptoms and some required test details of patients have been considered as main attributes. Totally there are 12 attributes (symptoms) and last attribute is considered as class in case of Associative Classification. The symptoms of each patient such as age, chronic cough(weeks), loss of weight, intermittent fever(days), night sweats, Sputum, Blood cough, chest pain, HIV, radiographic findings, wheezing and TB type are considered as attributes. Table 1 shows names of 12 attributes considered along with their Data Types (DT). Type N indicates numerical and C is categorical.
Table 1: List of Attributes and their Data types
|
S.N o. |
Name |
DT |
|
1 |
Age |
N |
|
2 |
Chronic cough (weeks) |
N |
|
3 |
Weight loss |
C |
|
4 |
Intermittent fever(days) |
N |
|
5 |
Nights weats |
C |
|
6 |
Blood cough |
C |
|
7 |
Chest pain |
C |
|
8 |
HIV |
C |
|
9 |
Radiographic findings |
C |
|
10 |
Sputum |
C |
|
11 |
wheezing |
C |
|
12 |
TB Type |
C |
In order to validate the prediction results of the comparison of the ten popular data mining techniques and the 10-fold crossover validation is used. The k-fold crossover validation is usually used to reduce the error resulted from random sampling in the comparison of the accuracies of a number of prediction models. The entire set of data is randomly divided into k folds with the same number of cases in each fold. The training and testing are performed for k times and one fold is selected for further testing while the rest are selected for further training. The present study divided the data into 10 folds where 1 fold was for testing and 9 folds were for training for the 10-fold crossover validation. These diagnostic results of each patient’s record in above dataset consist of ten variables that are summarized in Table 1. Each instance consists of nine measurements without considering the patient number, namely Age, chronic cough (weeks), weight loss, intermittent fever (days), nights weats, Blood cough, chest pain, HIV, Radiographic findings, Sputum, wheezing and TB Type. The measurements are assigned an integer value between 1 and 10, with 1 being the closest to benign and 10 the most anapestic. One of the 10 variables is the response variable representing the diagnostic status of the patient with or without tuberculosis (i.e. malignant or benign). The training data are selected from the whole dataset randomly and directly fed into the proposed mining approach.
-
V. Computational Results and Discussion
The basic phenomenon used to classify the Tuberculosis disease classification using classifier is its performance and accuracy. The performance of a chosen classifier is validated based on error rate and computation time. The classification accuracy is predicted in terms of Sensitivity and Specificity. The computation time is noted for each classifier is taken in to account. Classification Matrix displays the frequency of correct and incorrect predictions. It compares the actual values in the test dataset with the predicted values in the trained model. In this example, the test dataset contained 458 patients with Tuberculosis disease and 242 patients without Tuberculosis disease.
Table 2: confusion matrix
|
Predicted |
Classified as Healthy (0) |
Classifie d as not Healthy (1) |
|
Actual Healthy (0) |
TP |
FN |
|
Actual not Healthy (1) |
FP |
TN |
Table (2) shows the results of the Classification Matrix for all the ten models. The rows represent predicted values while the columns represent actual values (1 for patients with Tuberculosis, 0 for patients with no Tuberculosis). The left-most columns show values predicted by the models. The diagonal values show correct predictions. For Classification, this work constructed Confusion Matrix for the frequency of correct and incorrect predictions. From the confusion matrix, the Specificity, Sensitivity, Accuracy Rate and Error rate have been calculated. For measuring accuracy rate and Error Rate, the following mathematical model is used.
TP
Sensitivity (Recall) =
TP + FN
TN
Specificity = (7)
FP + TN
Accuracy =
TP + FN
TP + FP + TN + FN
FP
Positive Precision =
TP + FP
Negative Precision =
FN
TN + FN
Error Rate =
FP + FN
TP + FP + TN + FN
The software framework of this work has been developed with Tanagra tool. The Entropy based mean Clustering is developed using Advanced Java.
-
5.1. Performance study of algorithms
The table (3) consists of values of different classification. According to these values the lowest computing time (<950ms) can be determined. LDA, SVM, C4.5, k -NN, BLR, MLR, PLS-LDA, k -means, EMC and Apriori in a lowest computing time that, we have experimented with a dataset. A distinguished confusion matrix was obtained to calculate sensitivity, specificity and accuracy. From the confusion matrix to analyze the performance criterion for the classifiers in disease detection accuracy, precision, recall have been computed for all datasets. Accuracy is the percentage of predictions that are correct. The precision is the measure of accuracy provided that a specific class has been predicted. Recall is the percentage of positive labeled instances that were predicted as positive.
Step 1 : The ten algorithms can be filtered by using lowest computing time (<1200ms). The ten can be reduced nine algorithms namely (SVM, C4.5, k -NN, BLR, MLR, PLS-LDA, k -means, EMC and Apriori).
Step 2 : The above algorithms can filtered by using positive precision values. If the precision value is less than 0.05, then we get the six algorithms namely ( k -NN, BLR, MLR, PLS-LDA, k -means and EMC).
Step 3 : The above algorithms can filter by using Cross Validation Error rate (< 0.06) i.e. lowest error rate. The above six algorithms can be reduced. We get five algorithms namely (BLR, MLR, PLS-LDA, k -means and EMC).
Step 4 : The above algorithms can filter by using Bootstrap Validation Error rate (< 0.29) i.e. lowest error rate. The above five algorithms can be reduced. We get three algorithms namely (BLR, PLS-LDA, and EMC).
Step 5 : The above algorithms can filter by using highest accuracy and lowest computing time. The above three algorithms can be reduced to one. We get best one for PLS-DA.
Step 6 : Stop the process. We get the best one.
The step (5) consists of values of different classification. According to these values the accuracy was calculated. From figures (1-3) represents the resultant values of above classified dataset using data mining supervised classification algorithms and it shows the highest accuracy and lowest computing among the three. It is logical from chart that compared on basis of performance and computing time, precision value, Error rate (10 fold Cross Validation, Bootstrap Validation) and finally the highest accuracy and again lowest computing time. PLS-DA algorithm shows the superior performance compared to other algorithms.
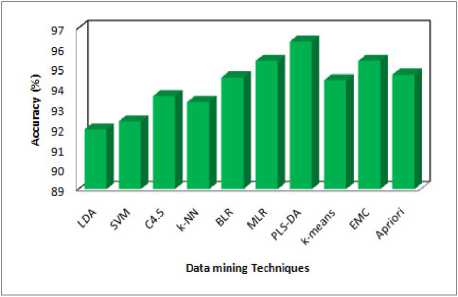
Fig 1: Predicted Accuracy
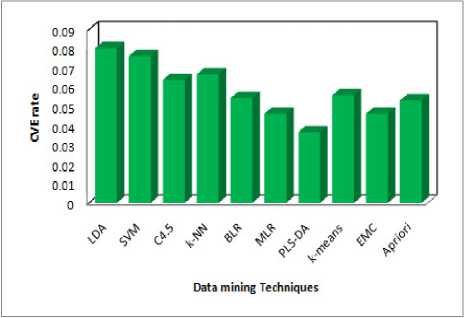
Fig 2: Performance of Cross Validation Error Rate
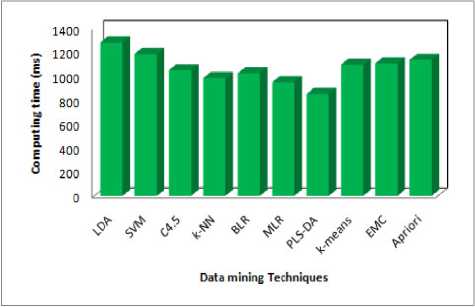
Fig 3: Performance of Computing Time
-
VI. Conclusions
The main goal medical data mining algorithm is to get best algorithms that describe given data from multiple aspects. The algorithms are very necessary for intend an automatic classification tools. The PLS-DA was the best one among ten (five criteria are satisfied). Three axis are used the redundancy cut value is 0.025, positive and negative values are predicted based on the recall and 1-precision values. It can be classified as function as positive and negative and finally constant value of positive and negative. The first one is computing time in 852 milliseconds it is the lowest, second one is Cross Validation error rate is 0.0367, If the precision value is less than 0.05, fourth one Bootstrap Validation error rate is 0.2254 lowest (i.e. repetition is 1, test error rate 0.2289, Bootstrap, Bootstrap+) compare to others and finally three values(Accuracy, Specificity and Sensitivity) are calculated by using formula and the prediction one is Accuracy .Then the Accuracy of PLS-DA is 96.3215% from the above results PLS-DA algorithm plays a vital role in data mining techniques. PLS-DA shows better results. The performance of PLS-DA shows the high level compare with other classifiers. Hence PLS-DA shows the concrete results with Tuberculosis disease of patient records. Therefore PLS-DA classifier is suggested for Tuberculosis disease based classification to get better results with accuracy and performance.
Acknowledgments
References Utilization of Data Mining Techniques for Prediction and Diagnosis of Tuberculosis Disease Survivability
- Tamer Uçar a, Adem Karahocaa, “Predicting existence of Mycobacterium tuberculosis on patients using data mining approaches”, CiteseerX, Vol. 3, No. 0, 2011.
- Asha.T, S. Natarajan and K.N.B. Murthy, “Diagnosis of Tuberculosis using Ensemble methods”, IEEE, 2010, 978-1-4244-5539-3/10.
- Minou Rabiei, Ritu Gupta “Excess Water Production Diagnosis in Oil Fields using Ensemble Classifiers” IEEE, 2009.
- Hongqi Li, Haifeng Guo, Haimin Guo and Zhaoxu Meng “Data Mining Techniques for Complex Formation Evaluation in Petroleum Exploration and Production: A Comparison of Feature Selection and Classification Methods” in proceedings of 2008 IEEE Pacific-Asia, Workshop on Computational Intelligence and Industrial Application, Vol. 1, pp. 37-43.
- Zhenzheng Ouyang, Min Zhou, Tao Wang and Quanyuan Wu, “Mining Concept-Drifting and Noisy Data Streams using Ensemble Classifiers”, International Conference on Artificial Intelligence and Computational Intelligence, Nov. 2009, pp. 360-364.
- Orhan Er, Feyzullah Temurtas and A.C. Tantrikulu, “Tuberculosis disease diagnosis using Artificial Neural networks ”, Journal of Medical Systems, Springer, 2008, DOI 10.1007/s10916-008-9241-x online.
- M. Sebban, I. Mokrousov, N. Rastogi and C. Sola “A data-mining approach to spacer oligo nucleotide typing of Mycobacterium tuberculosis” Bioinformatics, oxford university press, Vol. 18, Issue 2, 2002, pp. 235-243.
- Nicandro Cruz-Ram_rez, Hector-Gabriel Acosta-Mesa , Humberto Carrillo-Calvet , Roc_o-Erandi Barrientos-Mart_nez, “Discovering interobserver variability in the cytodiagnosis of breast cancer using decision trees and Bayesian networks” Applied Soft Computing, Elsevier, Vol. 9, Issue 4, September 2009, pp. 1331-1342.
- Seppo Puuronen, Vagan Terziyan and Alexander Logvinovsky, “Mining Several Data Bases With an Ensemble of Classifiers” in Proc. 10th International Conference on Database and Expert Systems Applications, Vol. 1, No. 7, 1999, pp. 882-891.
- Tzung-I Tang,Gang Zheng ,Yalou Huang ,Guangfu Shu, “A Comparative Study of Medical Data Classification Methods Based on Decision Tree and System Reconstruction Analysis”, IEMS, Vol. 4, Issue 1, June 2005, pp. 102-108.
- Tsirogiannis, G.L. Frossyniotis, D. Stoitsis, J. Golemati, S. Stafylopatis, A. Nikita, K.S., “Classification of medical data with a robust multi-level combination scheme” in Proceeding of 2004 IEEE International Joint Conference on Neural Networks, Vol. 3, 25-29 July 2004, pp. 2483- 2487.
- R.E. Abdel-Aal, “Improved classification of medical data using adductive network committees trained on different feature subsets”, Computer Methods and Programs in Biomedicine, Volume 80, Issue 2, 2005, pp. 141-153.
- Gongqing Wu, Haiguang Li, Xuegang Hu, Yuanjun Bi, Jing Zhang and Xindong Wu “MReC4.5: C4.5 ensemble classification with MapReduce”, in Proceeding of 2009 Fourth ChinaGrid Annual Conference, 2009, pp. 249-255.
- Seppo Puuronen and Vagan Terziyan “A Similarity Evaluation Technique for Data Mining with an Ensemble of classifiers”, Cooperative Information Agents III, Third International Workshop, CIA, 1999, pp. 163-174.
- Lei Chen and Mohamed S. Kamel “New Design of Multiple Classifier System and its Application to the time series data” IEEE International Conference on Systems, Man and Cybernetics, 2007, pp. 385-391.
- Kai Jiang, Haixia Chen, Senmiao Yuan “Classification for Incomplete Data Using Classifier Ensembles”, Neural Networks and Brain, 2005.
