Video Watermarking – Combination of Discrete Wavelet & Cosine Transform to Achieve Extra Robustness

Автор: Ashish M. Kothari, Ved Vyas Dwivedi
Журнал: International Journal of Image, Graphics and Signal Processing(IJIGSP) @ijigsp
Статья в выпуске: 3 vol.5, 2013 года.
Бесплатный доступ
In this paper we worked on the video watermarking technique wherein we took video as a cover medium and some binary images as watermark to be embedded behind the video. Specifically we concentrated on the transform domain technique and we made use of hybridization of the two of the most important and useful transformations, namely Discrete Wavelet Transform and Discrete Cosine Transform, for the purpose of digital watermarking. We evaluated the proposed method with some visual quality matrices and based on the results we concluded that the proposed method provides extra robustness against various attacks as compare to individual use of each transform.
Discrete Cosine Transform, Discrete Wavelet Transform, Copyright protection, Robustness, Digital video watermarking
Короткий адрес: https://sciup.org/15012578
IDR: 15012578
Текст научной статьи Video Watermarking – Combination of Discrete Wavelet & Cosine Transform to Achieve Extra Robustness
Digital Watermarking is the technique of embedding a secret message or digital logo behind a cover medium. Cover medium can be image, text, audio or video and message can be image, audio or text. Digital watermarking is having its application in the areas of copyright protection and the authentication. In this era of internet and online transfer of the data, use of video watermarking is rapidly increasing because of the factors [1] explained below.
-
• Privacy of the digital data is required and because the copying of a video is comparatively very easy.
-
• Fighting against the “Intellectual property rights breach”
-
• Tempering of the digital video must be concealed.
-
• Copyright protection must not be eroded.
This paper focuses on the frequency characteristics of the 2-D data and makes use of two of the most prominent transforms applied on the 2-D images, namely Discrete Cosine Transform and the Discrete Wavelet Transform. In this paper we first converted video into the sequence of frames. The second step is to convert the RGB frame into its YCbCr version and then we made use of Y frame for the purpose of watermarking. This paper is organized in seven sections. Subsequent section explains the transform domain watermarking method. Section 3 and 4 explains the fundamentals of DCT and DWT. Section 5 shows the visual quality metrics used for evaluation purpose. Section 6 explains the proposed method and section 7 gives the results of proposed method.
-
II. T ransform domain watermarking
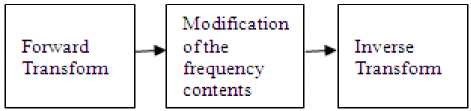
Embedding watermark into the video can be done in two ways namely spatial domain and transform domain [2]. In the spatial domain frame pixel values are modified according to the pixel values of the message to be hidden behind the frame where as in the transform domain frame pixel values are changed in the frequency domain according to the pixel values of the message. Transform domain watermarking makes use of various transforms like Discrete Fourier Transform (DFT), Discrete Wavelet Transform (DWT), Discrete Cosine Transform (DCT) and other. Out of these transforms DCT and DWT are the most frequently used transforms because of their enormous capacity to break the image data into various frequency bands. According to priorities of the human visual system, we can choose one of the frequency bands to be used for embedding purpose. Figure 1 shows the idea of transform domain processing of the image data.
-
III. D iscrete C osine T ransform
Discrete cosine transformation [3, 4, 5, 6] (DCT) transforms a signal from the spatial into the frequency domain by using the cosine waveform. DCT concentrates the information energy in the bands with low frequency, and therefore shows its popularity in digital watermarking techniques. The DCT allows a frame to be broken up into different frequency bands, making it much easier to embed watermarking information into the middle frequency bands of a frame. The middle frequency bands are chosen such that they have minimize to avoid the most visual important parts of the frame (low frequencies) without over-exposing themselves to removal through compression and noise attacks (high frequencies).
Two dimensional DCT of a frame with size MxN and its inverse DCT (IDCT) are defined in Equations 1 and 2, respectively.
F ( и ,v)=
a ( и ) a (v)∑ ∑ ( x , У ) соѕ [ ( гть ) ∙ ] соѕ [ ( 2У" ) ∙ ] (1)
Where а ( и )=√1/ М for u=0;
а ( и )=√2/ М for u=1,2,3,…..M-1;
а (v)=√1/ N for v=0;
а (v)=√2/ N for v=1,2,3,…..N-1;
/( X , У )=
∑ ∑ V» « ( и ) а (v) F ( и ,V ) соѕ [ ( 2Ть ) ∙ ] соѕ [ ( 2Z ) ∙ ] (2)
Where x = 0,1,2,……..M-1, y = 0,1,2,……..N-1
Figure 3(a) shows the three regions in the frequency domain. F L is used to denote the lowest frequency components of the block, while F H is used to denote the higher frequency components. F M is chosen as the embedding region as to provide additional resistance to lossy compression techniques, while avoiding significant modification of the cover video.
|
Fl |
Fl |
Fl |
Fm |
Fm |
Fm |
Fm |
Fh |
16 |
11 |
10 |
26 |
24 |
40 |
51 |
61 |
|
Fl |
Fl |
Fm |
Fm |
Fm |
Fm |
Fh |
Fh |
12 |
14 |
55 |
60 |
55 |
|||
|
Fl |
Fm |
Fm |
Fm |
Fm |
Fh |
Fh |
Fh |
14 |
13 |
16 |
24 |
40 |
57 |
69 |
56 |
|
Fm |
Fm |
Fm |
Fm |
Fh |
Fh |
Fh |
Fh |
14 |
22 |
29 |
51 |
87 |
80 |
62 |
|
|
Fm |
Fm |
Fm |
Fh |
Fh |
Fh |
Fh |
Fh |
ie |
22 |
37 |
68 |
109 |
103 |
||
|
Fm |
Fm |
Fh |
Fh |
Fh |
Fh |
Fh |
Fh |
24 |
35 |
55 |
64 |
81 |
104 |
113 |
92 |
|
Fm |
Fh |
Fh |
Fh |
Fh |
Fh |
Fh |
Fh |
49 |
64 |
76 |
67 |
103 |
121 |
120 |
101 |
|
Fh |
Fh |
Fh |
Fh |
Fh |
Fh |
Fh |
Fh |
72 |
92 |
95 |
98 |
112 |
100 |
103 |
99 |
(a)
(b)
Figure 2. Defination of DCT regiouns and Quantization values used in JPEG compression scheme[6]
-
IV. D iscrete W avelet T ransform
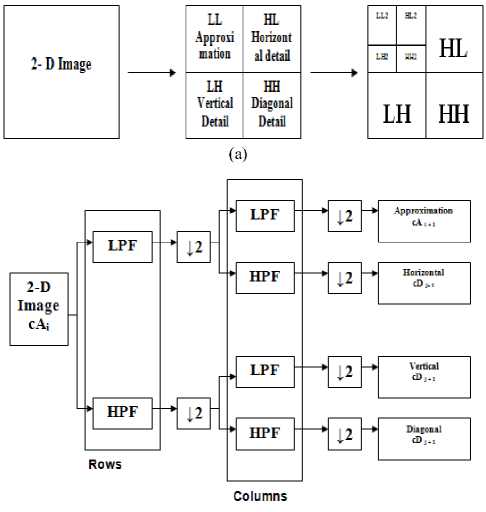
The Basic Idea of the Discrete Wavelet Transform [7, 8, and 9] may be understood by taking a one dimensional signal which is first split into two parts, usually high frequencies and low frequencies [10]. Again the low frequency part is divided into two frequency components of high and low frequencies. This process is continued until the signal has been entirely decomposed. Furthermore, from the DWT coefficients, the original signal can be reconstructed. The reconstruction process is called the inverse DWT (IDWT). The idea of the DWT is as shown in the figure 3.
(b)
Figure 3. Basic decomposition steps for images
-
V. V isual quality M atrices
We have mainly used the following visual quality matrices [14] for the sake of comparison of degradation after the watermark is added to video.
MSE=мIN∑xtl ∑у=1{(f(x, y)-f (x, y))^2} (3)
PSNR=10×log (4)
Here MSE – Mean Square Error
PSNR – Peak Signal to noise Ratio
f(x,y) – Original Frame of the video f’(x,y) – Watermarked Frame of the Video.
The phrase peak signal-to-noise ratio [14], often abbreviated PSNR, is used to measure the similarity between two signals where in one is original and the other is altered version of the same. PSNR can be defined via the Mean Square Error (MSE) which gives us the idea of difference between the original and the altered signal. PSNR is measured in the logarithmic scale and MSE is measured in the general scale.
At the receiver end we extracted the watermark and measured the correlation [14] of the recovered watermark and original watermark for the sake of checking the robustness.
-
VI. P roposed A lgorithm
In our proposed method qualities of both the DWT and DCT are used for the purpose of embedding. Figure 4 shows the diagram of the proposed method. In this we made use of the combined DWT-DCT for the purpose of watermarking. Some of the glimpses of the proposed method are:
-
1. Rather than inserting the watermark into the DCT coefficients directly, we first apply a 2-level DWT to have seven sub-bands.
-
2. We choose horizontal sub-band and then apply DCT to have DCT coefficients and then we modify the mid frequency coefficients.
-
3. Here robustness is improved by the ability of the DWT to increase the energy of the watermark which makes use of the properties of the HVS.
-
4. Furthermore imperceptibility is also achieved by the DWT.
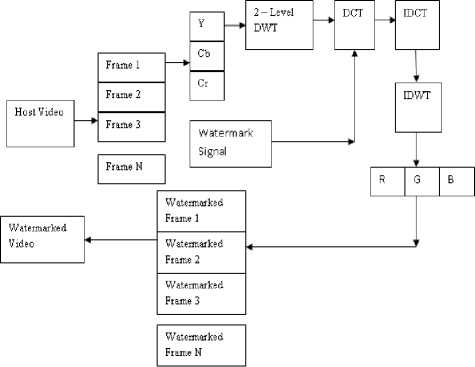
Figure 4.Block Diagram of the proposed scheme
(a)
|
Message: 1 KITA ano |
Message:2 KITA ano |
|
M e s s a g e: 3 |
Messagez4 |
|
шта |
RITA |
|
Я1Ю |
Я11О |
(b)
-
1. Luminance component carries the major information of the frame and is perceptibly most important to the Human eye as compare to the color information.
-
2. While frame undergoes JPEG compression color components are down-sampled but luminance samples are kept as it is.
Therefore choosing Y frame is better so far as perceptibility and robustness of the watermarking is concerned. Following are the expressions conversion from RGB to YCbCr and vice-versa [13].
Y = 16 + 65.481*R + 128.553*G + 24.966*B(5)
Cb = 128 – 37.797*R – 74.203*G + 112*B(6)
Cr = 128 + 112*R – 93.786*G – 18.214*B(7)
R = Y + 0 * Cb + 1.402 * Cr(8)
G = Y - 0.344136 * Cb - 0.714136 * Cr(9)
B = Y + 1.772 * Cb + 0 *Cr(10)
-
A. E MBEDDING A LGORITHM
Following is the stepwise representation of what we have done for the video watermarking using the proposed algorithm.
-
1. Video is converted into the sequence of frames.
-
2. Color space conversion is done from RGB to YCbCr.
-
3. A two-level DWT is performed and HH2 band is selected for the further process.
-
4. Block based DCT is applied onto the HH2 band and middle band frequency coefficients are modified in accordance to the binary watermark.
-
5. Inverse DCT is performed to get the watermarked HH2 band.
-
6. Inverse DWT is performed two times so as to get watermarked Y frame.
-
7. Reverse color space conversion from YCBCr to RGB is performed so as to get watermarked RGB frame.
-
8. Steps 2 to 7 are repeated until all the frames are not completed.
-
9. All watermarked RGB frames are combined to get watermarked RGB video.
-
4. Block based DCT is applied onto the HH2 band and middle band frequency coefficients are modified so as to get the binary watermark.
-
5. Steps 2 to 4 are repeated until all the frames are not completed.
Figure 8 shows the watermark extracted from the first six frames for k=10 and k=80 and figure 9 shows the comparative chart of correlation for various values of k.
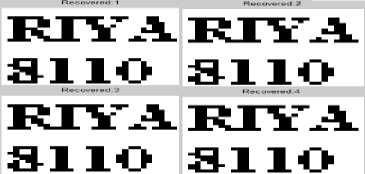
Figure 6 shows the first six of the frames for the value of gain factor k=80 and figure 7 shows graphical representation of the results that we get.
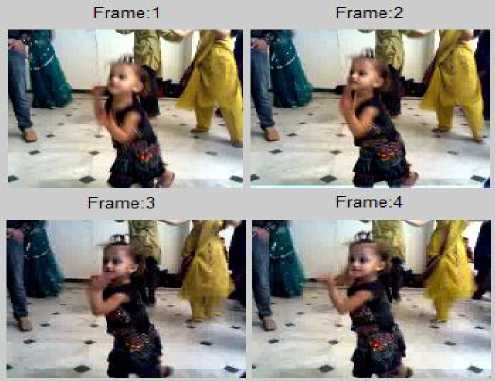
Figure 5. (a) First Four Frames of the Video (b) Messages to be embedded behind each frame
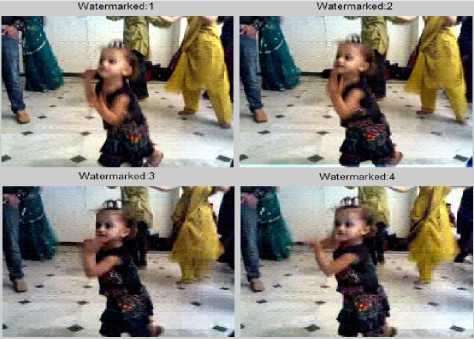
Figure 6. Watermarked Frames
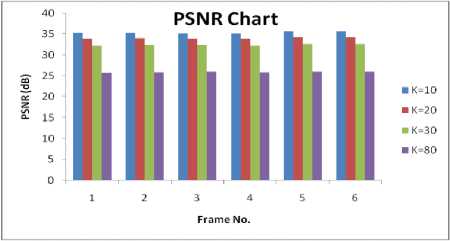
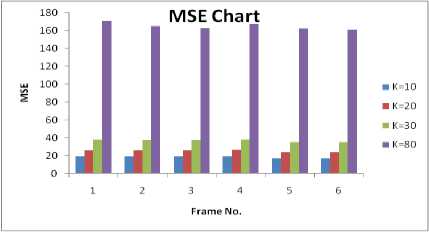
Figure 7 shows the PSNR and MSE results for the various values of the gain factor k. One can observe that as the value of k increases the difference between the original and the watermark frame increases and therefore an increased MSE and reduced PSNR is obtained.
(a)
(b)
Figure 7. (a) Peak Signal to Noise Ratio Chart (b) Mean Square Error chart
-
B. E XTRACTION A LGORITHM
We followed following steps to obtain the message back from the watermarked video sequence.
-
1. Video is converted into the sequence of frames.
-
2. Color space conversion is done from RGB to YCbCr.
-
3. A two-level DWT is performed and HH2 band is selected for the further process.
Figure 8.Watermarks extracted wih K = 80
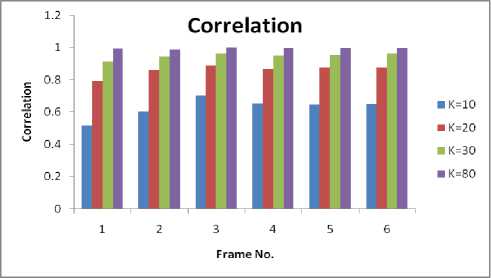
Figure 9.Correlation Chart
We can observe that as the value of k increases, the perceptibility of the recovered watermark and hence the correlation of the same with the original watermark increases.
Table 1 shows the results of PSNR, MSE and Correlation with various values of Gain Factor.
TABLE 1. PSNR, MSE AND CORRELATION RESULTS WITH VARIOUS ALPHA
|
Gain Factor |
PSNR-dB |
MSE |
Correlation |
|
10 |
48.6013 |
0.8973 |
0.0735 |
|
20 |
48.5689 |
0.904 |
0.1519 |
|
30 |
48.5249 |
0.9133 |
0.2145 |
|
40 |
48.4477 |
0.9296 |
0.2617 |
|
50 |
48.3693 |
0.9466 |
0.3195 |
|
60 |
48.263 |
0.97 |
0.36 |
|
70 |
48.1445 |
0.9969 |
0.3976 |
|
80 |
48.024 |
1.0249 |
0.4264 |
|
90 |
47.8987 |
1.0549 |
0.4629 |
|
100 |
47.7528 |
1.0909 |
0.4832 |
-
VII. R obustness R esults
We applied various attacks to the watermarked frame and got some of the results that are explained as under. Here we used another watermark to check the robustness.

(a) (b) (c)
(d)
Figure 10.Recovered Watermarks after compression (a) 65% (b) 45% (c) 25% (d) 5%

(a)
(b) (c) (d)
Figure 11.Recovered Watermarks after Gaussian LPF of with mask size 21 x 21 and sigma of (a) 1.3 (b) 1 (c) 0.7 (d) 0.4

(a) (b) (c) (d)
Figure 12.Recovered Watermarks after approximating linear motion of camera with motion pixels (a) 50 (b) 35 (c) 20 (d) 5

(a) (b) (c) (d)
Figure 13.Recovered Watermarks after added Gaussian with 0 mean and variance of (a) 0.009 (b) 0.007 (c) 0.005 (d) 0.001
Table 2 shows the results under various attacks.
TABLE 2. PSNR, MSE AND CORRELATION RESULTS UNDER VARIOUS ATTACKS
|
Correlati on |
PSNR |
MSE |
||
|
Averag e Filterin g |
3 |
-0.0205 |
36.3353 |
15.1201 |
|
5 |
0.027 |
33.5018 |
29.0339 |
|
|
7 |
0.0374 |
32.0972 |
40.12 |
|
|
9 |
0.0201 |
31.2022 |
49.3017 |
|
|
11 |
-0.0082 |
30.5701 |
57.0257 |
|
|
13 |
0.0244 |
30.0968 |
63.5916 |
|
|
15 |
0.0263 |
29.723 |
69.3073 |
|
|
Compr ession |
5 |
-0.0369 |
30.7373 |
54.8726 |
|
10 |
0.0126 |
33.0748 |
32.0329 |
|
|
20 |
0.0069 |
36.8717 |
13.3631 |
|
|
40 |
-0.0166 |
39.558 |
7.1992 |
|
|
60 |
-0.0139 |
41.229 |
4.8999 |
|
80 |
-0.0259 |
43.3279 |
3.022 |
|
|
95 |
0.0067 |
43.5051 |
2.9012 |
|
|
Linear Motion of the Camera |
5 |
0.0561 |
35.2706 |
19.3205 |
|
10 |
0.063 |
32.3212 |
38.1033 |
|
|
15 |
0.0641 |
31.0839 |
50.6633 |
|
|
20 |
0.0667 |
30.3327 |
60.2291 |
|
|
25 |
0.0745 |
29.807 |
67.9793 |
|
|
30 |
0.064 |
29.4072 |
74.5354 |
|
|
35 |
0.0564 |
29.1015 |
79.9712 |
|
|
Gaussia n Noise with 0 Mean and Variabl e Varianc es |
0.0005 |
0.0505 |
36.0944 |
15.9822 |
|
0.005 |
0.0584 |
29.9163 |
66.2902 |
|
|
0.01 |
-0.0092 |
29.103 |
79.9438 |
|
|
0.09 |
-0.0023 |
27.9542 |
104.1513 |
|
|
0.4 |
0.0311 |
27.6725 |
111.1289 |
|
|
0.8 |
-0.0002 |
27.5918 |
113.2131 |
|
|
1 |
-0.0214 |
27.5939 |
113.1582 |
|
|
Gaussia n Noise with Variabl e Mean 0.0005 Varianc e |
0.0005 |
0.0699 |
36.0942 |
15.9831 |
|
0.005 |
0.0553 |
39.2516 |
7.7255 |
|
|
0.01 |
0.0366 |
56.8664 |
0.1338 |
|
|
0.09 |
0.0469 |
80.5809 |
0.0006 |
|
|
0.4 |
0.0359 |
84.4423 |
0 |
|
|
0.8 |
-0.0063 |
90.1024 |
0 |
|
|
1 |
0.0192 |
99.1159 |
0 |
|
|
Color Reducti on |
4 |
0.0109 |
28.9155 |
83.4694 |
|
8 |
0.04 |
29.77 |
68.561 |
|
|
16 |
-0.0174 |
31.1096 |
50.3646 |
|
|
32 |
0.0212 |
32.5424 |
36.2106 |
|
|
GLPF with Sigma Values |
0 |
0.99694 |
34.4929 |
23.1101 |
|
1 |
0.73087 |
30.2367 |
61.599 |
|
|
1.5 |
0.15054 |
29.4309 |
74.1606 |
VIII. C onclusion
From the work carried out, we concluded that as we increase the value of the gain factor the perceptibility reduces but watermark strength increases and we can recover a better watermark at the receiver end. We also observed a good robustness against the compression, filtering and noise attacks.
Список литературы Video Watermarking – Combination of Discrete Wavelet & Cosine Transform to Achieve Extra Robustness
- Rini T Paul, "Review of Robust Video Watermarking Techniques", IJCA Special Issue on "Computational Science - New Dimensions & Perspectives", NCCSE, 2011.
- Gerhard CornelisLangelaar, Reginald L. Lagendijk, "Watermarking digital image and video data – A state of Art Review", IEEE SIGNAL PROCESSING MAGAZINE, September, 2000
- Blossom Kaur, AmandeepKaur, Jasdeep Singh, "SteganographicApprochFor Hiding Image In DCT Domain", International Journal of Advances in Engineering & Technology, July 2011.
- Debnath Bhattacharyya. "Watermarking Using Multiresolution Cosine Transformation: A Review", Communications in Computer and Information Science, 2011.
- Chiou-Ting Hsu and Ja-Ling Wu, "DCT-BASED WATERMARKING FOR VIDEO", IEEE Transactions on Consumer Electronics, Vol. 44, No. 1, FEBRUARY 1998
- Chris Shoemakar, "Hidden Bits: A Survey of Techniques for Digital Watermarking"Independent StudyEER-290 Prof RudkoSpring 2002.
- Xiang-Gen Xia, Charles G. Boncelet, Gonzalo R. Arce," A Multiresolution Watermark for Digital Images".
- M. Ejima and A. Miyazaki, "A wavelet-based watermarking for digital images and video," Proceedings International Conference on Image Processing (ICIP-2000), Vol. 3, pp. 678-681, Vancouver, Canada, 2001.
- Huang D., Liu J., Huang J., "A DWT-based image watermarkingalgorithm", Proc. IEEE Intl. Conf. Multimedia and Expo., pp.429–432, 2001
- Web pagehttp://en.wikipedia.org/wiki/Peak_signal-to-noise_ratio
- M. Kutter&F.A.P.Petitcolas, "A fair benchmark for image watermarking systems", Electronic Imaging '99. Security and Watermarking of Multimedia Contents, vol. 3657, Sans Jose, CA, USA, 25-27 January 1999.
- Rafael C. Gonzalez, Richard E. Woods, Steven L. Eddins, "Digital Image Processing Using MATLAB", Published by Pearson Education, Inc.
- Web pagehttp://en.wikipedia.org/wiki/YCbCr
- V.Santhi and Dr. ArunkumarThangavelu, "DWT-SVD Combined Full Band Robust Watermarking Technique for Color Images in YUV Color Space", International Journal of Computer Theory and Engineering, Vol. 1, No. 4, October2009.
