Visual Improvement for Hepatic Abscess Sonogram by Segmentation after Curvelet Denoising

Author: Mohammed Tarek GadAllah, Mohammed Mabrouk Sharaf, Fahima Aboualmagd Essawy, Samir Mohammed Badawy
Journal: International Journal of Image, Graphics and Signal Processing(IJIGSP) @ijigsp
Article in issue: 7 vol.5, 2013.
Free access
A wise automated method for wisely improving the visualization of hepatic abscess sonogram, a modest trial is being done to denoise and reduce the ultrasound scan speckles wisely and effectively. As an effective way for improving the diagnostic decision; improved sonogram for hepatic abscess is reconstructed by ultrasound scan image segmentation after denoising in Curvelet transform domain. Better sonogram visualization is required for better human interpretation. Speckle noise filtering of medical ultrasound images is needed for enhanced diagnosis. Double thresholding segmentation was applied on, an ultrasound scan image for a Liver with amebic abscess, after it had been denoised in Curvelet transform domain. The result is enhanced wise effect on the hepatic abscess sonogram image's visualization which improves physicians' decisions. Moreover, this method effectively reduces the memory storage size for the image which consequently decreases computation processing time.
Image Segmentation, Ultrasound Medical Imaging, Curvelet Transform
Short address: https://sciup.org/15013009
IDR: 15013009
Text of the scientific article Visual Improvement for Hepatic Abscess Sonogram by Segmentation after Curvelet Denoising
Anatomically; a liver abscess is a pus-filled cavity within the liver. Liver abscess is almost uniformly fatal if left untreated. Timely treatment reduces mortality to
5% to 30%. One of its suitable imaging ways to be diagnosed is ultrasound medical imaging or Ultrasonography. [2] Liver problems either fibrous, diffuse, and hepatic abscesses are too large number of inhibitors. The ultrasound imagining has widely proved itself as an extremely useful and integrating other medical imaging modalities such as MRI and or CT. While in some body regions it showed superiority and even uniqueness diagnostic tool. Never the less the speckles on the ultrasounds scan is disadvantage.
Medical images, generally, are representation in some format for anatomy of human and none human beings [1]. So, Visual quality of the image produced from Ultrasonography plays an important role in diagnosis by physicians.
Speckle noise filtering of medical ultrasound images ( denoising ) is important, providing clinicians with enhanced diagnostic ability [6]. More than one from the most recent and modern Researches assured that the best way for ultrasound image denoising is denoising in Curvelet transform domain due to the ability of Curvelet Transform to recover signals in different directions as compared with other methods [4], [5], [6], [7], [8], [9], [10], [11], [12], [13]. The first mention of Curvelet transform was by E. J. Candµes and D. L. Donoho in 1999 [16]. After that, in November 1999, D. L. Donoho & M. R. Duncan introduced the Digital Curvelet Transform [17]. In 2002; J.L. Starck, E.J. Candes, and
D.L. Donoho published: "The Curvelet Transform for Image denoising" [13].
Image Segmentation after image denoising in Curvelet transform domain is an effective way for extracting the important regions needed for better visualization, detection, and feature extraction, thus better diagnosis. Segmentation refers to the operation of partitioning an image into component parts, or into separate objects, and there is more than one approach for image segmentation [14].
In this paper, double thresholding is used for image segmentation after denoising in Curvelet transform domain, was applied on an ultrasound scan image of Amebic liver abscess [19]. An amoebic liver abscess is a type of Hepatic abscess [3]. This had been repeated for 15 times for better evaluation of the applied procedure on detecting the liver abscess. The result is enhanced segmented visualized image instead of segmentation without denoising in Curvelet transform domain.
Concluding that; double thresholding segmentation after denoising in Curvelet transform domain has enhanced wise effect on the visualization quality for hepatic abscess scan Images, resulting in better physician’s diagnostic decisions. Also, the procedure was applied on another normal fetal heart scan image example with different limits for double thresholding segmentation assuring that; Generalization for our study is already possible for not only Ultrasonography, but also for all biomedical images, as an enhanced segmentation way for better visualization, detection, and feature extraction, thus better diagnosis. Moreover, this method could be considered as enhanced compression algorithm; where each pixel (zero or one) could be stored in one binary bit, which effectively reduces the memory storage size and processing time.
The paper has organized as section I introduction, section II explained the methods been applied in this paper, section III is the materials used including the images and Curvelet toolbox, section IV displaying the numerical and graphical results, section V is a discussion on the results and how can it be generalized for all Ultrasonography images, section VI is the conclusion for the paper, and finally the references.
-
II. Methods
An ultrasound scan of a liver with abscess [19] was taken and cut to be appropriate for Curvelet transform domain. [See Fig.1-Materials] After that, the following processing procedure was applied, resulting in a two figures with 4 images for each. [See Fig.4 & Fig.5 -Results]
-
A. Applied processing procedure:
Firstly, the Ridgelet and Curvelet first generation toolbox [15] is used for First- noising the hepatic abscess image by a determined Snr (Signal to noise ratio), this procedure can be considered as a simulation for the speckle noise that often come with all ultrasound scan images, Second- denoising in Curvelet transform domain, and calculation of the PSNR (Peak Signal to Noise Ratio) for each denoised image. For one image the result is three images Original, Noisy, and Curvelet Reconstructed.
Thirdly, a numerical comparison among the original images and the Curvelet denoised images was done by MSE (Mean Square Error), RMSE (Root Mean Square of Error). Also, we compared among the results PSNR (Peak Signal to Noise Ratio) for the reconstructed Curvelet image and the Snr (Signal to noise ratio) for the noisy image to show the effect of this denoising procedure. Moreover, we calculated the MSE and RMSE between the original images and the noisy images before denoising in Curvelet domain.
We had repeated this procedure for 15 times, for 15 different values for Snr producing 15 different graphical and numerical results. After finishing, we calculated the average for all the 15 readings PSNR, MSE, and RMSE producing the final results table [See Table I -Results] for numerical results. After that, we Plotted Results in graphical curves [See Fig.3 -Results].
For generalization purpose, an ultrasound scan of a Normal Fetal Heart [20] was taken and cut to be appropriate for Curvelet transform domain. After that; we applied the same procedure on it, where; Snr = 15 in the noising procedure, but, with different double thresholding limits for segmentation, producing a two figures [See Fig.8 & Fig.9 -Results]. we can obviously see that the reconstructed image has more visual quality and more clearance and purity than the ultrasound scan image taking us near the original fetal heart image itself, thus; this assure the enhanced and advanced performance of the CVT denoising for the image correction and denoising, moreover after segmentation the reconstructed image already has better visual quality and purity than the segmented original image. This assures the power of the applied procedure in noise reduction and visual quality enhancement; moreover feature extraction, not only for the hepatic abscess scans, but also, for all ultrasound medical images.
-
B. Curvelet Transform Domain
The Curvelets idea is to represent a curve as a superposition of functions of various lengths and widths obeying the scaling law width ≈ length2 [8]. More than one from the recent researches assures that image denoising in Curvelet Transform domain is the best denoising due to the ability of Curvelet to recover signals in different directions [4], [5], [6], [7], [8], [9], [10], [11], [12], [13].
Curvelet transforms give close and improved delineation to edges [18], its construction based on three essential ideas [16]:
-
1. Ridgelets; a method of analysis suitable for objects with discontinuities across straight lines.
-
2. Multiscale Ridgelets, a pyramid of windowed Ridgelets, renormalized and transported to a wide range of scales and locations.
-
3. Bandpass Filtering, a method of separating an object out into a series of disjoint scales.
-
C. Image Segmentation
There is more than one way for Image Segmentation. Thresholding is a vital part of image segmentation, where we wish to isolate objects from the background. Here we use one important type of image thresholding called ‘’ double thresholding ’’, simply we choose from our image two appropriate pixel values L and U, where L is the lower limit of thresholding and U is the upper limit of thresholding, and apply the double thresholding operation, after that our grayscale image is turned into a binary (black and white) image, white for all pixels lies in-between the two limits value L, U, and black for all the others. For the Phantom images we worked on.
-
D. Performance evaluation
In our study, we had evaluated the performance for all the 15 results by three important famous statistical values:
-
a) MSE
Is the mean square of error Calculated from (1), Where , m= number of rows in the image, n = number of columns, O is the original image pixel values matrix, R is the reconstructed image pixel values matrix, and finally (i,j) are the x, y coordinates for every pixel in each image.
mn
MSE=2Z[ ^ 0-j)-R ('.j)H2 (1)
m X n i = 1 j = 1
-
b) RMSE
-
c) PSNR
It is the peak signal to noise ratio calculated automatically by the Curvelet toolbox software. PSNR can be represented in (2), where; N is the Noisy image pixel values matrix, R is the reconstructed image pixel values matrix, MAX is the maximum pixel value in image N [here; MAX = 255], MSE here is the mean square error in between the noisy image N and the reconstructed one R.
-
III. Materials
A. Images
We worked on two images in our study as follow:
-
■ The first one is our main study on hepatic abscess in the ultrasound scans' images of Liver, produced by taking an ultrasound scan of a liver with abscess [19] and cutting to be appropriate for Curvelet transform domain [See Fig.1].
-
■ The second is ultrasound scan image produced by taking an ultrasound scan of a Normal Fetal Heart [20] and cutting to be appropriate for Curvelet transform domain [See Fig.2].
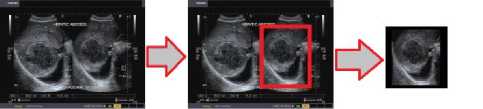
Figure (1): Extraction for the hepatic abscess scan image implemented in our study from the Liver Scan Image
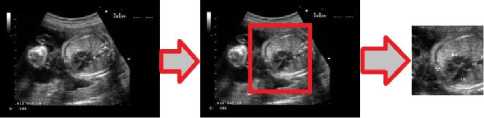
Figure (2): Extraction for the Normal Fetal Heart scan image implemented in our study from the Fetal Scan Image
-
B. Image Processing Software
We processed our images in three essential software materials:
Microsoft Paint, Ridgelet and Curvelet first generation Toolbox, and MATLAB version R2011b
-
a) Microsoft Paint
We used it in the first processing stage of all images included in our study, to manipulate and adjust the images to obtain a square image with every side has power '2', and this size modification is a must preprocessing stage to work in Curvelet transform domain.
-
b) Ridgelet and Curvelet first generation Toolbox
This toolbox is compatible with MATLAB software toolbox [15]. It was used for reading the original image, adding white Gaussian noise with zero mean, denoising in Curvelet domain.
-
c) MATLAB version R2011b
We used MATLAB for more jobs as shown below:
Running the Ridgelet and Curvelet first generation Toolbox, inside it
Making a program for double thresholding segmentation with flexible choice for the upper and lower limits for thresholding, helping us to obtain the best limits we need. This program give us the power to generalize this method not only for all ultrasound scans, but also for all medical images by selecting a better threshold to put the scope on the region of interest we need to see.
Creating a function program for calculating the MSE according to (1) [-Methods], and to calculate the RMSE.
Plotting the graphical results after processing for the material’s images Fig.3, Fig.4 ... Fig.9 [-Results]
-
IV. Results
The results for our study can be divided into two parts, Numerical and Graphical as follow:
-
A. Numerical Results
All numerical results for all the 15 readings for 15 different values for Snr for the hepatic abscess scan image are all included in Table I, where:
Noisy - Snr: is the noisy image’s signal to noise ratio, some papers add noise values dependent on its variance [6] and [8] or its standard deviation like [12] and [13]. Here; in our study, using the Ridgelet and Curvelet first generation Toolbox we are able to choose the SNR signal to noise ratio for the product image after noising, this tool box has inherent program do that.
Result - No.: is the number of result starting from 1 to 15 reading.
PSNR – R: is the peak signal to noise ratio for the reconstructed image due to (2) –Methods.
Avg.: is the mean for all the 15 Snr values’ results for each parameter Snr, PSNR, MSE, RMSE.
The numerical results for the normal fetal heart image are included in Table II.
Table I: All numerical results for the Liver Abscess Sonogram Image
|
Noisy SNR |
Results No. |
PSNR R |
MSE O&R |
MSE O&N |
RMSE O&R |
RMSE O&N |
|
5 |
1 |
26.70 |
139.04 |
1277.9 |
11.79 |
35.75 |
|
10 |
2 |
28.44 |
93.06 |
404.12 |
9.65 |
20.10 |
|
15 |
3 |
30.18 |
62.36 |
127.79 |
7.9 |
11.30 |
|
20 |
4 |
32.30 |
38.26 |
40.41 |
6.19 |
6.36 |
|
25 |
5 |
34.66 |
22.22 |
12.78 |
4.71 |
3.57 |
|
30 |
6 |
37.61 |
11.28 |
4.04 |
3.36 |
2.01 |
|
35 |
7 |
40.26 |
6.12 |
1.28 |
2.47 |
1.13 |
|
40 |
8 |
42.35 |
3.78 |
0.404 |
1.94 |
0.636 |
|
45 |
9 |
43.11 |
3.18 |
0.13 |
1.78 |
0.36 |
|
50 |
10 |
43.16 |
3.14 |
0.404 |
1.77 |
0.20 |
|
60 |
11 |
43.23 |
3.09 |
0.004 |
1.76 |
0.06 |
|
70 |
12 |
43.19 |
3.12 |
0.0004 |
1.77 |
0.02 |
|
80 |
13 |
43.20 |
3.11 |
0.00004 |
1.76 |
0.0064 |
|
90 |
14 |
43.23 |
3.09 |
0.000004 |
1.76 |
0.002 |
|
100 |
15 |
43.23 |
3.09 |
0.0000004 |
1.76 |
0.000636 |
|
45 |
Avg. |
38.32 |
26.53 |
124.62 |
4.02 |
5.43 |
Table II: All numerical results for the normal fetal heart ultrasound scan's image used for generalization
|
Image |
Noisy SNR |
PSNR R |
MSE O&R |
MSE O&N |
RMSE O&R |
RMSE O&N |
|
Normal Fetal Heart |
15 |
28.5 |
91.78 |
281.92 |
9.58 |
16.79 |
-
B. Graphical Results
Consist of more figures for all the 15 results for hepatic abscess scan image plus the fetal heart image [See Fig.1 and Fig.2 –Materials], but, here we displayed only seven results figures presented from Fig.3 till Fig.9, Where:
Figure (3): Graphical Integrated Results for the whole 15 results for the hepatic abscess scan image
Figure (4) & Figure (5): Represent one result No.1 from the 15 results Where; taken noising Snr = 05
Figure (6) & Figure (7): Represent one result No.13 from the 15 results Where; taken noising Snr = 80
Figure (8) & Figure (9): Represent the result for the normal fetal heart scan image Where; taken noising Snr = 15
CVT: is Curvelet Transform Domain
After: referred to After Appling Curvelet Transform Denoising
Before: referred to Before Appling Curvelet
Transform Denoising
-
L: the lower limit for the double thresholding
procedure
U: the upper limit for the double thresholding procedure
PSNR -Reconstructed Image
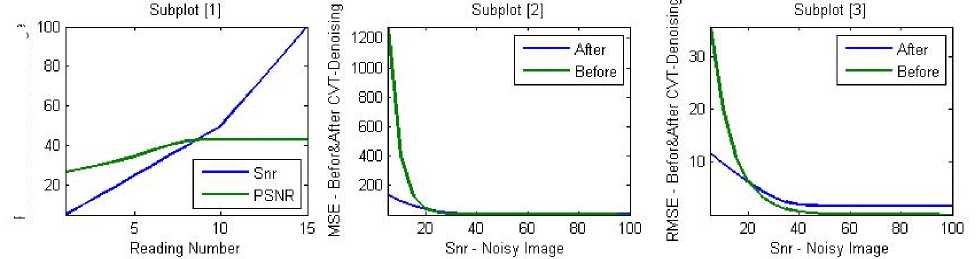
Figure (3): Graphical Integrated Results for the whole 15 results for the Liver Abscess Sonogram Image
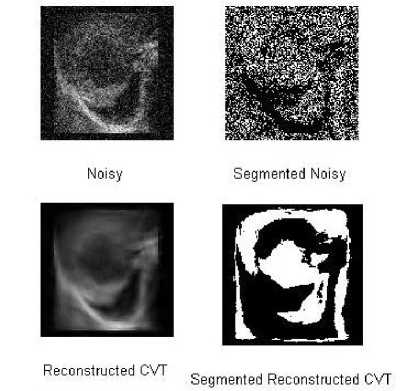
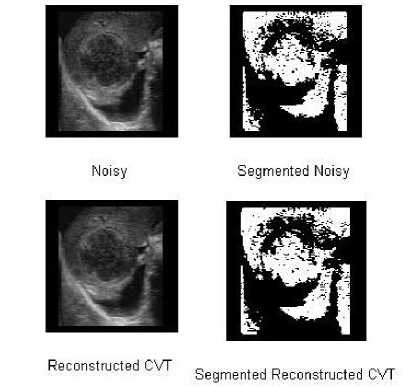
Figure (4): Graphical Results No.1 from the 15 results for the hepatic abscess scan image – Where; Snr = 05
Figure (6): Graphical Results No.13 from the 15 results for the hepatic abscess scan image – Where; Snr = 80
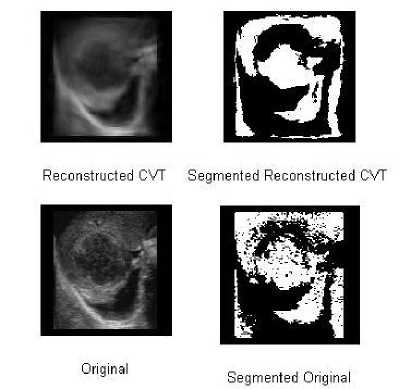
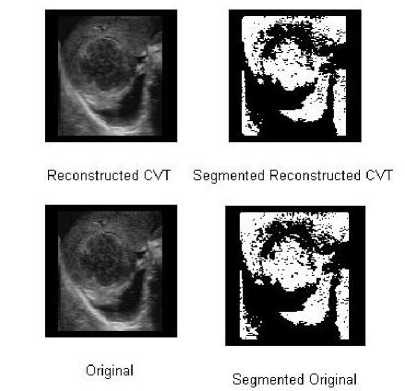
Figure (5): Comparison for Graphical Results No.1 of the hepatic abscess scan image – Where; Snr = 05
Figure (7): Comparison for Graphical Results No.13 of the hepatic abscess scan image – Where; Snr = 80
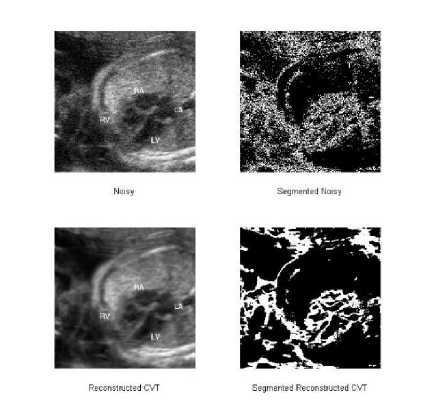
Figure (8): Graphical Results for Normal Fetal Heart scan image –
Where; Snr = 15
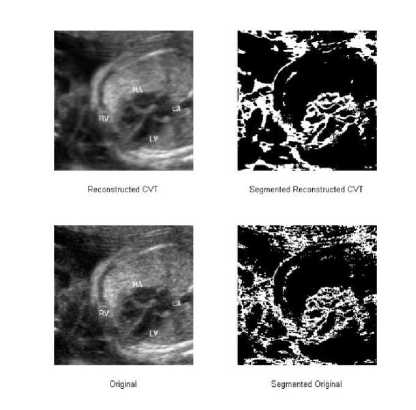
Figure (9): Comparison for the Graphical Results of the Normal Fetal Heart scan image – Where; Snr = 15
-
V. Discussion
Firstly, From numerical results for the hepatic abscess ultrasound scan image shown in Table-I, we can obviously see that CVT denoising has enhanced wise effect on the result PSNR for all 15 readings, In the first 8 results the PSNR increased above Snr, however, PSNR decreased down Snr for the rest. This effect can be obviously seen in the graphical results Fig.3/ subplot-1.
This assures that CVT determine the best value for denoising to obtain the best visualized, cleared, and pure image whatever the value for the input Snr added. This way in working for CVT denoising assures the wise of this algorithm although it is Nonadaptive.
Secondly, talking about the graphical results for the hepatic abscess ultrasound scan image shown in [Fig.1 – Materials], we will discuss two points throw the curve at Fig.3/ subplot-1, representing Readings 1 and 13 from Table-I;
-
1. Reading 1 for Snr = 05
-
2. Reading 13 for Snr = 80
From this point on the curve we can expect that the output image after CVT denoising may include little information, because Snr = 05 is very low ratio, But Denoising in CVT Domain extract the signal from its noise and reach to PSNR = 26.7, we can see this result graphically in Fig.4. To make obvious view for the original ultrasound scan and the reconstructed CVT image; we can see obviously that the result from CVT denoising is more soft and comfort for eyes than the original scan image itself, which take us near and near to the original liver view with abscess.
This assures the power of Double Thresholding Segmentation after CVT denoising to extract the regions of interest from biomedical ultrasound images with highly speckle noise by selecting the appropriate threshold limits.
From this point on the curve we see that the output image after CVT denoising has PSNR = 43.2 from Snr = 80 before CVT Denoising, we can see this result graphically in Fig.6 and Fig.7. Here, Snr decreased by 36.8 instead of increasing 21.7 in the previous sample Reading 1.
Recalling from Reading 1 & Reading 13 & the rest readings in Table-I; This increment way for PSNR assures the wise of this algorithm although it is non-adaptive; from that we can deduce that CVT denoised the signal depending on the value of the noise in the image to extract the original features form the signal whatever the value of the noise inside. When we look accurately in Fig.7 we can see that the noise is very low, so CVT don’t increase Snr more, moreover CVT decreased till reach PSNR = 43.2, recalling Fig. 3 we can see through the entire curves to what extent it is a wise algorithm.
From Table-II, we can see to what extent the procedure enhanced Snr from 15 to PSNR = 28.5, also the MSE from 281.92 to 91.78.
From Fig.8, we can see to what extent the procedure enhances the image starting from denoising, clearing, segmenting, better visualize.
Comparing with the original image in Fig.9, we can obviously see that the reconstructed CVT image is more clear and pure than the ultrasound scan itself taking us near to the original fetal heart real image.
This result assures the power of the applied method to extract, detect, and better visualize for objects and edges, thus assuring our work on ultrasound scan images and open the way for a generalization for the applied method to process all biomedical imaging 2D-scans[two dimensions].
One more advantage
One more advantage for the applied algorithm is not only the enhanced visualization achieved, but also we have an enhanced compression algorithm, because we need just one bit for every pixel because our results is a binary logical numbers image 0 for black and 1 for white. It is effectively reduce the memory storage size for the image which consequently decreases computation processing time.
For example for a gray scale image with 255 level every level must be stored in at least 8 bit or one byte, after implementing our algorithm, the information we need included in the binary image with 1 bit for every pixel, so we save 7 bits, from that we can deduce that we don’t need to save all not required information and just we need storage device equal 1/8 the traditional size.
Practically, we took two images from the results shown in Fig.7; one segmented and the other not segmented, and stored all in two specific image formats producing four images to compare between the storage sizes for them all. The result is almost equal 1/8 the size after segmentation. Results can be seen in Figure (10).
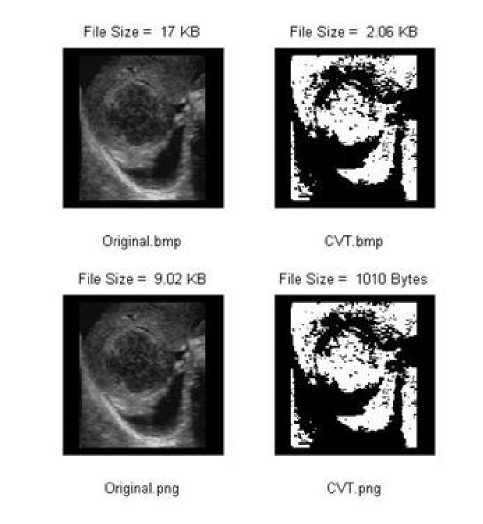
Figure (10): Image Storage for Hepatic Abscess Ultrasound can Image – Result No.13 – Where; Snr = 80
-
VI. Conclusion
In our study we proved that double thresholding segmentation after denoising in Curvelet transform domain has enhanced wise effect for hepatic abscess detection in ultrasound scan images, helping physicians for better diagnosis; as a step towards sonogram free of speckles. Generalization for our study is already possible for not only Ultrasonography, but also for all biomedical images, as an enhanced segmentation way for better visualization, detection, and feature extraction, thus better diagnosis. Moreover, this method could be considered as enhanced compression algorithm; where large reduction in sonar image memory storage area and also processing time.
Acknowledgment
This paper exactly plays an important role in my master. Thanks for all people who helped me to perform this paper without any opposite. Thanks to Dr. Eng. Samir Badawy who gave me the chance to publish this paper in IJGSP (I.J. Image, Graphics and Signal Processing).
References Visual Improvement for Hepatic Abscess Sonogram by Segmentation after Curvelet Denoising
- Hill, C. R., Bamber, J. C., and ter Haar, G. R., "Physical principles of medical ultrasonics, 2nd edition", Ch.8: (Ultrasonic Images and the Eye of the Observer), 2004, [John Wiley, Chichester, UK]
- Clinical Key – Elsevier, Liver Abscess, website: https://www.clinicalkey.com/topics/gastroenterology/liver- abscess.html
- Wikipedia, Amoebic liver abscess, website: http://en.wikipedia.org/wiki/Amoebic_liver_abscess
- Mohamed Tarek GadAllah & Samir Badawy, "Aorta's abnormalities detection by Ultrasonography scan Denoising in Curvelet Transform Domain", Accepted, Refereed, and Presented in Al-Azhar Engineering Twelfth International Conference, Cairo, Egypt, Dec. 25-27, 2012. Published in Journal of Al-Azhar University Engineering Sector, JAUES, Vol. (7), No. (3), pp. 395 – 403, E38, Dec. 2012. EJAUES website: https://sites.google.com/site/ejaues
- Mohamed Tarek GadAllah & Samir Badawy, "Diagnosis of Fetal Heart Congenital Anomalies by Ultrasound Echocardiography Image Segmentation after Denoising in Curvelet Transform Domain", Refereed, Accepted, and Presented in The 2012 World Congress on Electronics and Electrical Engineering [WCEEENG'12], Cairo, Egypt, Dec. 23 - 27, 2012, Published in the Online Journal on Electronics and Electrical Engineering (OJEEE), ISSN (2090-0279), Vol. (5), No. (2), pp. 554 - 560, Reference No. : W13-E-0023, April 2013. Online Paper Location: http://infomesr.org/attachments/W13-E-0023.pdf
- F. Yousefi Rizi, S. K. Setarehdan, "Noise Reduction in Intravascular Ultrasound Images Using Curvelet Transform and Adaptive Complex Diffusion Filter: a Comparative Study", 20th Iranian Conference on Electrical Engineering, (ICEE2012), Tehran, Iran, May 15-17, 2012
- Hassen LAZRAG, Med Ali HAMDI, and Med Saber NACEUR, "Despeckling of Intravascular Ultrasound Images using Curvelet Transform", SETIT 2012 Sciences of Electronics, Technologies of Information and Telecommunication, March 2012.
- F. Yousefi Rizi, H. Ahmadi Noubari, and S. K. Setarehdan, "Wavelet-Based Ultrasound Image Denoising: Performance Analysis and Comparison", 33rd Annual International Conference of the IEEE EMBS. Boston, Massachusetts USA, August 30 - September 3, 2011.
- Aliaa A. A. Youssif, A. A. Darwish, and A. M. M. Madbouly, "Adaptive Algorithm for Image Denoising Based on Curvelet Threshold", IJCSNS International Journal of Computer Science and Network Security, VOL.10 No.1, January 2010.
- Anil A Patil and Jyoti Singhai, "Image denoising using curvelet transform: an approach for edge preservation", Journal of Scientific & Industrial Research, Vol. 69, pp. 34-38, January 2010.
- H. Rabbani, Student Member, IEEE, M. Vafadust, and S. Gazor, Senior Member, IEEE, "Image Denoising in Curvelet Transform Domain Using Gaussian Mixture Model with Local Parameters for Distribution of Noise Free Coefficients", Proceedings of the 4th IEEE-EMBS International Summer School and Symposium on Medical Devices and Biosensors St Catharine's College, Cambridge, UK, Aug. 19-22, 2007.
- Nguyen Thanh Binh and Nguyen Chi Thanh, " OBJECT DETECTION OF SPECKLE IMAGE BASE ON CURVELET TRANSFORM", ARPN Journal of Engineering and Applied Sciences, ISSN 1819-6608, VOL. 2, NO. 3, JUNE 2007.
- Jean-Luc Starck, Emmanuel J. Candès, and David L. Donoho, "The Curvelet Transform for Image Denoising", IEEE TRANSACTIONS ON IMAGE PROCESSING, VOL. 11, NO. 6, JUNE 2002.
- Alasdair McAndrew, "An Introduction to Digital Image Processing with Matlab Notes for SCM2511 Image Processing 1", School of Computer Science and Mathematics Victoria University of Technology, Semester 1, 2004.
- SANDEEP PALAKKAL, "Ridgelet and Curvelet first generation Toolbox", http://www.mathworks.com/matlabcentral/fileexchange/31559-ridgelet-and-curvelet-first-generation-toolbox 25 May 2011 (Updated 21 Mar 2012).
- Emmanuel J. Candµes and David L. Donoho, "Curvelets - A Surprisingly Effective Nonadaptive Representation For Objects with Edges", Saint-Malo Proceedings, Vanderbilt University Press, Nashville, TN, 1999.
- David L. Donoho & Mark R. Duncan, "Digital Curvelet Transform: Strategy, Implementation and Experiments", Department of Statistics Stanford University, November, 1999.
- Mohamed Elhabiby, Ahmed Elsharkawy, and Naser El-Sheimy, "Second Generation Curvelet Transforms Vs Wavelet transforms and Canny Edge Detector for Edge Detection from WorldView-2 data", International Journal of Computer Science & Engineering Survey (IJCSES) Vol.3, No.4, August 2012
- Ultrasound image gallery, A free gallery of high-resolution, ultrasound, color Doppler and 3D images, Liver, "Hepatic abscess or abscess of Liver (Amebic liver abscess)", website: http://www.ultrasound-images.com/liver.htm
- Ultrasound image gallery, A free gallery of high-resolution, ultrasound, color Doppler and 3D images, Fetal-heart, "Normal four chamber view of the fetal heart", website: http://www.ultrasound-images.com/fetal-heart.htm
