Влияние асимметричных распределений на коэффициенты контрольных карт Шухарта

Автор: Шпер В.Л., Шереметьева С.А.
Журнал: Известия Самарского научного центра Российской академии наук @izvestiya-ssc
Рубрика: Машиностроение и машиноведение
Статья в выпуске: 6 т.24, 2022 года.
Бесплатный доступ
В данной работе обсуждается влияние асимметричных функций распределения на значения коэффициентов контрольных карт Шухарта (ККШ) типа x-mR и -R. Утверждается, что для функций распределения (ФР), сильно отличных от нормального закона, это влияние следует учитывать. Обсуждается уровень такого изменения коэффициентов ККШ, который следует учитывать. Приведены результаты моделирования, и предложен алгоритм применения ККШ на практике, учитывающий закон распределения данных. Также приведен пример того, как отклонение ФР данных от нормального закона меняет границы ККШ для реальных процессов логистических поставок. В заключении представлены выводы и идеи для дальнейших исследований.
Контрольные карты шухарта, асимметричное распределение, нормальное распределение, контрольные пределы, управление качеством, логистика, менеджмент
Короткий адрес: https://sciup.org/148325334
IDR: 148325334 | УДК: 65.01 | DOI: 10.37313/1990-5378-2022-24-6-77-90
Effect of skewed distributions on Shewhart control chart coefficients
In this paper, we discuss the influence of asymmetric distribution functions on the values of the coefficients of Shewhart control charts (CCS) of the x-mR and -R types. It is argued that for distribution functions (DF) that are very different from the normal law, this influence should be taken into account. The level of such a change in the CCF coefficients, which should be taken into account, is discussed. The simulation results are presented, and an algorithm for applying the CCS in practice is proposed, taking into account the law of data distribution. An example is also given of how the deviation of the FR of data from the normal law changes the boundaries of the KCS for real logistics supply processes. In conclusion, conclusions and ideas for further research are presented.
Текст научной статьи Влияние асимметричных распределений на коэффициенты контрольных карт Шухарта
Хорошо известно, что контрольные карты Шухарта – это простой в использовании и одновременно универсальный инструмент для решения проблем качества и улучшения процессов. Применение ККШ охватывает практически все сферы человеческой жизни, а также этапы жизненного цикла продукции. Главная цель ККШ заключается в разделении вариаций рациональными методами на два вида: общие (принадлежащие системе) и специальные причины, специфические для какого-то эфемерного со-бытия1. С этой целью, каждая ККШ имеет пределы, которые отделяют зону системной изменчивости от области со специальными причинами вариаций. Данные пределы лежат на расстоянии 3 сигм от центральной линии (среднее значение), что обеспечивает их робастность. Стандартная формула определения границ карты, предложенная Уолтером Шухартом (1931/1980, 1939/1986), имеет следующий вид:
Контрольный предел = Среднее ±
± Коэффициент • Стандартное отклонение. (1)
Коэффициенты, в формуле 1, обычно обозначаются различными буквами, например, A2, D3 , D4 , E2 (форм улы 2 - 6). Они, в свою очередь,
1 Эта формулировка – слегка перефразированная цитата доктора Деминга из его предисловия к книге Шухарта 1939 года (Shewhart 1939/1986)
зависят от коэффициентов коррекции смеще-
|
ния d2, d3 и d4 (Wheeler, 1995, 419): |
|
|
^ = — , 2 d2V« |
(2) |
|
D3 = 1 — 3 —, 3 da |
(3) |
|
n _ i -и з ± -T a , |
(4) |
|
E^=l , |
(5) |
|
Es= t , |
(6) |
Коэффициенты коррекции смещения d2, d3 и d4, в литературе по статистическому управлению процессами (SPC) считаются постоянными вне зависимости от ФР данных. Данный вывод, основан на многих работах статистиков первой половины прошлого века (Tippett, 1925; Pearson and Adyanthāya, 1928; Pearson, 1950; Cox, 1954). Главные результаты этих и многих других работ, собранные в классической монографии (Дэвид, 1970), показали следующее: если данные были взяты с использованием подгрупп размера n, то стандартное отклонение (СО или SD) можно оценить как средний внутригрупповой размах (я ), делённый на один из коэффициентов коррекции смещения dn (Pearson, 1950; David, 1970):
SDRd, = Т . (7) я/=п d„
Коэффициент dn , зависит от значения n и, как предполагалось, изменяется незначительно при различных ФР. Например, (Реarson, 1950) писал: “Ясно, что по крайней мере, для выборок размера n = 10, ожидание wn/dn, и, следовательно,
, остается удивительно не чувствительным dn к изменениям Pl и^ 2 (Здесь через wn обозначен размах, ^ т.п – средний размах для m подгрупп, каждая размером n, Pl и P2 - квадрат асимметрии и традиционный эксцесс, соответственно)”. Дэвид в своей книге (1970, §7.3) описал “удивительную стабильность” отношения среднего размаха к СО. К такому же заключению, пришел в своей работе И. Барр (Burr, 1967). Данную работу цитируют практически все авторы, обсуждающие влияние отсутствия нормальности на свойства ККШ. И. Барр разработал простую алгебраическую ФР, которая обладает способностью аппроксимировать широкий диапазон как симметричных, так и несимметричных ФР. Эти ФР зависят от коэффициентов асимметрии и эксцесса, которые в его работе изменялись от -0,01 до 4,08 (асимметрия) и от 3,0 до бесконечности (эксцесс). Для всех 29 изученных Барром ФР он рассчитал значения коэффициентов d2, d3 и соответствующие константы ККШ (Burr, 1967, таблицы I-IV, а также рисунок 1 ниже). После этого Барр заключил: «Изучение констант, приведенных в таблицах с I по IV, показывает, что они достаточно стабильны, а в некоторых случаях удивительно стабильны, как, например, A2. Таким образом, можно использовать константы контрольных карт, основанные на нормальной ФР, если распределение не является явно ненормальным. Когда это так, таблицы содержат указания, какие коэффициенты лучше использовать». К сожалению, И. Барр не указал, что с его точки зрения является «явно ненормальным распределением». В результате всех этих более ранних работ в текущей литературе по SPC константы d2, d3 и d4 (и соответствующие константы A2, E2, D3, D4 и т. д.) считаются неизменными практически для всех практических применений.
С другой стороны, большое количество исследовательских статей показывает, что константы d2, d3 и d4 могут заметно отличаться для асимметричных распределений. Однако, как будет показано в примерах ниже, эти результаты не используются ни профессионалами, ни практиками. Цель данной работы состоит в том, чтобы устранить разрыв между теорией и практикой, и предложить практикующему специалисту обоснование того, как и в каких случаях необходимо учитывать отклонение данных от нормального закона распределения.
Для этого сначала будет рассмотрена соответствующая литература по этому вопросу. Затем, в разделе 2 мы представим наши соображения о практическом определении того, когда следует учитывать изменение значений констант ККШ. В конце раздела 2 представлены результаты выполненного нами моделирования. Они включают 2 итоговые таблицы, содержащие значения коэффициентов d2, d3 и d4 для 13 различных ФР для карт x-mR и X-R . Далее, в разделе 3, приведен пример, показывающий, как изменение констант может влиять на интерпретацию ККШ. В последнем разделе представлены выводы и некоторые мысли о возможных направлениях дальнейших исследований.
|
Table 1—Values of d2 and d3; Table II—Values of A3 and E3 for 28 Mon-Normal Populations and the Normal Population, for n = 2,3,4,5, 8,10 |
||||
|
Table I |
Table II |
|||
|
Population м' <1/ с к |
dv |
da |
Ai |
Ei |
|
n=2 3 4 9 8 10 |
n=2 3 4 5 8 10 [ |
n=2 3 4 5 8 10 |
3 l 5 я 10 |
|
|
0.01 3.01 5 8 0.00 3.33 7 3 0 04 3.65 10 2 0.07 2.88 4 10 0.11 3 67 9 2 0.12 3.19 5 4 0.18 3.05 4 6 0.19 3.7* 8 2 0.28 3.48 5 3 0.29 3,86 7 2 0,34 336 4 4 0.35 3.04 3 10 043 4,11 6 2 0.48 3.36 3 6 0.51 3.87 4 3 0 36 3.60 3 5 0.64 4.63 5 2 0.68 4.04 3 4 088 4.12 2 10 0.92 5.13 3 3 0,96 5,94 * 2 LOL 4.71 2 7 1.09 5.12 2 6 152 5.83 2 5 1,43 7 38 2 4 1.59 10.81 3 2 1.91 12.46 2 3 4.08 o> 2 2 Normal |
1 13 1.69 2.06 2.33 2.85 3.08 1 12 1 68 2 05 2 32 2.85 3.09 L11 1 67 2 04 2.31 2.86 3.10 1,13 1.7 0 2.06 2.33 2 84 3.07
Lit 1.67 2.04 2 31 2 85 3 10
1,09 1 64 2.00 2.26 2.77 3,00
1.06 1.60 1.95 2.21 2.73 2.97 1,06 1.58 1.93 2.19 2.73 2 97 LOS 1.55 1.89 2.15 2.67 2.91 ! 0 92 1.37 1.66 1.89 2.33 2.53 1 1.13 1.69 2.C6 2.33 2.85 3.08 |
0.85 0.89 0.88 0.87 0.82 0.80 0.86 0.91 0.91 0.90 0.88 0.86 0.87 0.93 0.94 0.93 OS2 OS! 0.85 0.88 067 0.85 0.79 0.77 0.87 0.93 0.94 0.93 0.92 0.91 0,86 0.90 0.90 0.88 0.85 0.83 0.85 0.89 0.88 0.86 0,82 0,80 0,87 0.93 0.94 0 94 0.92 0.92 0.86 0.91 0.91 0.91 0.86 0.87 0.87 0.93 0.94 0.94 0.93 0.92 0.86 0.90 0.90 0.89 0.86 0.84 0.85 0 89 0.87 0.86 0.81 0.78 0 88 0 94 0.95 0.95 0.94 0.94 0.86 0 90 0.90 0,88 0.85 0,83 0.87 0.92 0.93 0.92 0.91 0 90 0.87 0.91 0.91 0.90 0.87 0.86 0.88 0.95 0.96 0.97 0.97 0.97 0 88 0.93 0.93 0.03 0.91 0.90 0 88 0 94 0.94 0.93 0.90 0,89 0,89 0.96 0.97 0.98 0.98 0.98 0.90 0.97 LOO 1.01 1.03 1.03 0.90 0.97 0.97 0.97 0.95 0 95 0.90 0.97 0.98 0.99 0.98 0.98 0.91 0.99 1.01 1.02 1.02 1.03 0.93 1.01 1.04 1.06 1.09 1.10 0.93 1 02 1.05 1 08 1.12 1.14 0,95 1.05 1.09 1.12 1.16 1.19 0.89 0.99 1.03 1.06 1.12 1.16 0.85 0.89 0.88 0.86 0 83 0.80 |
1.88 1.02 0.73 0.58 0.37 0.31 1 89 1.03 0.73 0.53 0 37 0,31 ISO 1.04 0 7 4 0.58 0 37 0 31 1.88 1.02 0.73 0,58 0 37 0.31 1.90 1.04 0.74 0.58 0 37 0 31 1.89 1.03 0.73 0.58 0,37 0 31 1.88 1.02 0.73 068 0 37 0.31 1.90 1.04 0 74 0 58 0 37 0.31 1.89 1.03 0.73 0 58 0.37 0.31 1S1 1.04 0.74 0 58 0.37 0J1 1.89 LOS 0.73 0 58 0.37 0.31 1.88 1.02 0.73 0.58 0,37 0.31 1.91 1.04 0.74 0.58 0.37 031 1.89 1.03 0.73 0.58 0.38 0.31 1.90 1.04 0.74 0.58 0 37 051 ISO 1.03 0.74 0.58 0.38 031 i 1.92 1.05 0.74 0 59 0 37 0 31 I 1.91 1,04 0.74 0.58 0.38 0.31 1 1.92 1.05 0.75 039 038 031 1.93 1.05 0.75 0.59 038 0.31 1.95 1.06 0.75 0.59 0.38 0.31 1S4 1.06 0.75 0.59 0 38 0.32 1.95 1.06 0.75 0 60 0 38 0,32 1.96 1.07 0.76 0.60 0.39 032 1S9 1.06 0.77 0.61 0.39 0.32 2.01 1.09 0.78 0.61 0.39 0.32 2.05 1.12 0.79 0.62 0,40 0.33 2 31 137 0.90 0.71 0.45 037 1.88 1.02 0 7 3 0 38 0.37 0.31 |
2.66 1.77 1.46 1.29 1.05 0.97 2.68 L78 1.46 1.29 1 05 0.97 2 69 1 79 1 47 130 1.05 0S7 2.65 1.77 1.45 1.29 1.06 0.98 2.69 1.79 1.47 1 30 1 05 0 97 2.67 1.78 1.46 139 1.05 037 2.66 1.77 1.46 1.29 1.05 OM 2.69 1.80 1.47 1.30 1.05 0.97 2.68 1.79 1.47 130 1.05 0.97 2.70 1.80 1.47 1 30 1.05 0.97 2.67 1.78 1.46 1.30 1.06 0.98 2.66 1.77 1.46 139 1.06 0.98 2.70 1.80 1.48 130 1.05 097 2.68 1.78 1.47 1.30 1.06 0.98 2.69 1.80 1 47 1 30 1.06 0.98 2.68 1.79 1.47 1 30 1.06 0.98 2.72 1.81 1 49 131 1 06 0.97 2.70 1.80 1.48 1.31 1.07 098 2.72 1.81 1.49 132 1.08 1.00 2,74 1.82 1.50 1.32 1.07 0.99 2.75 1.83 1,50 1.33 1.07 0.98 2 74 1.83 130 1.33 1.06 LOO 2.76 1,84 1.51 1.33 1.09 1,00 2.78 1.85 1.52 1.34 1.09 1.00 2.82 1.88 134 138 1.10 1.01 2.84 1.90 1.55 137 LIO 1 01 2.91 1.94 1 59 1 40 1.12 1.03 3 27 2.20 180 139 129 1.18 | 2 66 1.77 1.46 139 1.05 0 97 |
Рис. 1 – Таблица значений коэффициентов ККШ d2, d3 и A2, E2 из статьи (I. Burr, 1967, Table I]
1. РЕЗУЛЬТАТЫ «ПОСЛЕ БАРРА»
Есть много работ, анализирующих свойства ККШ, в условиях отсутствия нормальности. Ниже будут описаны те них, которые представляют интерес с точки зрения данной работы. Для более тщательного изучения всей литературы по этой тематике следовало бы написать отдельную работу.
Шиллинг и Нельсон (Schilling and Nelson, 1976) обсуждали влияние отсутствия нормальности на эффективность карты для средних значений. Их главный интерес заключался в оценке вероятности ошибки 1 рода для трехсигмовых пределов, однако, коэффициенты ККШ как таковые в данной работе не обсуждались. Были рассмотрены следующие ФР: прямоугольное, треугольное, гамма с различными параметрами значений, симметричное бимодальное и асимметричное бимодальное для карт с объёмом выборки от n = 2 до n = 100. Авторы данной статьи, согласились с заключением Шухарта (Shewhart 1931/1980) о том, что «… почти во всех случаях на практике мы можем установить выборочные пределы для средних значений по подгруппам, равным четырем и более, на основании теории нормального закона». В той же работе было подчеркнуто: «Многолетний опыт показал, что трёхсигмовые пределы для выборок небольшого объема имеют исключительную практическую ценность. Максимальный риск 1 из 72 для самых экстремальных изученных случаев (гамма, α = 1/2) означает, что данного объёма выборки (от 4 и более) достаточно для большинства практических применений». Мы вернемся к этой идее двух известных статистиков позже.
К противоположному мнению пришли С. Йорстон и У. Циммер (Yourstone and Zimmer, 1992). Они рассчитали среднюю длину серии (ARL) для 27 типов ФР Барра с асимметрией от -0,209 до 1,190 и эксцессом от 2,997 до 5,093. ARL изменялась от 389 до 83 в зависимости от значений асимметрии и эксцесса. Авторы данной статьи пришли к заключению, что влияние отсутствия нормальности на карту средних существенно, т.к., по их мнению, значения ARL менялись существенно (ARL = 83 почти в 4,5 раза меньше стандартного значения, равного 370,4).
Группа австралийских ученых – Т. Спеддинг и П. Роулингс (Spedding and Rawlings, 1994), изучила влияние отклонения ФР от нормального закона на свойства карты средних и СО. Для анализа они использовали систему кривых Джонсона, которая, с их точки зрения, имеет некоторые преимущества по сравнению с системой кривых Пирсона. С помощью моделирования они получили контрольные пределы карты средних и карты СО для ФР со средним значением, равным нулю, стандартным отклонением, равным
1, асимметрией, равной 2, и эксцессом, равным 7. Объём выборки (n) в их работе изменялся от 4 до 50. Полученные результаты для карты средних значений с объемом выборки 4 и более совпали с выводами У. Шухарта (1931/1980), И. Барра (1967), Э. Шиллинга и П. Нельсона (1976). Что касается карты СО, то авторы данной работы считают традиционные формулы “менее точными”. Поэтому в случае получения сигнала о выходе за контрольные границы, они предложили использовать дополнительную выборку. Кроме того, они подчеркнули главный недостаток своего подхода: “Для мелкосерийного производства, где распределение неизвестно, могут возникнуть значительные ошибки, связанные с такими статистическими показателями как асимметрия и эксцесс...” (Spedding and Rawlings, 1994, c. 36). Мы полагаем, что любые попытки улучшить работу ККШ путем подбора соответствующих Пир-соновских или Джонсоновских ФР имеют очень ограниченную практическую ценность, т.к. эти процедуры весьма сложны для не статистиков, и, кроме того, на практике объём данных обычно недостаточен для определения параметров ФР.
Бай и Чой (Bai and Choi, 1995) модифицировали метод взвешенной дисперсии (WV) с целью получения асимметричных контрольных пределов в соответствии с направлением и степенью асимметрии, оцененными по выборочным данным. Они рассмотрели следующие ФР: распределение Вейбулла, логнормальное, три версии распределений Барра, и предложили эвристический метод расчета пределов ККШ. Авторы сравнили пределы, полученные тремя различными методами: Шухартом (1931/1980), Ферреллом (1958) и их версией метода WV (1995), и пришли к выводу о некоторых преимуществах их подхода. Сравнение было основано на расчетах вероятности ошибки первого типа. Тем не менее, к главному недостатку данного подхода, следует отнести его сложность для практиков.
Чан и Цуй (Chan and Cui, (2003) усовершенствовали подход Бая и Чоя (Bai and Choi, 1995), используя коэффициент асимметрии выборки (k3), и вывели формулы, позволяющие вычислять значения коэффициентов A2 , D3 , D4 , E2 в зависимости от k3 (коэффициент асимметрии). ФР, рассмотренные в этой работе, включали Вейбулловское и логнормальное распределения, а также четыре ФР Барра. Сравнение значений d2 в таблице 4 работы (Chan and Cui, 2003) с результатами таблицы 1 статьи Барра (1967) демонстрирует их близкое совпадение. К тому же, в данной работе авторы показали важную критическую проблему метода их коллег Бая и Чоя (1995), представив пример нечувствительности разработанной ими модели к асимметрии ФР. На наш взгляд, проблема работы (Chan and Cui, 2003) заключается в том, что оценки коэффи- циента асимметрии имеют очень большой разброс при определении их по выборочным данным, особенно для небольших выборок. К тому же, для каждого набора данных нужно заново вычислять все константы контрольной карты, что может создавать очевидные трудности для персонала без специальной статистической подготовки.
Книга Д. Уилера “Advanced Topics in SPC” была опубликована в 1995 году (Wheeler, 1995). Проблема отсутствия нормальности обсуждается там несколько раз. Пределы трех сигм “... достаточно консервативны, чтобы быть нечувствительными к ненормальности данных, даже если объем подгруппы равен единице” (1995, с. 21). В 5-й главе Уилер приводит результаты Барра (1967) для 28 ФР и представляет рисунок 5.7 (Wheeler, 1995, с. 125), где показаны зависимости d2 и d3 от асимметрии и эксцесса. Обсуждая этот рисунок, Уилер пишет: «Значения как для d2 , так и для d3 не очень чувствительны к ненормальности. Это означает, что можно использовать обычные значения d2 и d3 , для нормальных или ненормальных данных» (Wheeler, 1995, с. 125). Позже, в своей статье в журнале «Qual-ity digest» (Wheeler, 2010) автор возвратился к этому вопросу и в заключении отметил «Трех-сигмовые пределы дают значения вероятности p , превышающие значение 0,975 с любым вариантом распределений, которые обеспечивают разумную модель предсказуемого процесса». С этим утверждением нельзя не согласиться, однако, значение вероятности, равное 0,975 дает ARL, равную 40 – что более чем в 9 раз меньше стандартного значения 370,4.
Боррор, Монтгомери, и Рунгер (Borror, Montgomery, and Runger, 1999) исследовали робастность карт типа EWMA для распределений, отличных от нормального, и параллельно проанализировали поведение карты x-mR в таких же условиях. Стоит отметить, что среди всех вышеперечисленных работ это единственная работа, посвященная данному типу ККШ, т.к. все остальные авторы в основном интересовались картами с n > 1. Этот факт говорит о недостаточной изученности поведения карты x-mR в том случае, если ФР изучаемых параметров процесса отличается от нормального закона. Авторы (Borror, Montgomery, and Runger, 1999) рассмотрели симметричные t-распределения и несимметричные гамма-распределения с различными значениями параметра формы. В данной работе было обнаружено, что значения ARL для гамма-распределений существенно уменьшаются. Это означает, что вероятность ошибки первого типа возрастает с 0,0027 для нормальной ФР до 0,0222 для гамма-распределения с параметром формы 0,5. Стоит отметить, что значение 0,0222 очень близко к полученному Уилером значению в работе (Wheeler, 1995) = 0,025 (1 – 0,975), но в отличие от Уилера, авторы данной работы считают данное отклонение значительным.
В работе (Vermaat, Ion., Does, and Klaassen, 2003) большая группа авторов изучала поведение различных типов ККШ, включая карты типа x-mR . В ходе проведенного исследования, они пришли к выводу, что эффективность карты индивидуальных значений «крайне низка в управляемом состоянии», поэтому авторы предложили использовать карты, основанные на непараметрической теории и теории экстремальных значений. Однако, они подчеркнули, что для использования этих двух типов карт необходимо по меньшей мере 500, а желательно 1000 наблюдений в фазе 1. Очевидно, что соблюдение этих рекомендаций практиками маловероятно.
Недавно группа авторов представила работу, посвященную влиянию отсутствия нормальности на хвосты различных ФР (Huberts, Schoonhoven, Goedhart, Diko, Does, 2018). Авторы исследовали применимость центральной предельной теоремы к большим несимметричным наборам данных. Для своего эксперимента, они использовали следующие ФР: нормальное, равномерное, Стьюдента, логистическое, логнормальное, гамма и χ 2 для выборок объёмом от n = 5 и до n = 1000. Авторы заключили, что пригодность коэффициентов ККШ зависит от большого числа различных факторов (объем выборки, количество подгрупп, степень отклонения от нормальности, желаемая производительность карты), и рекомендовали использовать контрольную карту средних X в рамках нормального закона с осторожностью даже при относительно больших объёмах данных”.
Подводя итог, можно сказать, что существует вполне удовлетворительный консенсус относительно влияния отсутствия нормальности на работу карт X -R или X-S с размерами выборки более 4. В этом случае традиционные формулы Шухарта работают с достаточной для большинства практиков точностью. Существует неясная ситуация о влиянии асимметрии данных на работу карт X-R или X -S с размерами выборки n = 2 и 3. Полностью отсутствует единое мнение по поводу карты x-mR: два широко признанных эксперта – Д. Уилер и Д. Монтгомери имеют противоположные мнения по этому поводу (см. Wheeler, 1995, и Montgomery, 2009). Кроме того, оказалось, что анализу карт индивидуальных значений и скользящих размахов посвящено очень мало работ. Вот почему данная работа сосредоточена больше всего на картах x-mR и X -R с размером выборки n = 2 и 3, и, соответственно, на константах А2 , E2 , D4 и E5. Такая концентрация имеет две дополнительные причины. Во-первых, прежде чем строить какую-либо карту, нужно построить и проанализиро- вать карту хода процесса. Эта карта необходима для того, чтобы ответить на вопрос: однородны данные или нет; и присутствуют ли какие-либо паттерны (тренды, меандры, повторяющиеся группы точек) или нет. Ответы на эти вопросы имеют решающее значение для разумного анализа данных (см., например, Alwan and Roberts ,1995; Wheeler, 2020). К сожалению, эти вопросы очень редко обсуждаются в литературе по SPC, и мы регулярно сталкиваемся с этими проблемами на собственном опыте. Как пишет Уилер (Wheeler, 2020), необходимо “построить графики, которые позволят данным говорить самим за себя”. Карта x-mR удовлетворяет этому требованию автоматически, потому что она состоит из карты хода процесса с нанесенными на нее контрольными пределами. Во-вторых, эта карта является самой простой с точки зрения расчетов и, одновременно, не имеет некоторых проблем, которые возникают при использовании карты средних (например, проблем рациональной группировкой), не говоря уже о более сложных графиках, таких как CUSUM или EWMA.
2. ДОЛЖНЫ ЛИ БЫТЬ НЕИЗМЕННЫМИ КОЭФФИЦИЕНТЫ ККШ?
Принимая во внимание результаты упомянутых работ, мы заинтересовались ответами на следующие вопросы:
-
1 ) Есть ли необходимость в изменении стандартных значений констант A2, D3, D4, E2, E5 ( d2, d3, и d4)?
-
2 ) Если да, то, когда и каким образом следует их изменять?
Нашей отправной точкой была целесообразность любых рекомендаций для практикующих специалистов. Мы уверены, что ни один практик не заинтересован в каких-то вероятностях - всё, что они хотят - это иметь процедуру, похожую на описанную Шухартом для построения контрольной карты. Под процедурой, описанной Шухартом, мы подразумеваем формулы типа (1) с заданными значениями коэффициентов. Наше мнение о поведении практиков опирается на наш собственный опыт плюс призыв Шиллинга и Нельсона (1976) не считать вероятностные характеристики священными заповедями. Та же идея принадлежит и одному из крупнейших современных экспертов в области SPC Биллу Вудалу (Woodal, 2019, с. 597): “Практики могут не требовать точных значений частоты ложных сигналов, но им нужно хотя бы некоторое представление о том, с какой частотой будет возникать ложный сигнал”.
Значительно ли изменяются константы?
Для ответа на этот вопрос мы взяли данные Таблицы II из статьи И. Барра (см. рисунок 1), и рассчитали относительное изменение значений коэффициентов A2 и E2 в зависимости от значений параметра Pl при различных объёмах выборок (n = 2, 5, 10). Результаты показаны на рисунке 2. Относительные изменения значений коэффициентов A2 и E2 практически одинаковы, и не превышают 5 % до значений Pl = 2, поэтому на рисунке 2 точки для А2 отсутствуют. При дальнейшем росте степени асимметрии Pi >2 , относительное изменение коэффициентов ККШ растёт и начинает превышать 5 %, а при Pi = 16, оно достигает примерно 20 %. Отсюда возникают вопрос – являются ли для практиков такие изменения коэффициентов существенными или нет? Как много новых точек будет получено, если изменить стандартные значения коэффициентов ККШ в соответствии с уровнем асимметрии. Ответ ясен: это всегда будет зависеть от свойств конкретного процесса. Мы вернемся к практической стороне этого вопроса позже, когда рассмотрим пример анализа реальных данных. Относительное изменение в 20 % означает, что (при условии соответствия нормальному распределению) вместо стандартных значений верхнего или нижнего контрольных пределов (ВКП – верхний контрольный предел)/ НКП – нижний контрольный предел), равных 3 (при условии, что сигма равна единице), мы получим фактические значения 3,6 и 2,4. Это соответствует переходу от значения вероятности 0,0027 к значениям 0,00032 или 0,0164. Таким образом, вероятность получения ложного сигнала будет почти в 8,5 раз меньше стандартного значения 0,0027 или в перерасчете на среднюю длину серии между ложными тревогами (ARL) почти в 6,1 раз выше. Стоит ли принимать во внимание такую разницу? На самом деле мы не видим никаких объективных критериев, чтобы решить, какое отклонение следует признать существенным. В конечном счете, правило трех сигм тоже не закон природы, а результат всеобщей договоренности.
Чтобы ликвидировать данный разрыв между теорией и практикой, мы решили установить операциональное правило принятия решения относительно степени влияния отсутствия нормальности на ККШ, и потом исследовать следствия принятия такого правила. Итак, в качестве условия значительного изменения, т.е. изменения, требующего учёта влияния реальной ФР на границы ККШ, мы предлагаем установить двухкратное уменьшение вероятности выхода за один из контрольных пределов (например, ВКП). Конечно, данное значение следуют еще обсудить с научным сообществом и одобрить или отклонить, исходя из дальнейших исследований. Тем не менее, в случае использования данного значения вероятности, вместо ожидаемого для ВКП значения, равного трём, мы полу- чим значение равное 2,782, т.е. относительное уменьшение нижнего контрольного предела составит 7,26 %. Другими словами, мы предлагаем считать относительное изменение коэффициентов ККШ значительным, если оно превышает 7,26 %. Данная граница значений, показана на рисунке 2 прямой горизонтальной линией. Применяя это правило можно утверждать, что для коэффициента E2 есть как минимум 2 различных случая, когда отклонение ФР удовлетворяют принятому допущению о значительном изменении констант ККШ (точки с относительным изменением 9,39 % и 16,64 %), но основная масса точек осталась за принятой границей. Очевидно, что на практике таких ФР должно быть гораздо больше, учитывая тот факт, что И. Барр в своей работе (I. Burr, 1967) рассмотрел только одно семейство распределений.
Из данных рисунка 2 можно сделать ещё один важный вывод: относительное изменение коэффициентов ККШ уменьшается при увеличении объема выборки n . Это означает, что для оценки максимального возможного влияния отсутствия нормальности на изменение значений коэффициентов ККШ целесообразно анализировать карту с n = 1. Это еще один аргумент в пользу рассмотрения влияния отсутствия нормальности на ККШ типа x-mR .
Выбор типов и параметров ФР для моделирования
Чтобы выбрать ФР для нашего моделирования мы решили обратиться к хорошо известной плоскости значений кривых Пирсона – и . На рисунке 3 синим цветом, обозначены точки, полученные по предыдущим исследованиям других авторов по данной тематике.
В работе (Pearson и Adyanthāya, 1928) анализировали только симметричные ФР с различными значениями эксцесса, поэтому все точки, полученные в данной работе, лежат на оси . На рисунке 3 данные значения ФР обозначены точками PA1, 2, 3, 4. В работе (Pearson, 1950) автор исследовал как симметричные, так и не симметричные ФР (обозначены точками Prs 1, 2, 3). Д. Кокс (Cox, 1954) анализировала две специфических формы гамма распределения: экспоненциальное и распределение Эрланга . Обе ФР из этой работы лежат на красной линии на рис. 3 (обозначены Cox1, 2). И. Барр (1967) представил значения 29 ФР в его таблицах I-IV. На рис. 3 мы показали 5 из них (обозначены B1… B5).
Все точки из перечисленных ранних работ лежат в довольно узкой области на плоскости. Чтобы расширить уже имеющиеся результаты для анализа были выбраны ФР, лежащие на плоскости кривых Пирсона между черной и синей линиями. Все ФР, выбранные для моделирования, перечислены в таблице 1 и показаны на рисунке 3 красными точками (исключение составляет только распределение Lgau4, имеющее очень большие значения β 1 и β 2 , что не позволяет нанести эту точку на плоскость β 1 - β 2 ) . Нормальное и равномерное распределения добавлены в этот перечень для сравнения. Логистическое распределение добавлено как представитель отличной от нормальной, но симметричной ФР.
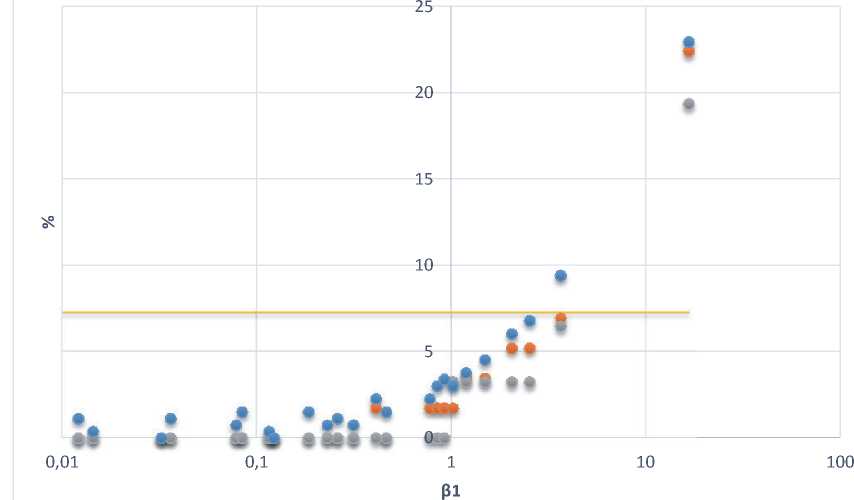
• А2: n=5 • A2: n=10 • E2 7.26%
Рис. 2 – Относительное изменение значений A2 и E2 в зависимости от значений параметра для выборок с n = 5, 10 (коэффициент А2 для n =2 совпадает с Е2 )
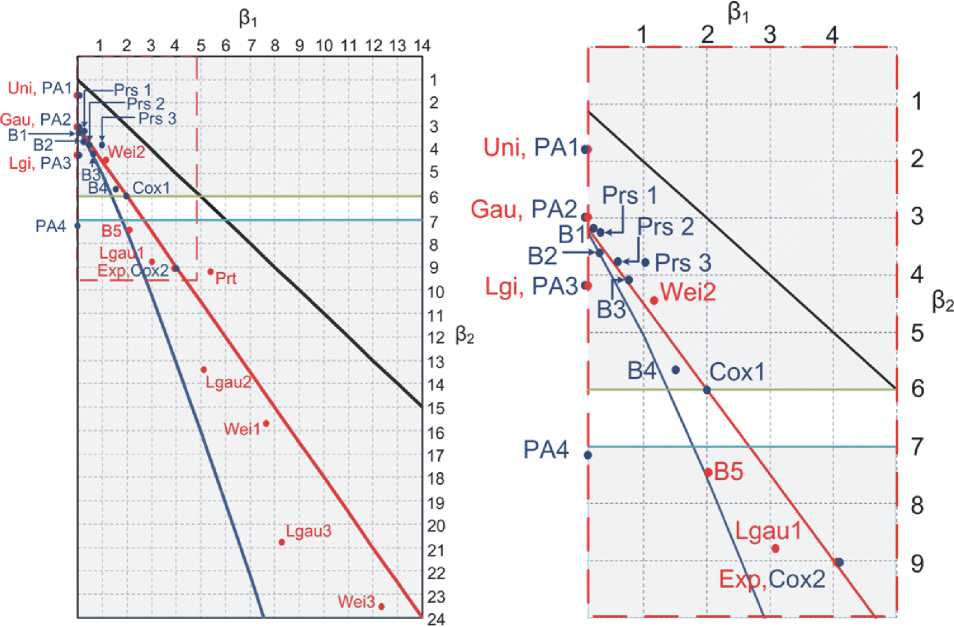
Рис. 3 - ФР изучаемые ранее и рассмотренные в этой работе на плоскости и . Координаты точек: Gau (0; 3), Uni (0; 1,8), Lgi (0; 4,2), Wei1 (7,92; 15,7), Wei2 (1,15; 4,4), Wei3 (12,24; 23,54), Exp (4; 9), Lgau1 (3,06; 8,6), Lgau2 (5,11; 13,27), Lgau3 (8,34; 20,79), Prt (5,48; 9,13), B1 (0,03; 3,05), B2 (0,31; 3,6), B3 (0,77; 4,12), B4 (1,49; 5,83), B5 (2,04; 7,36), Cox1 (2; 6), Cox2 (4; 9), PA1 (0; 1,8), PA2 (0; 3), PA3 (0; 4,12), PA4 (0; 7,07), Prs1 (0,2; 3,3), Prs2 (0,5; 3,75), Prs3 (1; 3,8)
Таблица 1. – Перечень ФР, исследованных в данной работе
|
# |
Функция распределения |
Параметры ФР |
0 1 |
^ 2 |
Название точек на рисунке 3 |
|
1 |
Нормальное распределение |
Среднее = 0, СО = 1 |
0,00 |
3,00 |
Gau |
|
2 |
Равномерное распределение |
Среднее = 0, СО = 1 |
0,00 |
1,80 |
Uni |
|
3 |
Экспоненциальное распределение |
Вероятность ( р ) = 0,1, 0,2, 0,01 |
4,00 |
9,00 |
Exp |
|
4 |
Логнормальное распределение |
Среднее = 0, СО = 0,5 |
3,06 |
8,90 |
Lgau1 |
|
5 |
Среднее = 0, СО = 0,6 |
5,11 |
13,27 |
Lgau2 |
|
|
6 |
Среднее = 0,СО = 0,7 |
8,34 |
20,79 |
Lgau3 |
|
|
7 |
Среднее = 0, СО = 1,0 |
38,25 |
113,94 |
Lgau4 |
|
|
8 |
Распределение Вейбулла |
Параметр формы = 0,8 |
7,92 |
15,7 |
Wei1 |
|
9 |
Параметр формы =1,5 |
1,15 |
4,40 |
Wei2 |
|
|
10 |
Параметр формы = 0,7 |
12,24 |
23,54 |
Wei3 |
|
|
11 |
Логистическое распределение |
Среднее = 0, СО = 1 |
0,00 |
4,20 |
Lgi |
|
12 |
Распределение Барра |
Одно из значений таблицы Барра параметрами c = 2, к = 4 (рис. 1) |
2,04 |
7,36 |
B5 |
|
13 |
Распределение Парето |
Параметр формы = 20 |
5,48 |
9,13 |
Prt |
Для оценки влияния изменения значений коэффициентов ККШ в одном семействе распределений, для анализа было выбрано несколько вариантов логнормального распределения и распределения Вейбулла с различными значениями параметра формы.
Моделирование и результаты
В ходе моделирования данных и расчета коэффициентов ККШ типа x-mR для каждой из перечисленных в таблице 2 ФР генерировалась подгруппа объёмом 400 значений ( m = 400). Таких подгрупп генерировалось также 400, т.е. для каждой ФР было получено 160000 случайных значений. По каждой из подгрупп были рассчитаны скользящие размахи, среднее значение, медиана и СО, после чего с рассчитывались значения коэффициентов коррекции смещения d2, d3 и d4 . Таким образом, мы получили 400 точек, что позволило рассчитать средние значения и СО коэффициентов коррекции смещения d2, d3 и d4 для каждой ФР. Далее были рассчитаны коэффициенты контрольных карт E2, E5, D4, а также их относительные отклонения от стандартных значений. Эти результаты представлены в таблице 2.
Моделирование данных для контрольной карты средних и размахов с n = 2, 3 проводилось по аналогии с моделированием для карты x-mR. Только в данном случае моделировались подгруппы случайных чисел объёмом 2 и 3 для каждого анализируемого распределения, соответственно. Так, например, для n = 3, было сгенерировано по 480000 случайных значений, чтобы получить 400 подгрупп по 3 значения в каждой подгруппе. Для каждого значения n, было рассчитано значение размаха, среднего и стандарт- ного отклонения. Затем были рассчитаны коэффициенты коррекции смещения d2, d3 и d4, и коэффициенты А2, D4. Результаты полученные в ходе проведения данного исследования для карты -R представлены в таблице 3.
Все рассчитанные значения коэффициентов d2, d3 и d4 для нормального распределения совпадают со стандартными значениями из таблицы 1 c погрешностью не более 0,2 %. Для экспоненциального распределения с различными параметрами вероятности p расхождения в полученных коэффициентах d2, d3 и d4 составляет не более 1%. Из-за отсутствия зависимости, для этого распределения было решено по умолчанию, использовать параметр вероятности p равный 0,01.
Значение коэффициента d2 из таблицы 2 соответствует результатам, полученным в работе Кокс (Cox, 1954) для экспоненциального распределения. Так же, результаты работы Пирсона и Адьянтхая сопоставимы с полученными в данной работе значениями для равномерного распределения, а их результаты при = 7,07 ( d2 = 1,020) сопоставимы с полученными результатами для распределения Барра с параметрами формы c = 2 и k = 4. Таким образом, можно сделать заключение о том, что полученные в данной работе результаты согласуются с результатами предыдущих исследований.
Если принять предложенный нами уровень 7,26% как условие существенного влияния на границы ККШ, то приведённые в таблицах 2 и 3 результаты приводят к важному выводу о необходимости изменить коэффициенты контрольных карт для следующих ФР:
- экспоненциальное (и геометрическое);
Таблица 2 – Полученные при моделировании значения факторов смещения и коэффициентов ККШ для карты x-mR
d2
d3
d4
E2
E5
D4
CO(d;)
CO(d3)
CO(d4)
SE2, %
SE5, %
SD4, %
Станд знач..
1,13
0,85
0,954
2,660
3,145
3,268
Gau
1,13
0,85
0,96
2,66
3,14
3,26
0,032
0,030
0,050
-0,10
-0,12
-0,21
Uni
1,16
0,82
1,02
2,60
2,95
3,12
0,036
0,021
0,059
-2,44
-6,21
-4,60
Exp
1,03
0,99
0,69
2,99
4,29
3,97
0,040
0,047
0,075
12,44
36,47
21,58
Weil
0,93
1,07
0,57
3,24
5,29
4,46
0,047
0,044
0,063
21,66
68,24
36,36
Wei2
1,09
0,90
0,87
2,75
3,44
3,47
0,034
0,033
0,055
3,37
9,52
6,24
Wei3
0,87
1,11
0,47
3,46
6,33
4,85
0,054
0,048
0,065
29,93
101,24
48,42
Lgaul
0,83
1,14
0,46
2,88
3,84
3,76
0,081
0,061
0,060
35,23
106,92
56,30
Lgau2
1,00
0,99
0,72
2,99
4,18
3,98
0,047
0,048
0,064
12,44
32,85
21,67
Lgau3
0,97
1,03
0,66
3,11
4,58
4,21
0,056
0,055
0,069
16,87
45,63
28,77
Lgau4
0,83
1,14
0,46
3,63
6,58
5,15
0,084
0,064
0,077
36,37
109,19
57,59
Lgi
1,10
0,88
0,90
2,72
3,32
3,40
0,033
0,035
0,052
2,16
5,75
4,11
B5
1,07
0,93
0,83
2,81
3,60
3,60
0,043
0,042
0,066
5,70
14,38
10,27
Prt
0,98
1,02
0,66
3,07
4,56
4,13
0,044
0,040
0,063
15,32
44,97
26,44
Таблица 3 – Полученные при моделировании значения факторов смещения и коэффициентов ККШ для карты средних и размахов ( -R) при n = 2, 3
^2
d3
d4
A2
D4
CO(d2)
CO(d3)
CO(d4)
SA2 ,%**
6D4, %
n = 2
Станд. знач.
l,l28
0,8525
0,954
l,880
3,268
Gau
1,128
0,852
0,953
1,881
3,266
0,031
0,029
0,049
0,03
-0,06
Exp
1,000
0,998
0,692
2,121
3,994
0,035
0,033
0,052
12,84
22,22
Weil
0,921
1,074
0,560
2,303
4,498
0,038
0,041
0,050
22,51
37,65
Wei3
0,865
1,120
0,475
2,452
4,884
0,042
0,041
0,049
30,45
49,46
Lgaul
1,149
0.995
0,904
1,846
3,598
0,034
0,038
0,046
-1,80
10,10
Lgau2
1,005
0,994
0,718
2,111
3,967
0,040
0,042
0,055
12,27
21,39
Lgau3
0,956
1,041
0,642
2,219
4,267
0,049
0,046
0,059
18,03
30,56
Lgau4
0,818
1,155
0,447
2,593
5,236
0,068
0,058
0,059
37,94
60,22
Prt
0,978
1,027
0,657
2,169
4,150
0,036
0,037
0,053
15,37
27,00
n = 3
Станд. знач.
l,693
0,8884
l,588
l,023
2,575
Gau
1,690
0,890
1,584
1,025
2,578
0,026
0,028
0,047
0,18
0,12
Exp
1,504
1,115
1,233
1,152
3,226
0,036
0,033
0,065
12,65
25,26
Weil
1,385
1,229
1,036
1,251
3,662
0,043
0,037
0,068
22,25
42,22
Wei3
1,298
1,301
0,899
1,334
4,007
0,048
0,040
0,069
30,44
55,61
Lgaul
1,557
1,062
1,327
1,112
3,046
0,034
0,040
0,058
8,74
18,30
Lgau2
1,503
1,125
1,231
1,152
3,246
0,043
0,044
0,064
12,65
26,04
Lgau3
1,434
1,191
1,120
1,208
3,492
0,051
0,048
0,072
18,07
35,60
Lgau4
1,215
1,365
0,807
1,429
4,381
0,090
0,061
0,092
39,70
70,14
Prt
1,463
1,159
1,164
1,184
3,377
0,041
0,037
0,065
15,73
31,13
- распределение Вейбулла (с параметром формы < 1);
- логнормальное распределение (при СО ≥ 0,5);
- распределение Барра (B5);
- распределение Парето.
3. ПРИМЕР ИСПОЛЬЗОВАНИЯ ИЗМЕНЕННЫХ КОЭФФИЦИЕНТОВ ККШ
В этих случаях, новые границы будут лежать дальше от центральной линии, чем это следует из традиционного подхода (коэффициенты коррекции смещения d2, d3 и d4 уменьшаются, коэффициенты ККШ соответственно увеличиваются). Это означает, что без поправки на отсутствие нормальности на ККШ будут присутствовать ложные сигналы, т.е. стабильные на самом деле процессы могут идентифицироваться как нестабильные. Так же, возвращаясь к рисунку 3, можно сделать вывод о том, что все ФР требующие изменения коэффициентов, лежат ниже горизонтальной линии = 7.
Графики ЭФР для множителей коррекции показывают, что большинство ФР близки к нормальному закону (рисунок 4). Очевидные отклонения от нормального закона наблюдаются для ЭФР коэффициента d2 у логнормального распределения, а также у распределения Барра. Те же самые ЭФР явно отклоняются от прямой линии и для коэффициента d3.
Сравнение полученных коэффициентов ККШ в таблицах 2 и 3 показало, что коэффициенты d2, d3 и d4 карт x-mR и -R при n = 2 практически совпадают друг с другом. Это было вполне ожидаемо, т.к. при моделировании использовались выборки независимых случайных чисел, и в этом случае нет никакой разницы в вариации внутри или между подгруппами.
Логарифмически нормальное распределение с СО = 1,0 показывает наибольшее влияние на коэффициенты ККШ. Следующим является распределение Вейбулла с параметром формы = 0,7. Сопоставляя данные между табл. 2 и 3 и рисунком 3 можно сделать вывод о том, что чем выше точка ФР лежит на плоскости β 1 - β 2 , тем меньше отклонение коэффициентов ККШ от их традиционных значений. Коэффициенты ККШ для карты средних и размахов ( -R) имеют меньшее относительное изменение значений, чем для карты x-mR.
В качестве примера применения измененных коэффициентов для пересчета контроль-
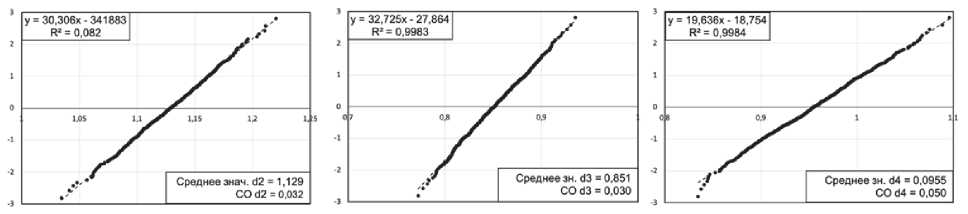
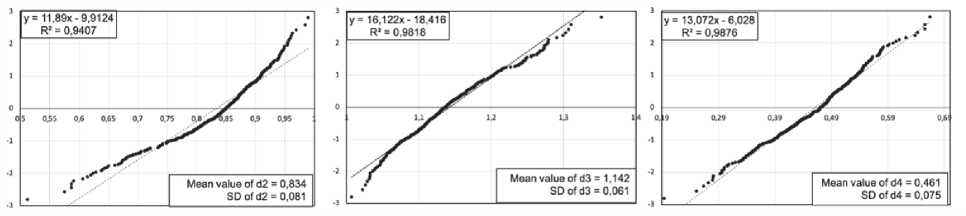
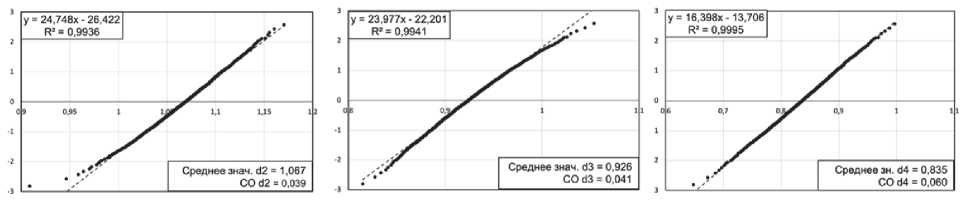
Рис. 4 – Результаты моделирования d2, d3 и d4 для нормального, логнормального распределений и распределения Барра
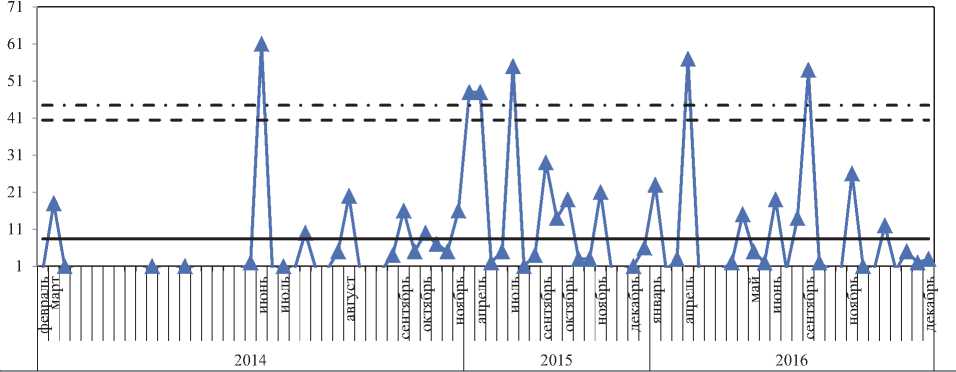
ных пределов были взяты данные о задержке поставок машин с металлом одной из европейских металлургических компаний в Россию. Единица измерения – количество дней, которые прошли между каждой из задержек поставок (подробнее о данном методе построения ККШ в (Wheeler, 2011)). Этот выбор не случаен, т.к. данные по задержкам поставок содержат большое количество нулей (случай, когда несколько машин пришло в один и тот же день). Построенные непосредственно по этим данным, ККШ оказываются малоинформативными из-за большого количества нулевых значений, занижающих среднее и, соответственно, границы карты, что приводит к появлению большого количества ложных сигналов. Данные о задержках более 2 недель было решено не учитывать в данном анализе, т.к. они в большинстве своем содержат более редкие специальные причины вариаций, и для улучшения показателей процесса каждый конкретный случай задержки нужно рассматривать отдельно.
Построенные традиционным способом ККШ типа x-mR по данным о количестве дней между задержками поставок для задержек в 1 и 2 недели показаны на рисунке 5 (ВКП обозначен пунктирной линией). На данном рисунке видно, что процесс не стабилен, 8 точек выходят за контрольные пределы на карте индивидуаль- ных значений и 6 точек на карте скользящих размахов. Так же на обеих картах видно 4 пика, когда количество дней между задержками было максимальным.
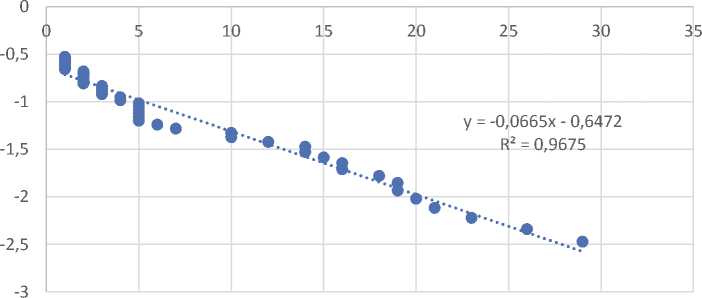
Для дальнейшего анализа, по этим данным была построена эмпирическая функция распределения (ЭФР) на сетке геометрического распределения. Как видно из рисунка 6, для интервалов [1; 29] и [48; 61] дней между задержками есть удовлетворительное согласие с прямой линией, а значит можно сделать вывод о том, что для этих интервалов данные соответствуют геометрическому распределению. Соответственно, можно пересчитать константы контрольной карты, используя значения коэффициентов карты для экспоненциальной/геометрической ФР.
На рисунке 5 пунктирной линией с точкой показаны контрольные пределы, рассчитанные с измененными коэффициентами. Очевидно, что в данном случае 2 точки на карте скользящих из 9 на x-mR -карте лежат ниже скорректированных контрольных пределов, а это 20% от всех сигналов специальных причин вариаций. Конечно, на сколько точек вообще повлияет изменение констант карты, если таковое будет, заранее неизвестно. Все будет зависеть от исследуемого процесса. Но мы уверены, что для всех сильно ненормальных ФР необходима коррекция констант карты, и предложенная здесь
Карта х для числа дней между задержками поставок
Карта mR для числа дней между задержками поставок
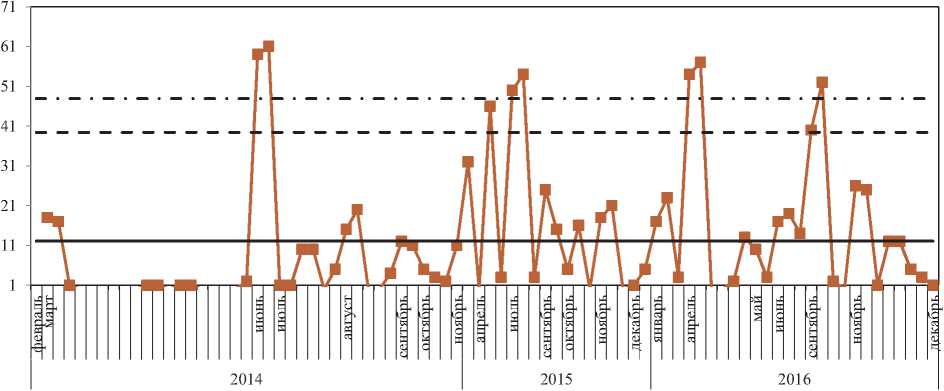
Рис. 5 – x-mR карта для данных о днях между задержками поставок металла. Пунктирная линия – традиционные контрольные пределы, пунктирная линия с точками – обновленные контрольные пределы
процедура такой коррекции является наиболее простой и удобной для практиков. Подробное описание анализа подобных данных можно найти в работе (Шереметьева, Шпер, 2021).
ЗАКЛЮЧЕНИЕ И НЕКОТОРЫЕ ИДЕИ БУДУЩИХ ИССЛЕДОВАНИЙ
В данной работе была предпринята попытка улучшить работу простой x-mR-карты в случае, когда ФР данных не подчиняется нормальному закону распределения. Основные руководящие идеи авторов состояли в том, чтобы приблизить метод построения ККШ к реальности и, одновременно, сохранить их таким же простым инструментом, как они были описаны во всех справочниках и руководствах по SPC, избегая по возможности статистических трудностей для практиков. В заключении, мы предлагаем следующий алгоритм построения ККШ:
На первом этапе работы необходимо построить карту хода процесса для визуального анализа однородности данных. Если данные однородны, можно переходить к выполнению следующего пункта. Если данные неоднородны, то нужно провести дополнительный анализ на предмет возможных трендов или изменений в системе, и выделить участки однородности, т.е. провести стратификацию данных.
На втором этапе следует принять решение о типе используемой ККШ. Если планируется применить карту средних и размахов с объёмом подгрупп ( n ) больше 3, то нужно следовать традиционному подходу к расчёту границ ККШ. Если планируется применить карту x-mR или карту с n ≤ 3 , необходимо проверить нормальность ФР данных.
ЭФР для дней между задержками на сетке геом распред, в интервале [1;29]
ЭФР для дней между задержками на сетке геом распред, в интервале [48;61]
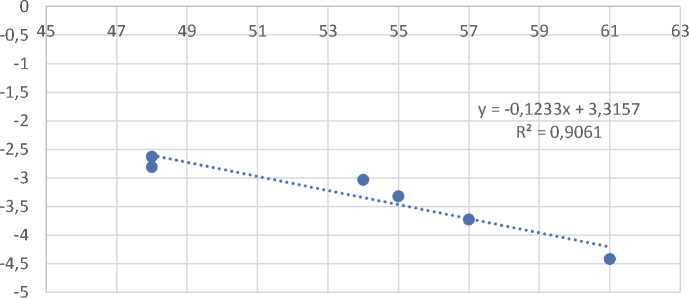
Рис. 6 – ЭФР для количества дней задержек поставок на геометрической сетке распределения в интервалах [1; 29] и [48; 61] дней
Для проверки нормальности ФР данных рекомендуется построить гистограмму и/или ЭФР. Если гистограмма демонстрирует явное отсутствие нормальности, можно сразу переходить к п.5 данного алгоритма. Если гистограмма не дает однозначного ответа на этот вопрос, нужно построить ЭФР на вероятностной сетке нормального закона.
Если данные соответствуют нормальному распределению, то ЭФР представляет собой прямую линию, и нужно следовать стандартному подходу к построению ККШ.
Если данные не соответствуют нормальному распределению, нужно рассчитать значение эксцесса. Если полученное значение меньше 6, то никаких изменений в традиционный подход вносить не нужно.
Если значение эксцесса больше 7, то для расчета контрольных границ ККШ целесообразно использовать коэффициенты, приведенные в таблицах 2 и 3 данной работы в зависимости от типа распределения данных и типа выбранной карты. Если реальная ФР не совпадает ни с какой из приведённых в таблицах 2, 3, выберите ту ФР, которая находится ближе всего на плоскости кривых Пирсона. Такая же рекомендация относится к случаю, когда реальная ФР совпадает по типу с приведённой в таблицах 3, 4, но имеет другие параметры, и когда реальная ФР неизвестна.
В случае значения эксцесса в диапазоне 6 ≤ β 2 ≤ 7, в зависимости от конкретной ситуации, можно использовать либо традиционный подход, либо коэффициенты из таблиц 2, 3 для ближайшей (на плоскости) ФР. Решение о том, какой вариант применить, должно принять лицо, отвечающее за качество процесса.
Что еще нужно сделать, если идеи этой работы будут поддержаны статистическим сообществом?
-
(а) Целесообразно обсудить правило дву-
- кратного изменения вероятности обнаружения ошибки I типа.
-
(b) Целесообразно расширить список ФР на плоскости Pl и 3" . Это позволит нам сделать границы для не-совершения-каких-либо-действий более точными.
-
(с) Представляется целесообразным более тщательно исследовать, зависят ли значения поправочных коэффициентов смещения только от эксцесса или от эксцесса и асимметрии одновременно.
Список литературы Влияние асимметричных распределений на коэффициенты контрольных карт Шухарта
- Alwan, L.S. (2000). Statistical Process Analysis. The McGrow-Hill Companies, Inc.
- Bai, D. S., and I. S. Choi. (1995). and R Control Charts for Skewed Populations. Journal of Quality Technology 27(2), 120-131.
- Borror, C. M., D. C. Montgomery, and G. C. Runger (1999). Robustness of the EWMA Control Chart to Non-Normality. Journal of Quality Technology 31(3), 309-316. DOI: 10.1080/00224065.1999.11979929
- Burr, I.W. (1967). The Effect of Non-Normality on Constants of and R Charts. Industrial Quality Control May, 563, 566-569.
- Chan, Lai K., and Heng J. Cui. (2003). Skewness Correction and R Charts for Skewed Distributions. Naval Research Logistics 50(6), 555-573. doi: 10.1002/nav.10077
- Cox, D. R. (1954). The Mean and Coeffi cient of Variation of Range in Small Samples from Non-Normal Populations. Biometrika 41(3/4), 469-481.
- David, H. A. (1970). Order Statistics. John Wiley & Sons, Inc.
- Goedhart R., Schoonhoven M., Does R.J.M.M. (2017). Guaranteed In-Control Performance for the Shewhart X and Control Charts. Journal of Quality Technology 49(2), 155-171. DOI: 10.1080/00224065.2017.11917986
- Hoerl, R.W., Snee, R.D. (2002). Statistical Thinking: Improving Business Performance. Duxburry Press. 10. ISO 7870-2:2013(en). Control charts — Part 2: Shewhart control charts
- Juran, J.M., Godfrey, B.A. (1998). Juran’s Quality Handbook. 5th Ed. N.Y., The McGrow-Hill Company, Inc.
- Karagöz A. (2018). Robust control chart for monitoring the skewed and contaminated process. Hacettepe Journal of Mathematics and Statistics 47(1), 223-242.
- Khakifi rooz, M., Tercero-Gomez, V.G., and Woodall, W.H. (2021). The role of the normal distribution in statistical process monitoring. – Quality Engineering, 33(3), 497-510. DOI: 10.1080/08982112.2021.1909731
- Knowler, L.A., Howell, J.M., Gold, B.K., Coleman, E.P., Moan, O.B., and Knowler, W.C. (1969). Quality Control by Statistical Methods. N.Y., The McGrow-Hill Company, Inc.
- Mao, H., C. N. Ginther, and W. H. Woodall. (2017). An Evaluation of Wheeler’s Method for Monitoring the Rate of Rare Event. Quality and Reliability Engineering International 33, 503-513. doi: 10.1002/qre.2024
- Montgomery, D.C. (2009). Introduction to Statistical Quality Control, Sixth Edition. John Wiley & Sons, Inc., Hoboken NJ.
- Pearson, E. S. (1950). Some Notes on the Use of Range. Biometrika 37(1/2), 88-92. doi: 10.2307/2332150.
- Pearson, E. S., and Adyanthāya. N. K. (1928). The Distribution of Frequency Constants in Small Samples from Symmetrical Populations. Biometrika 20A(3/4), 356-360. doi: 10.2307/2332117.
- Quesenberry Сh.P. (1993).The Effect of Sample Size on the Estimated Limits for and X Control Charts. Journal of Quality Technology 25(4), 237-247.
- Reference Manual. (2005). Statistical Process Control (SPC). Second Edition.
- Saleh N. A., Mahmood M.A., Keefe M.J., Woodall W.H. (2015). The Diffi culty in Designing Shewhart and X Control Chart with Estimated Parameters. Journal of Quality Technology 47(2), 127-138.
- Schilling, E. G., and P. R. Nelson. (1976). The Effect of Non-Normality on the Control Limits of Charts. Journal of Quality Technology 8(4), 183-188.
- Sheremetyeva S., Shper V. (2021). Quality Control of Deliveries by Using the Statistical Process Control. Product Quality Control, #4, 39-48 (in Russian).
- Shewhart, W. (1939/1986). Statistical Method from the Viewpoint of Quality Control. Republished in 1986 by Dover Publications, Inc., Mineola, NY.
- Spedding, T. A., and P. L. Rawlings. (1994). Non-normality in Statistical Process Control Measurements. International Journal of Quality & Reliability Management 11(6), 27-37.
- Vermaat M. B. (Thijs), Ion R. A., Does R. J. M. M., and Klaassen Ch. A. J. (2003). A Comparison of Shewhart Individuals Control Charts Based on Normal, Nonparametric, and Extreme-value Theory. Quality and Reliability Engineering International 19:337–353. DOI: 10.1002/qre.586
- Wheeler, D. J. (1995). Advanced Topics in Statistical Process Control. SPC Press, Knoxville, Tennessee.
- Wheeler, D.J. (2009). Transforming the Data Can Be Fatal to Your Analysis. https://www.qualitydigest.com/inside/healthcare-column/transforming-data-can-be-fatal-your-analysis-090309.html
- Wheeler, D.J. (2010). Are You Sure We Don’t Need Normally Distributed Data? - Retrieved August 2, 2021 from https://www.qualitydigest.com/inside/six-sigma-column/are-you-sure-we-don-t-neednormally-distributed-data-110110.html
- Wheeler, D. (2011). Working with Rare Events. - Retrieved September 21, from https://www.qualitydigest.com/inside/quality-insider-article/working-rare-events.html
- Wheeler, D. (2020). Process Behavior Charts and COVID-19. - Retrieved December 05, from https://www.qualitydigest.com/inside/healthcare-column/process-behavior-charts-and-covid-19-080320.html
- Woodall, W. H., Montgomery D. C. (2014). Some Current Directions in the Theory and Application of Statistical Process Monitoring. Journal of Quality Technology, 46(1), 78-94.
- Woodall, W. H., & F. W. Faltin (2019). Rethinking control chart design and evaluation. Quality Engineering 31(4), 596-605. DOI: 10.1080/08982112.2019.1582779
- Yourstone, S.A., and W. J. Zimmer. (1992). Non-Normality and the Design of Control Charts for Averages. Decision Science 23, 1099-1113.
- Шереметьева С. А., Шпер В. Л. Контроль качества Vladimir Shper, Candidate of Sciences, Leading Expert of the Laboratory of Hybrid Additive Technologies Svetlana Sheremetyeva, Graduate Student. процесса поставок с помощью методов статистического управления процессами // Шереметьева С.А. Шереметьева, В.Л. Шпер. – Контроль качества продукции. – 2021. – №4. – С. 39-48.
