Внедрение принципов бережливого производства на складе швейной промышленности

Автор: Агунг Чандра, Кристина Наталья
Журнал: Современные инновации, системы и технологии.
Рубрика: Прикладные вопросы и задачи применения систем и технологий
Статья в выпуске: 5 (4), 2025 года.
Бесплатный доступ
В условиях глобальной экономики швейная промышленность должна превосходить ожидания и повышать эффективность использования своих ресурсов за счет внедрения концепции бережливого производства. В одном из элементов цепочки поставок – на складе – были выявлены потери как не добавляемая ценность. Со временем, как бремя затрат для компании и источник жалоб, как фактор, способный снизить долю рынка, их необходимо свести к минимуму. Затраты на склад являются частью логистических расходов и с 2014 года входят в компетенцию правительства Индонезии, достигнув 24% валового внутреннего продукта (ВВП). Используя инструменты и методологию бережливого производства – DMAIC, 5Ws, а также простое программное обеспечение – Smartsheet и Excel – одна из швейных компаний успешно добилась снижения: сокращение сверхурочных работ на 41,96%, уменьшение количества жалоб клиентов на 19,5%, а также сохранение точности учета запасов на высоком уровне – 100%. Исходя из этого результата, внедрение концепции бережливого производства остается эффективным в устранении потерь на складе.
Концепция бережливого производства, себестоимость складских помещений, ВВП, инструменты бережливого производства.
Короткий адрес: https://sciup.org/14135223
IDR: 14135223 | DOI: 10.47813/2782-2818-2025-5-4-1037-1045
Текст статьи Внедрение принципов бережливого производства на складе швейной промышленности
DOI:
As predicted by LeRolland and Euromonitor [1] in 2024, global apparel and footwear sales were expected to grow by around 2% in constant terms and recover by late 2025 or early 2026. But interest rates will remain high and likely stay that way, continuing to squeeze consumers’ disposable incomes. In terms of category, children’s wear and sportswear were set to outperform the wider industry. Facing this complicated situation, the leaders and team are starting to allocate their resources in efficient, effective, and productive ways. Every department improves its primary activities. In an organization of apparel company, creative department has improved its design more interesting for baby and kids, marketing and sales has started offering the products to shopping center to be more reachable for people, supply chain management as an extended of logistics management [2] has improved the accuracy of inventory, optimized the vehicle’s capacity and minimized travel time, human capital has reviewed benefit and compensation, training and rules of the game to be preferred than before. Logistics, as a small part of supply chain management [3], accounts for around 5% to 35% for various organizations [4]. Logistics costs also became one of the Indonesian government’s concerns in 2014, reaching 24% of GDP, and this year, successfully reached 14% of GDP [5]. Based on this data, the leader must focus on logistics costs. Logistics costs include transportation, warehousing, inventory, administration, and packaging; to reduce logistics costs, one must also reduce the costs of their components.
Costs that add no value are classified as waste [6] and cause inefficiencies in systems. Waste is also stated as “Any substance, material or object which the holder discards or intends or is required to discard” [7]. There are seven wastes according to [8]: overproduction, waiting, extra processing, unnecessary motion, defects, unnecessary movement, and excess inventory. Lean philosophy is used to reduce waste, optimize core resources, and to establish a corporate culture dedicated to fostering customer satisfaction [9]. The Lean concept is an approach to continuous improvement that focuses on eliminating waste and unnecessary actions, also called non-value-added activities [10]. The Lean concept also increases customer value [11].
At this apparel company in Jatiuwung, Banten, there were some waste incidents resulting from internal causes, both in the warehouse and during road transportation. The causes generated by the warehouse were inaccurate picking (excess, fewer, or wrong items, including the wrong size and variance), overtime, and low storage utilization. The causes generated by road transportation were unmoving time, underutilized truck capacity, uncontrollable distance, such as unmatched goods shipped to customers, which will cause a second shipment to the same customer, and a non-optimal route. Both warehouse and road transportation are interrelated and under one umbrella. In this research, the warehouse became the main topic. Based on the listed wastes above, the company needs to reduce waste to improve efficiency in time and cost in the warehouse by implementing the lean philosophy.
MATERIALS AND METHODS
Definition, categories, and the effect of
WASTE ON FINANCE
Waste is non-added value. Waste is something the customer is not willing to pay for [12]. That is why the organization should eliminate all types of waste, leaving only the remaining one that has value for the company. Eliminating waste means synchronizing the demand of upstream and downstream that entitles the large-scale manufacturers to be able to control the production rate and to reorganize the whole transportation management from storing, load planning, shipping, and distributing the products by respecting the customers’ demand with accurate inventories [13]
There are two types of waste: obvious and hidden. It is vital to uncover the hidden waste because it is bigger than the obvious waste.
According to [14], there are eight categories of wastes:
-
• Waste in transport means unnecessary material movement or unnecessary tool or equipment movement
-
• Waste in inventory means excessive raw material or supplies inventories or excessive process (WIP) inventories. This excessive inventory will increase the cost of renting additional facilities to store it.
-
• Waste in motion means unnecessary movement and motions of the worker or the machine. This excessive movement needs to be modified to improve the layout's ergonomics. This unnecessary movement will lead to inefficient time
-
• Waste in waiting means man idle or machine idle
-
• Waste in overproduction means producing more than what is needed or producing faster than what is scheduled
-
• Waste in over-processing means non-value-added man processing or non-value-added machine processing in other words, waste in time
-
• Defects mean materials used due to defects and rework or processing due to rework or repair of defects that resulted from poor planning or poorly skilled personnel.
-
• Waste in skills means the underutilized abilities of a worker
The most direct effect of wastes will be on cost. The higher cost means the higher price, because price equals cost plus profit. If the company does not check waste, especially hidden waste, its profit will shrink, and a competitor will dominate the market.
To eliminate this, one can apply lean concepts to improve the performance and effectiveness of organizations by eliminating processes that do not generate value [15]. Lean manufacturing has a positive and significant influence on both financial performance and sustainable finance [16].
Warehouse waste
Generation of waste in warehousing operations implies two costs [17]:
-
• the value added, which is lost; and
-
• the cost of disposals, which is ever-increasing.
When there is a scrap, there will be some space occupied by it, and this scrap will remain unused until it goes to the dump. The space occupied by scrap also costs.
Lean warehousing can lead to improved productivity, quality, and employee satisfaction. Lean warehousing also influences performance [18]. According to [19], lean in the warehouse focuses on assembling warehouse orders as efficiently as possible, minimizing non-value-adding activities in receiving, put-away, picking, packing, and shipping. To minimize non-value-adding activities, one must identify waste. Efficient warehousing management can bring about valuable developments and philosophies.
According to Burton [20], it is always cheaper to do the job right for the first time. Bozer [21] stated that lean warehousing is a management system that is composed of the following principles:
-
• Use 5S (Seiri, Seiton, Seiso, Seiketsu, Shitsuke) to achieve perfection within the warehouse.
-
• Continuously improve the warehouse through problem-solving and kaizen. Promotion of
continuous improvement is of utmost importance to achieve meaningful improvements.
-
• Visualize the work within the warehouse in real time. Furthermore, start shifts with meetings to discuss performance, improvement opportunities, and potential difficulties.
-
• Standardize the warehouse. Use standardized equipment within the warehouse and standardize the process through paper-based work instructions.
-
• Reduce the number of “touch points” for every order.
-
• Reduce excess inventory by single-piece flow and frequent small replenishment cycles. But do not forget to compare the price between the one-time replenishment and the supplier's frequent small replenishments.
-
• Measure, improve, and justify cubic and squaremeter storage density with the intent to improve storage as well as travel times.
-
• Create flow by scheduling inbound/outbound shipments by time windows and dispatching orders based on available capacity. Furthermore, create a balanced workload across the warehouse's functional departments.
-
• Store products to enable the minimization of travel distance, minimization of picking time, and optimization of storage density.
-
• Do training for blue-collar workers on Lean principles, and stimulate lean leadership on the warehouse floor. Implement by pilot facilities for lean rather than full implementation from the start. Implementation and lean leadership have to be enabled by continuous learning and training.
Lean management as a tool for reducing
WASTE AND ACHIEVING CUSTOMER VALUE
Lean management is a set of practices intended to obtain perfect processes through continuous elimination of waste and permanent improvement. Lean management becomes valid and useful when tools such as Just in Time, TQM, Visual Stream Map, or 5S are put into practice [22].
The purpose of lean management is to achieve more customer value, such as better cost, better quality, and better time in product delivery, and to reduce wasteful steps via continuous improvement. Lean management seeks to eliminate all kinds of waste to reduce cost and lead time, and maximize efficiency and effectiveness based on customer demand [23].
Methods used in this research
The main objective of the methodology is to explain the entire set of methods used, data collection instruments, the way they were analyzed, and the path taken from the beginning to the end of the study, to inform the reader of the general work construction process and achieve the proposed end of the investigation. This research can be considered quantitative, seeking to analyze and record information gathered through data collection. The data collected was the warehouse's performance throughout 2024. After that, the data was analyzed using lean tools and a computer, with supporting software such as Lucidchart.
These four approaches or methodologies are summarized in Table 1 and are easier to understand.
T able 1. F our methodologies to kaizen problem solving .
|
PDCA |
DMAIC |
A3 |
SD |
|
Plan |
Define |
Clarify the problem |
Identify the team |
|
Measure |
Breakdown the problem |
Define problem |
|
|
Set a target |
Contain symptom |
||
|
Analyze |
Analyze the root cause |
Identify root causes |
|
|
Develop countermeasures |
Choose corrective actions |
||
|
Do |
Improve |
See countermeasures |
Implement corrective actions |
|
Check |
Control |
Evaluate results and processes |
Make change permanent |
|
Act |
Standardize success |
Recognize the team |
Source: Swamidass [24]
Software used in this research
Software will make your job easier and faster. In this research, the authors used Microsoft Excel and Smartsheet. Smartsheet is a web-based diagram application available at [29], where users can collaborate visually to draw, revise, and share diagrams and to enhance organizational processes, systems, and structure. In this research, Smartsheet was used to map value streams.
RESULTS AND DISCUSSION
This section presents the results of implementing lean concepts in the apparel company's warehouse operations. The findings are structured according to the DMAIC methodology and supported by value stream mapping and key performance indicators. The analysis focuses on changes in stock accuracy, customer complaints, storage capacity utilization, and overtime, highlighting measurable improvements achieved after applying selected lean tools.
Table 2 presents the alignment between the DMAIC phases and the corresponding lean tools applied in the warehouse improvement initiative. It summarizes the structured approach used to identify, measure, analyze, improve, and control warehouse performance, providing a clear framework for implementing lean practices throughout the study.
Value stream mapping
T able 2. DMAIC and lean tools for the warehouse .
|
DMAIC Steps |
Tools of Lean |
|
Define |
VSM |
|
Measure |
Lean Metrics – KPI: stock accuracy, storage capacity, customer’s complain per month, overtime |
|
Analysis |
5Ws |
|
Improve |
OEE – Overall Equipment Effectiveness |
|
Control |
KPI report every month |
Step 1: Define
In this step, problem identification began, and several essential elements were checked: stock accuracy, storage utilization, and customer complaints (Figure 1).
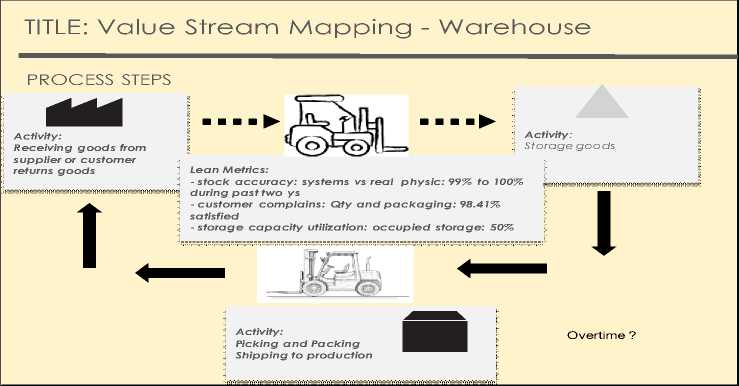
Figure 1. VSM for warehouse.
S tep 2:
CustomerOvertime
Stock accur
Stock accu a warehouse needs to kno to order, an inaccurate, t
ill affect the sales.
Stock accuracy =
counted items items on record
x 100%
ory accuracy nds of items: ds (01), and cember 2022 In February 2025, accuracy remained 100%.
T able 3. S tock accuracy from 2022 to 2025.
|
Period |
Raw Material |
Packaging |
Finished Goods 1 |
Finished Goods 2 |
|
2022 – December |
97.20% |
98.09% |
100.00% |
99.98% |
|
2023 – April |
98.20% |
99.90% |
99.97% |
99.98% |
|
2023 – December |
99.18% |
99.72% |
99.92% |
100.00% |
|
2024 – April |
100.00% |
100.00% |
99.98% |
100.00% |
|
2024 – December |
100.00% |
100.00% |
100.00% |
100.00% |
|
2025 – March |
100.00% |
100.00% |
100.00% |
100.00% |
Customer complaints
Since 2023, customer complaints have been a focus in the warehouse. The complaint that related to warehouse activities was quantity suitability – can be less or more than requested, SKU suitability (size, color, item description), and date of shipment (Table 4).
T able 4. C ustomer complains .
|
Period |
2023 |
2024 |
Jan 2025 |
|
% Customer complaint |
1.23 |
1.59 |
1.28 |
The company's complaint policy was only 2% at most. But the goal is zero. Even though achieving it was hard, and the results were flat for two consecutive years, the employees and management tried to perform better. The efforts were:
-
• Made the packaging different between a complete quantity order and a non-full quantity order
-
• For a non-full quantity order, the picker must let the packaging open to make the checker's check easier
-
• Both the checker and the picker prepared and checked the goods by seeing the label and primary packaging, and not by seeing the handwriting in secondary packaging.
As a result, in 2025, the rate of complaints decreased by around 19.5% compared to 2024.
Storage capacity
Storage capacity is strongly related to inventory. When the inventory is overstocked, then the storage will be close to fully utilized, and vice versa.
Utilization rate of capacity in warehouse:
—т^^РО^—* 100% (2)
t о ta I ava 11 a b I e spa ce
The utilization of the warehouse varied month to month because it followed sales orders. During peak season, the utilization rate was close to 85%, and during low season, it was around 55%.
Overtime
The last one measured overtime reflected in the warehouse (Table 5).
T able 5. O ver time , from 2023 to J une 2025.
|
Total overtime |
Total working hours |
Ratio |
|
|
2023 |
1,846 |
31,104 |
5,93% |
|
2024 |
1,387 |
30,976 |
4.48% |
|
2025 |
360 |
14,336 |
2,51% |
Source: Authors
Step 3: Analysis
Stock accuracy and customer complaints
Using the 5Ws template for the warehouse required implementing job rotation, which will produce some checkers or packers (Figure 2). The advantage is that stock accuracy will increase and customer complaints will decrease.
DEFINE THE PROBLEM
Stock accuracy was not 100%
PRIMARY CAUSE
Why is it happening?
It is happening because there were some SKUs that physically quantity not the same with computer systems
Why is that?
It is happening because the checker did not check accurately whether quantity, size or color according to the pick list
WHY IS THIS A PROBLEM?
Why is that?
It is happening because the checker had a double activities, checking the product and packing the product
Why is that?
It is happening because there was no worker can do that job
Why is that?
ROOT CAUSE
It is happening because there was no job rotation
CORRECTIVE ACTION
PARTY RESPONSIBLE
Warehouse manager
CORRECTIVE ACTION TO TAKE
DATE ACTION TO BEGIN
There must be a job rotation in warehouse, then there will be one more person can be a checker or a packer
March 03, 2025
DATE TO COMPLETE
Jun 02, 2025
Figure 2. 5Ws template for warehouse analysis (Source: authors).
Storage capacity
In short, storage capacity was designed for the next 10 years, so it was not a big deal.
Overtime
Overtime changes were happening in transportation and the warehouse. The most significant portion was the driver, followed by the picker. In 2023, total overtime was 1,846-man hours (Figure 3).
|
Position |
Q1 |
Q2 |
Q3 |
Q4 |
Total |
PCT |
|
Spv |
47 |
46 |
21 |
11 |
125 |
11.62% |
|
Driver |
185 |
134 |
104 |
124 |
547 |
40.83% |
|
GR |
49 |
31 |
24 |
43 |
147 |
10.86% |
|
Adm |
12 |
7 |
5 |
44 |
68 |
2.39% |
|
Picker |
93 |
80 |
90 |
66 |
329 |
22.80% |
|
OB |
1 |
0 |
0 |
0 |
1 |
0.11% |
|
RM & Pack |
3 |
27 |
16 |
45 |
91 |
4.13% |
|
Checker |
33 |
25 |
5 |
8 |
71 |
6.51% |
|
Op Forklift |
7 |
0 |
1 |
0 |
8 |
0.76% |
|
Total |
430 |
350 |
266 |
341 |
1387 |
100.00% |
Figure 3. Overtime data 2024 (source: authors).
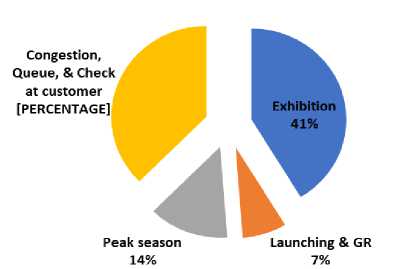
Figure 4. The causes of overtime (Source: authors).
The most considerable portion was the exhibition event. When a company participates in an exhibition, loading-in and loading-out hours must be followed according to the exhibition regulations. Frequently, the loading time was after working hours, then overtime happened.
To minimize congestion, one must first check the route in the transportation software to see if it is marked in red. If this action is done regularly, then the travel time will be reduced. Launching new products and goods received can be avoided by better managing the lead time in the production process.
Step 4: Improve
Improvements must be made for the elements of service, performance, and availability. Capacity utilization and overtime hours were poor indicators for the warehouse. As explained earlier, the storage capacity was designed for the next 10 years (Table 6). It can be monitored only. Overtime has been an issue for the past two years, and some efforts have been described at step 3.
T able 6. OEE for warehouse .
|
Elements |
KPI |
Result |
Average |
|
Service losses - Quality efficiency |
Uncomplained customer order |
98,72% |
98,72% |
|
Capacity losses -Performance efficiency |
Stock accuracy |
100,00% |
85,00% |
|
Capacity utilization (internal storage) |
70,00% |
- |
|
|
Availability losses: |
|||
|
- Administrative availability efficiency |
expected date of report / actual date |
100,00% |
82,50% |
|
- Operating availability efficiency |
expected overtime hours / real overtime hours |
65,00% |
- |
|
OEE = quality x performance x administration x operating |
- |
69,23% |
|
Source: Authors
Step 5: Control
Elements of the OEE must be monitored regularly and action taken, if necessary, especially regarding overtime (Table 7).
T able 7. S ummary before and after the implementation of lean in the warehouse .
|
Measurement |
Before (%) |
After (%) |
% improvement |
|
Stock accuracy |
100 |
100 |
0 |
|
Customer complain |
1.59 |
1.28 |
19.49 |
|
Overtime |
4.48 |
2.60 |
41.96 |
Source: Authors
CONCLUSION
There were numerous studies on lean in warehouses, with the goal of minimizing waste in both areas. The benefits of waste minimization were cost reduction or profit increase, time efficiency (the use of time was more productive), performance increases, and more productive resources. To achieve these benefits, an organization implemented some lean tools and data relevant to warehouse activities. Data for the warehouse were stock – beginning stock, transaction, and end stock, customer complaints, used and capacity of storage, and overtime cost. Lean tools used to minimize waste include VSM, 5Ws, OEE, and TOVE. In this research, the DMAIC was used as a methodology.
These benefits showed that implementing the lean concept in the warehouse resulted in a 19.49% decrease in customer complaints and a 41.96% decrease in overtime. Reduced customer complaints mean the picking and shipping processes are more accurate than before. Decreased overtime means the logistics cost is decreasing as well.
For future research, the researchers can assess the effectiveness of lean tools and identify the most qualified lean tools for waste reduction. Then they can apply the same thing to an organization around the world.
